

designer491/iStock via Getty Images
(This article was co-produced with Hoya Capital Real Estate)
Introduction
The next chart explains why Fixed Income investors are looking at Preferred Stock funds, especially the higher yielding Closed-End-Funds, to hopefully beat inflation (before taxes, though after would be better).
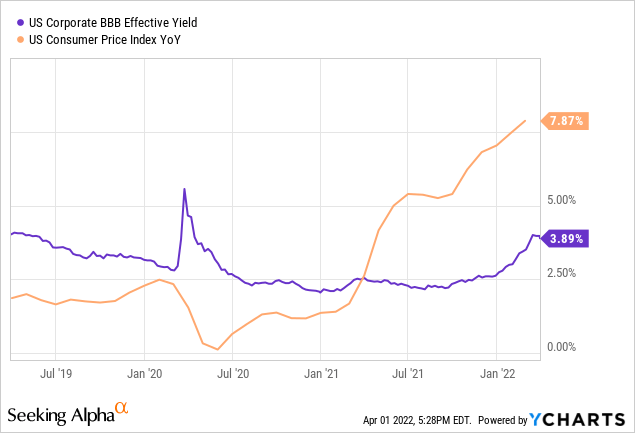
March’s YOY inflation is approaching 8%, again making a 40-year high. In March, the Fed Board raised the Fed Funds rate 25bps, with promises of many more to come over the next two years in hopes of slowing demand as a solution to supply-chain induced cost increases. With unemployment at 3.6%, basically matching the pre-pandemic low, wage-induced inflation should also slow if the economy does.
With 1-year CD rates at 1+% and the S&P 500 yielding about the same, investors have to take on risk to even hope to earn what inflation is taking away. Preferred Stock Closed-End Funds were doing that for years but not currently. That said, other than BDC assets, the yields are tempting, though there is the price risk that needs to be understood: prices drop as interest rates climb. By focusing on funds that hold floating-rate assets, that risk should be lower than owning assets that do not reset as rates climb.
Based on FFC’s lower fees, which helps explain its CAGR edge, I recommend NYSE:FFC over NYSE:HPI. Others might like HPI’s asset allocation better.
Exploring the John Hancock Preferred Income Fund
Seeking Alpha describes this CEF as:
John Hancock Preferred Income Fund is a closed ended balanced mutual fund. The fund invests in the public equity and fixed income markets of the United States. It seeks to invest in securities of companies operating across diversified sectors. The fund primarily invests in preferred value stocks of companies, convertible preferred securities, and investment grade fixed-income securities rated investment grade or higher by Moody’s or Standard & Poor’s. It benchmarks the performance of its portfolio against the Bank of America Merrill Lynch Hybrid Preferred Securities Index and Barclays U.S. Aggregate Bond Index. HPI started in 2002.
Source: Seeking Alpha HPI
HPI has $496 million in assets and currently has a Forward yield of 7.8%. The fees on this CEF are very high: 2.31%, especially compared to competitors. This includes 115bps for the managers and 116bps listed as other expenses, including costs to support the 34% leverage ratio. HPI today is at a .41% premium.
John Hancock Investment Mgmt HPI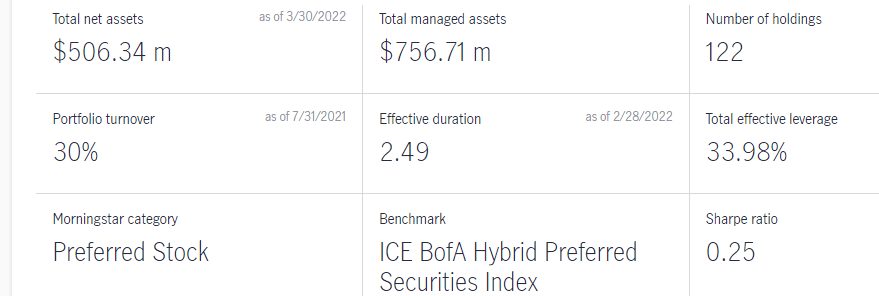
With interest rates on the rise, a 2.49 duration isn’t too bad. That equates to 249bps loss if rates go up 100bps.
John Hancock Investment Mgmt HPI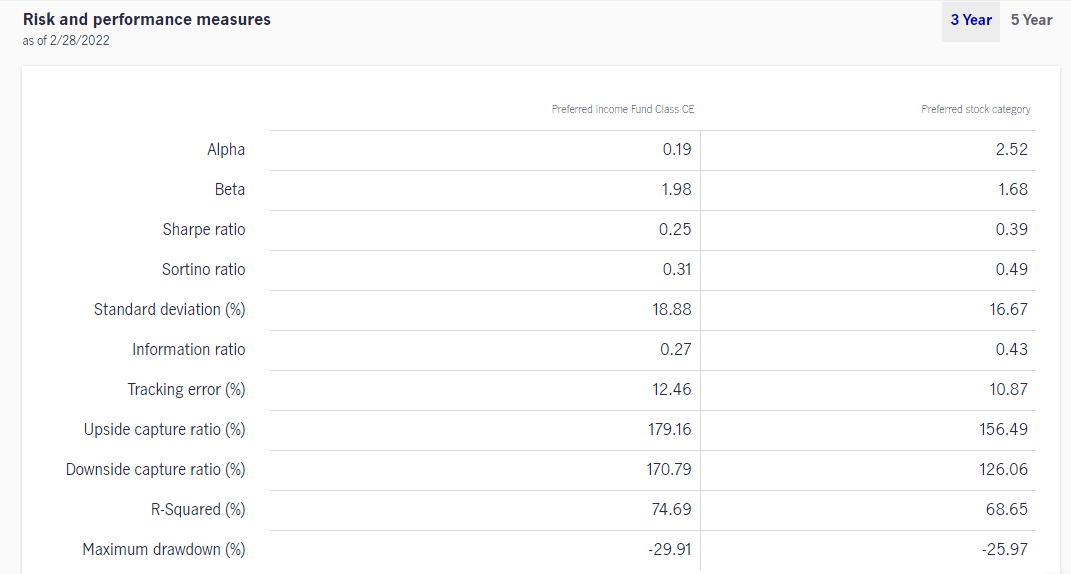
The source did not clarify which Preferred stock index data was used but HPI does not compare well against the one selected by the manager’s website to use. What is very clear, investors are not getting rewarded for the risks HPI is taking apparently versus other index-based Preferred stock funds.
HPI Holdings review
John Hancock Investment Mgmt; compiled by Author
The weights reflect the fact that HPI is 34% leveraged; adjusted sets the total to 100%. There is no currency hedging assets in the CEF.
John Hancock Investment Mgmt; compiled by Author John Hancock Investment Mgmt; compiled by Author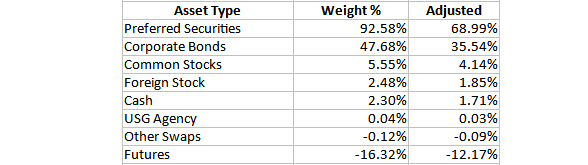
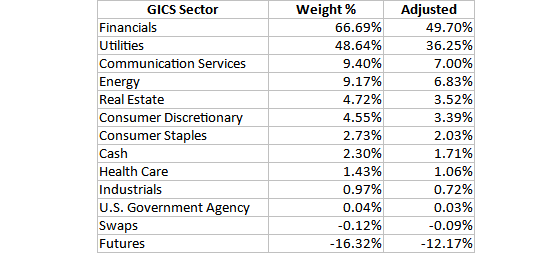
No surprise that Financials are the dominating sector as banks and insurance companies can include certain Preferred Stocks in their capital base.
Some important pieces of information are missing from the data presented:
- what percent of the Preferred Securities is floating-rate?
- what percent is currently floating?
- what percent have rate floors and what those are?
Using various sources, I came up with other holdings data investors should know:
- 10% of the portfolio matures this year; not counting Swaps/Futures. Another 16% matures in 2023/2024.
- Of the fixed income holdings, 58% are rated BBB, 38% BB, and 4% B.
- Average coupon is 4.27%.
- Average bond price is $101.26.
John Hancock Investment Mgmt; compiled by Author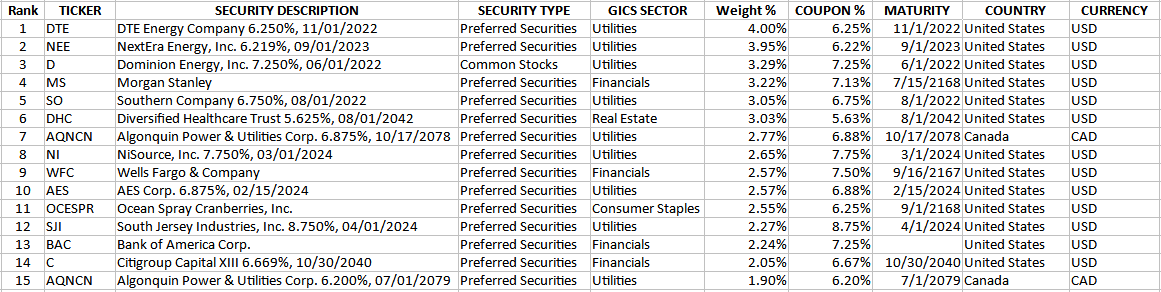
The actual largest holdings is a 14.6% LIBOR Swap, that was offset by a -14.7% position in another LIBOR swap; both expire 10/27/22. HPI is also short futures on the US 10-Yr Note, expiring in June (16.4% of the assets).
HPI provided the top Issuers as the CEF can, and does, on more than one asset from multiple Issuers.
John Hancock Investment Mgmt HPI Issuers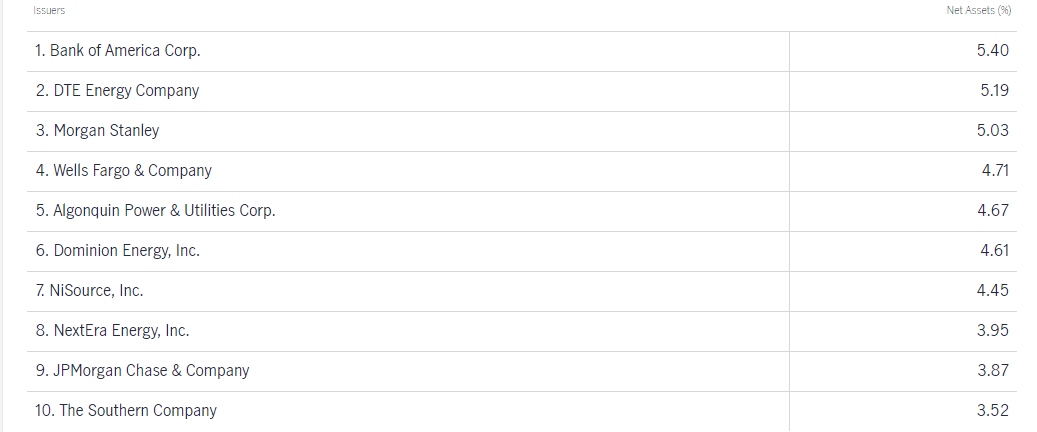
These Issuers, all banks and utility companies, represent 45% of the assets.
HPI Distribution review
Seeking Alpha HPI DVDs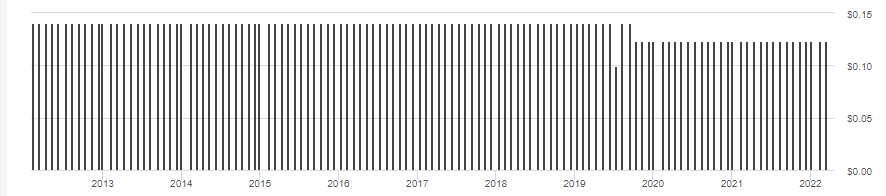
Distributions have remained level since the late 2019 reduction, unlike other Preferred stock funds when COVID-19 hit. As the next chart shows, some of the distributions have been ROC.
Fidelity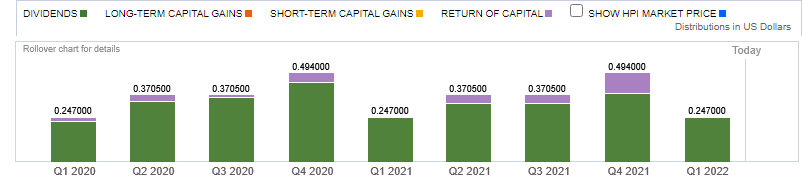
For 2020, 5.3% were classified as ROC; for 2021, it was 9.3%.
HPI Price and NAV review
CEF Connect HPI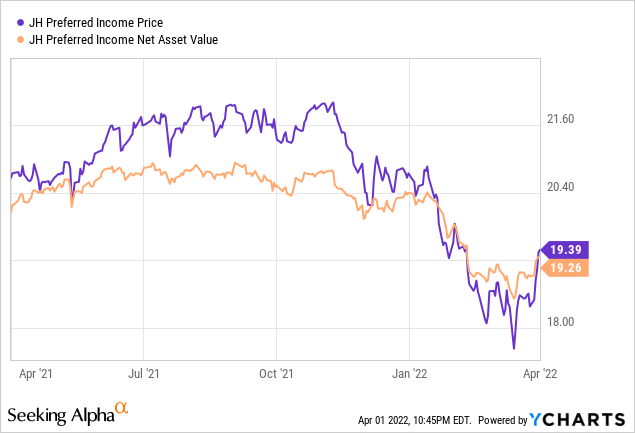
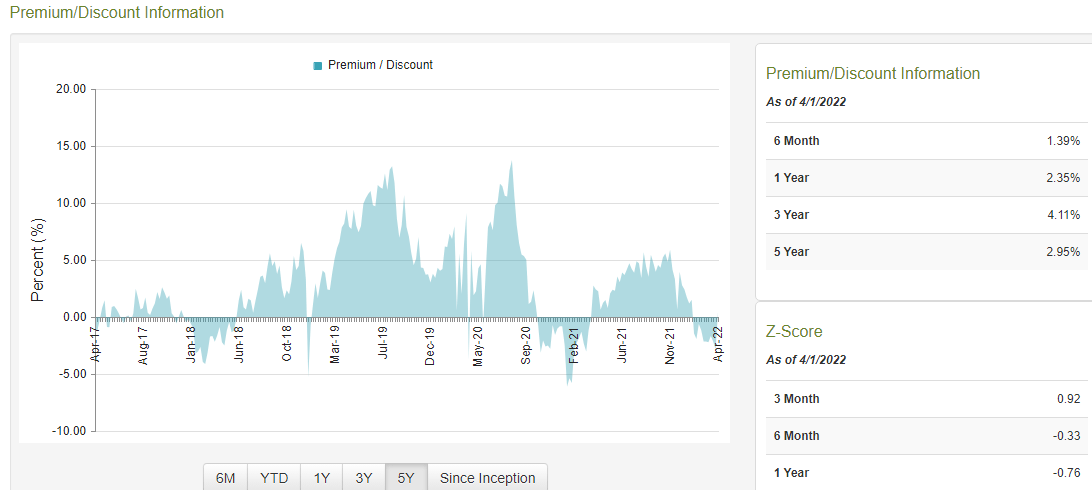
HPI recently went to a premium after spending most of the 1st quarter trading at a discount, twice at/near 4%. Prior to that, 5% premiums were common last summer.
Exploring the Flaherty & Crumrine Preferred Securities Income Fund
Seeking Alpha describes this CEF as:
Flaherty & Crumrine Preferred Securities Income Fund is a closed-ended balanced mutual fund. The fund invests in the public equity and fixed income markets of the United States. It seeks to invest in securities of companies operating across diversified sectors. The fund primarily invests in investment grade preferred securities consisting of hybrid or taxable preferreds. It employs quantitative analysis to create its portfolio. The fund benchmarks the performance of its portfolio against the Merrill Lynch 8% Capped DRD Preferred Stock Index, Merrill Lynch Hybrid Preferred Securities Index, and Merrill Lynch Adjustable Preferred Stock 7% Constrained Index. FFC started in 2002.
Source: Seeking Alpha FFC
FFC has $914m in assets and provides investors with a Forward yield of 7.3%. Fees are more in line with other Preferred Stock CEFs at 129bps, consisting of the following: Manager fee: 64bps; Leverage cost: 45bps (LIBOR+.8%); Other expenses: 20bps. These fees were reported in the last Annual Report (11/30/21). Leverage at the time was 34%. FFC currently trades at a 4.44% premium.
FFC Holdings review
Flaherty & Crumrine FFC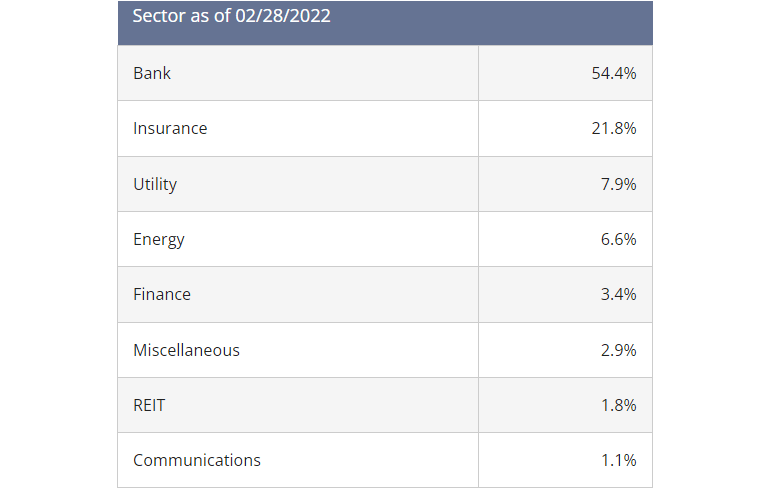
If you add Banks, Insurance, and Finance weights, you get almost 80% in what HPI defined as Financials. There, these were just over half the assets. FFC compensates by holding much less in Utilities assets than HPI does.
The Top eight Issuers are representing 26% of the assets:
Flaherty & Crumrine FFC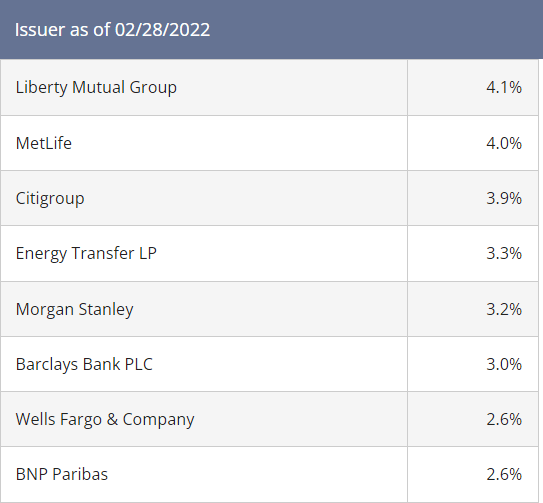
The FFC had no holdings data and another site says these holdings are from 11/30/21.
Seeking Alpha FFC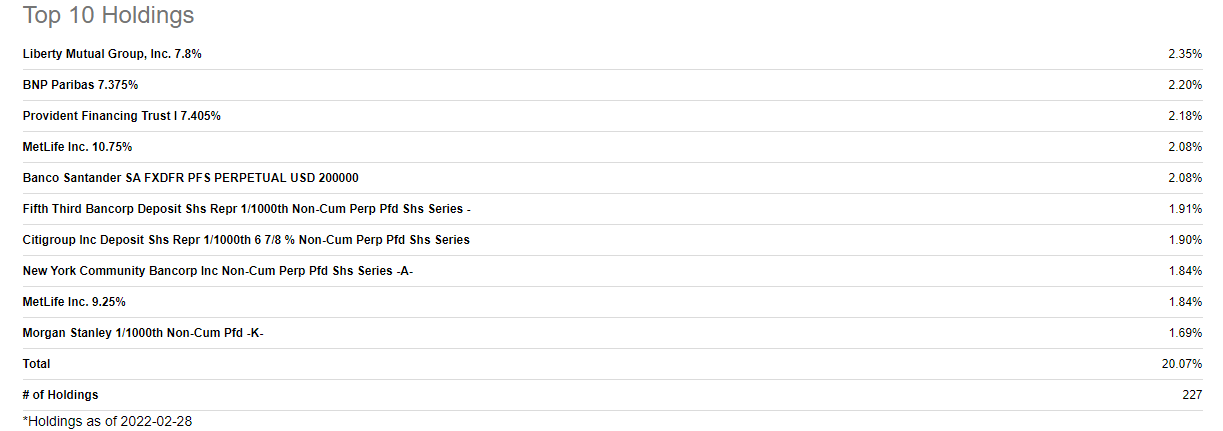
Because there was no source for all 227 holdings, I wasn’t able to do sector analysis. FFC did show country allocations, the Top 8 being:
Flaherty & Crumrine FFC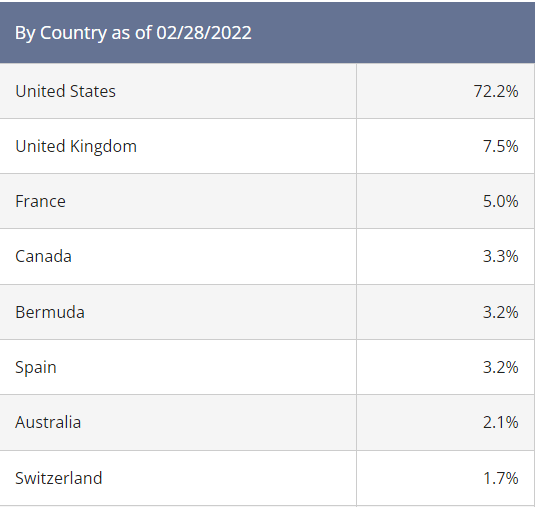
Without a complete holdings list, I don’t know if FFC currency hedges. The bond ratings were provided: 42% BBB; 38% BB; 20% Not rated. One site listed the average coupon at 6.6%.
FFC Distribution review
Seeking Alpha FFC DVDs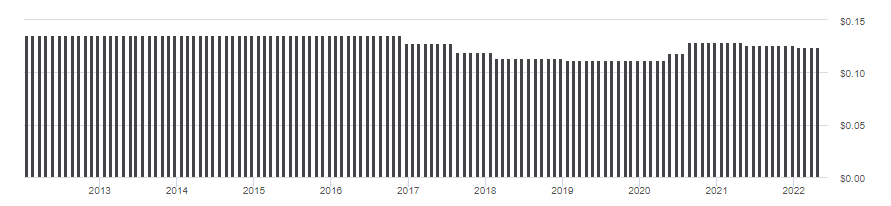
Monthly payouts were reduced coming into 2022, from $.1265 to $.1240. FFC lists the 2021 payouts as 100% Ordinary dividends, no ROC involved. I also found no wording indicating FFC, like other CEFs, follows a managed distribution policy.
FFC Price and NAV review
CEF Connect FFC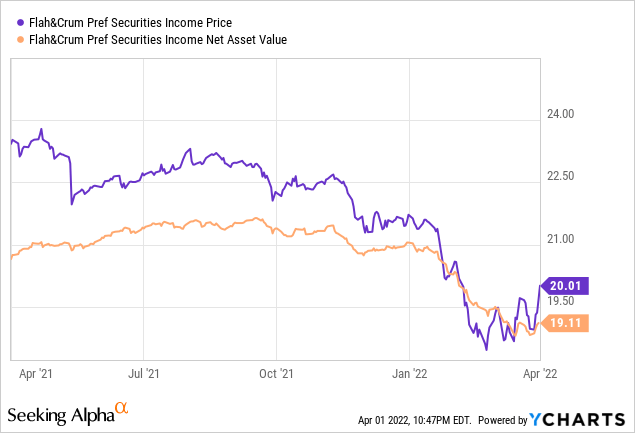
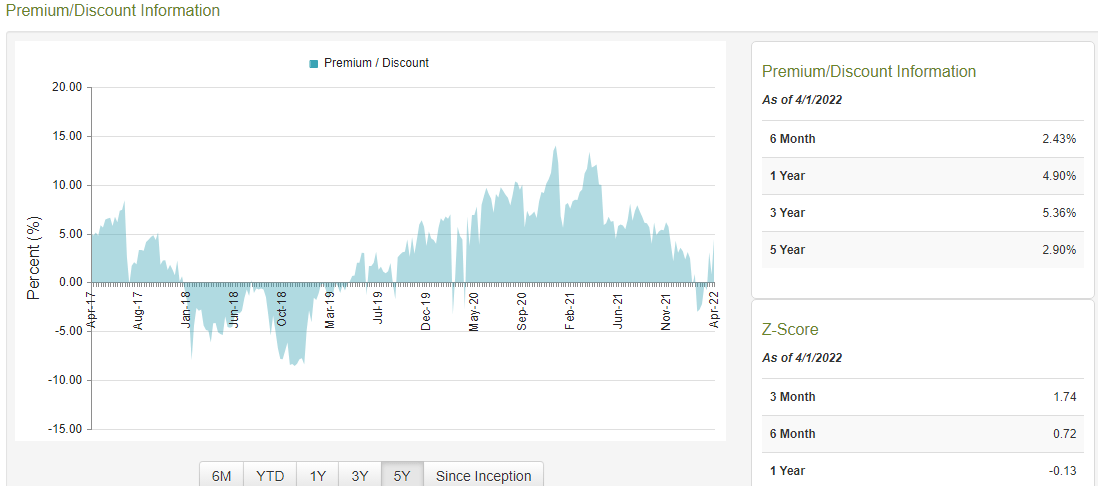
FFC currently sells at a higher premium than HPI does, but its 1-year Z-score is not that much lower due to FFC mainly trading between premiums of 5-10% over the last two years. While HPI has spiked higher, it usually doesn’t stay at those elevated levels.
Comparing CEFs
Besides the fee and premiums differences, the two CEFs have different asset allocations that might influence an investor’s opinion on which to own from here:
| Asset Class | HPI | FFC |
| Preferreds | 53% | 38% |
| Convertibles | 3% | 19% |
| Corporates | 31% | 42% |
| Government Related | 10% | 0% |
| Cash | 3% | 1% |
Portfolio Visualizer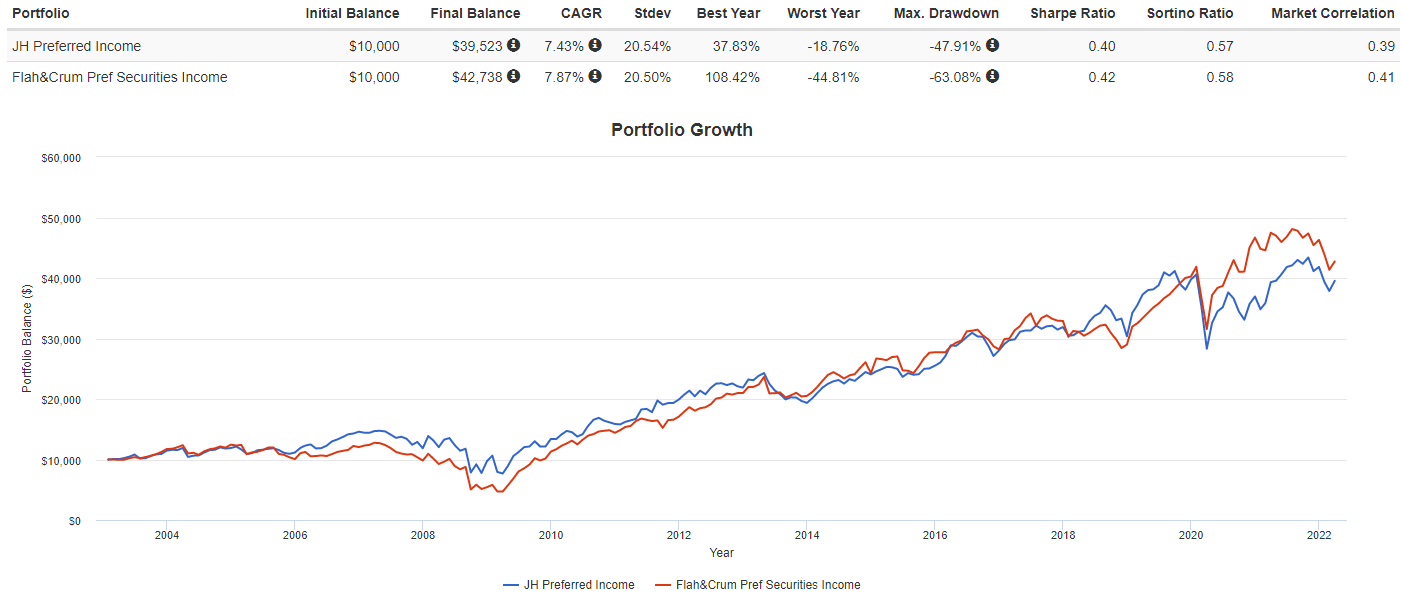
While other factors obviously play a part, the fee difference between HPI and FFC more than accounts for the 44bps in CAGR. While both StdDev are within 4bps, FFC has given investors a more wild ride as its Best/Worst years and Max Drawdown are all much larger than HPI’s.
For the next set of charts, I included two sister CEFs Hancock offers: JH Preferred Income II (HPF) and the JH Preferred Income III (HPS), both recently reviewed on Seeking Alpha.
John Hancock Investment Mgmt Fund Compare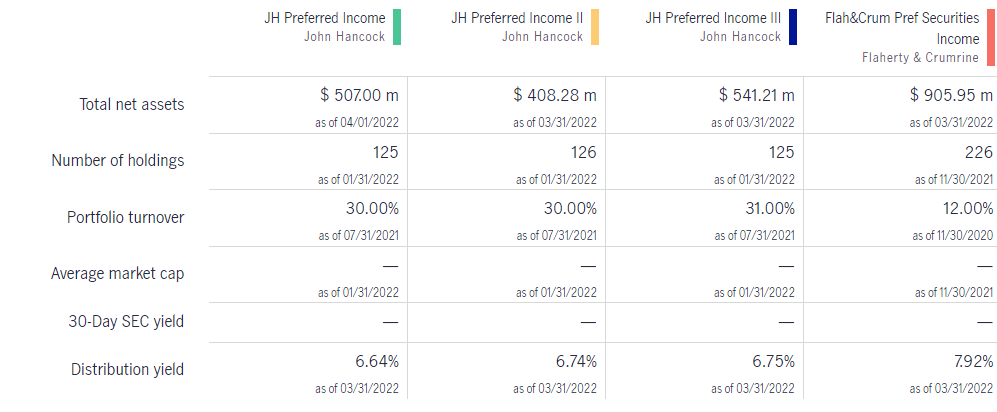
The three Hancock CEFs are very similar in these factors. FFC is the largest of the four and keeps its turnover to 40% of what the Hancock CEFs incur.
John Hancock Investment Mgmt Fund Compare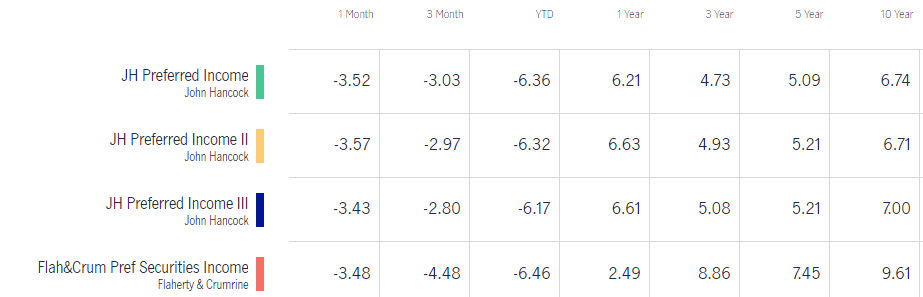
While FFC has the best 10-year return, the past year has seen the Hancock funds take the lead. Amongst the Hancock CEFs, HPS is top performer, not HPI.
John Hancock Investment Mgmt Fund Compare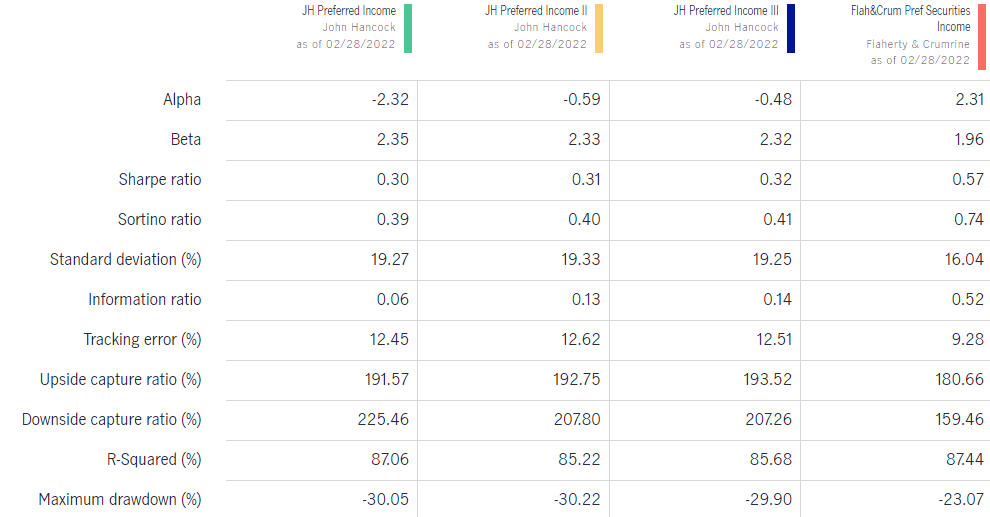
Here, Beta indicates the Hancock CEFs are more volatile and generate much lower Alphas. Notice here, the StdDev results show a wider difference between HPI and FFC then the PortfolioVisualizer data does. The Maximum Drawdown results show results opposite of those from PV. Some of these difference could be the time period used: 3 years here; 19 for PV. Though the real difference between the Hancock CEFs and FFC is the latter’s ability to avoid the bad times versus the other CEFs.
Conclusion
With the understanding that my conclusion is based on my portfolio goals for owning a fixed income fund (income 1st, return 2nd) and those are not everyone’s, here is why I would pick FFC over HPI:
- Gain 100bps in possible return by owning fund with lower fees.
- Historically superior CAGR and risk statistics.
- Better asset mix by avoiding lower yielding Agency debt but including higher levels of Corporates and especially Convertibles.
- Lower portfolio turnover rate cuts trading costs and shows more conviction to assets owned.
That isn’t to say HPI has no factors in its favor:
- 50bps yield advantage would appeal to income-only focused investors.
- Lower premium and across-the-board better Z-Scores to support where the Price/NAV relationship could go.
Portfolio Strategy
Floating-rate assets are attractive in a rising-interest-rate environment because their prices are less sensitive to changing interest rates. Their coupon rate adjusts to shifts in short-term interest rates, so their prices don’t need to. For either of these funds, I could not find what percent of their holdings have that feature or what rate they adjust with. Potential investors should contact the manager and request that information before buying.
To maybe get a feel for what kinds of Preferreds HPI and FFC own, I compared them against the Nuveen Variable Rate Preferred & Income Fund (NPFD).
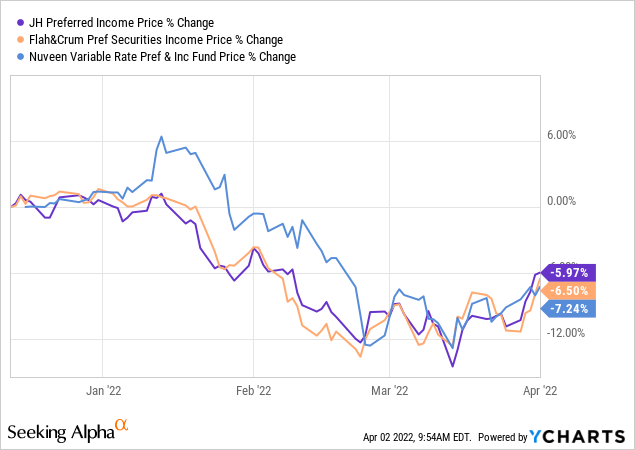
While very unscientific, as NPFD is almost 100% floating/variable, this could indicate both of these CEFs are too.
Investor beware
I thought I would be a little different here and list items all investors need to be aware of as they perform their due diligence analysis. When researching for articles on funds of any type, being sure I report back the right numbers sometime requires verification. While not always recent data, the fund’s webpage is a good place to start. Here are some common ones that require extra review.
Fund Fees:
Sounds straight forward, but for some reason, not all sites show the same level of fees: HPI is a good example. I used the Fund’s site in this article:
John Hancock Investment Mgmt HPI fees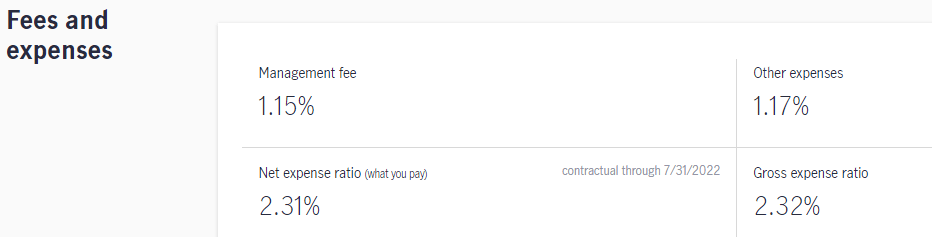
Seeking Alpha shows the total fee being 1.6%, as does CEFConnect.com.
CEF Connect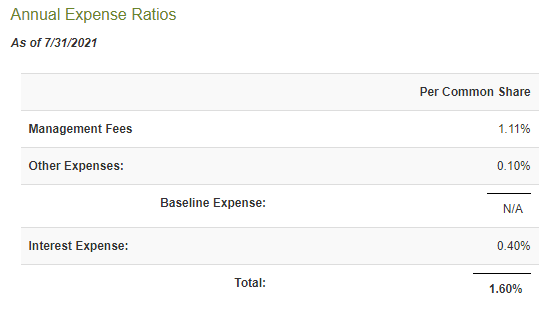
Notice the date difference; the Hancock site is newer. The 12/31/21 Factsheet also lists fees at 2.31%. The fee difference is related to the leverage costs as the management fees are only different by 4bps. Another site listed 1.6% but with a footnote that the leveraging costs were not included. Since fees reflect Net CAGR, knowing the correct level is important.
Benchmarking
For most passive ETFs, the benchmark drives results. For CEFs, they are used to gauge how well the CEF’s strategy compares to an Index.
John Hancock Investment Mgmt John Hancock Investment Mgmt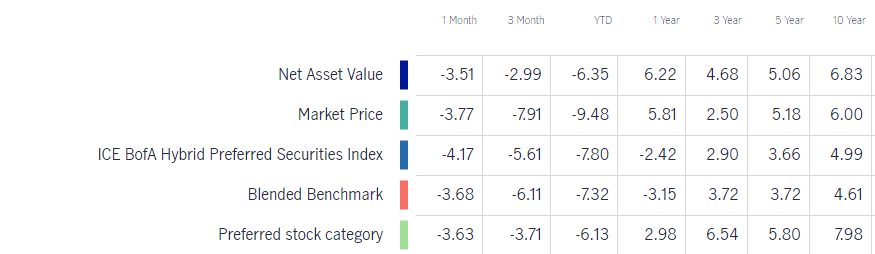
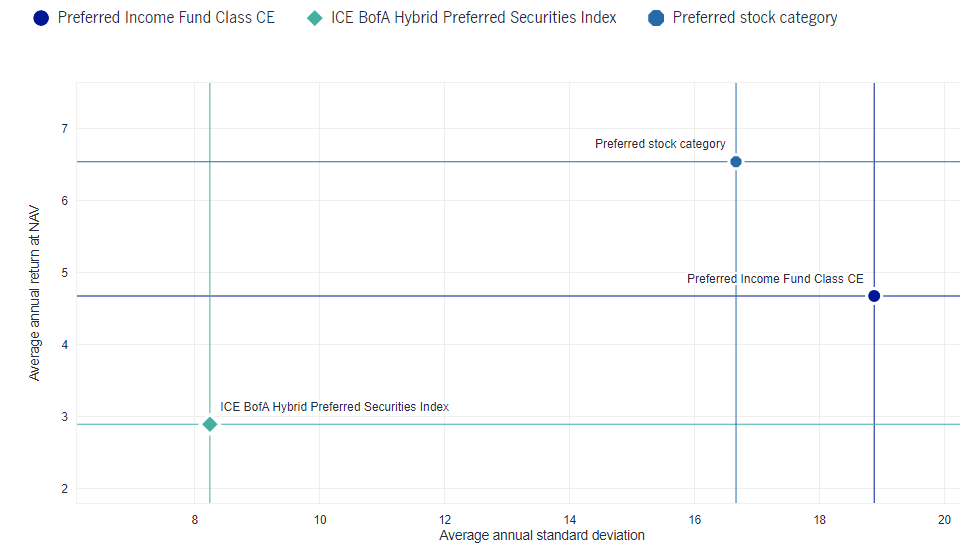
HPI lists two benchmarks they compare their CEF against, one being the ICE BOfA PFD one in the above charts. Compared against this benchmark, HPI is far ahead. The second chart might bring into question whether that is the appropriate benchmark for HPI to use. The ICE BOfA PFD Index has half the StdDev, meaning it is a much more conservative index than how HPI invests. Of course, leverage, not in the index, explains some of that. In Hancock’s defense, they do include a Preferred Stock index. Comparing that to HPI, we find HPI takes more risk for less return. The point of all of that is check out the benchmark any fund uses to compare itself against. Details on many indices can be found by “googling” the index name.
Also, if the fund invests based on an index and they list a recent index change, risk and return data for the fund prior to the switch should be taken cautiously, especially if the before/after indices are constructed very differently, which is not always the case; they might have preferred a different index provider.
Return data
You would think something like return data would match across sites, but there are legitimate reasons it might not, such as:
- Exact starting/ending dates. While Seeking Alpha usually goes to the day; the free version of PortfolioVisualizer uses month-end dates. Any partial month at the start is lost.
- Another is the reinvestment assumptions each vendor uses. For funds owning non-US assets, are reinvestments done Gross or Net of foreign taxes?
Over long periods, these differences should get minimized.
Data Dates
As mentioned concerning FFC data, the same data was presented with very different month-end dates. When looking at risk data, especially across sources, be sure to check the time periods used as we saw above that makes a big difference. Each investor then can decide how far back is relevant to them.
Be the first to comment