

aluxum
Written by Sam Kovacs
Introduction
As of the end of November, the S&P 500 (SPX) is currently around 4,000.
Including dividends it is down 16.3% YTD.
It seems like a miracle would be necessary for the index to finish with single digit losses.
It’s been a rough year.
Rougher than we expected.
I fully expected the stock market to go higher this year despite war & inflation, on the back of strong consumers.
The market didn’t go up. Our portfolios still did.
While everyone was skinny dipping in tech and momentum stocks in 2021, we were putting our swimsuits back on with value stocks.
We made our fair share of bad calls too. But generally we came out on top.
Our Hybrid Yield portfolio (which targets a mix of yield and dividend growth) has produced total returns of 8.9% YTD, which means it has outperformed the index by 25%.
Hybrid Portfolio vs SPY (Dividend Freedom Tribe)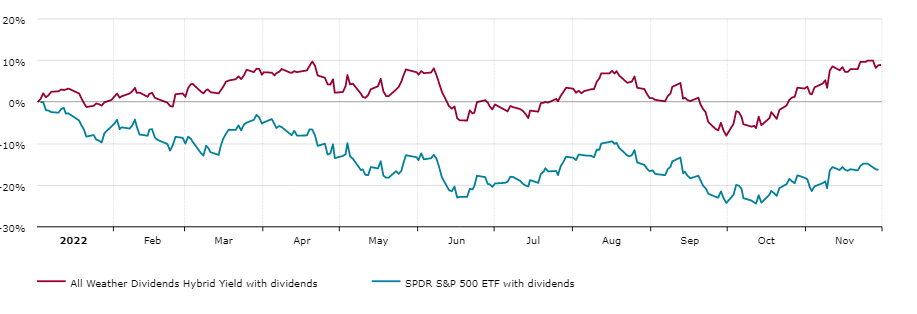
Some investors might point out that beating the market was quite easy since the S&P 500 was stacked with overvalued tech and momentum stocks which dropped like rocks in 2022.
That is true. Thankfully, our model portfolios also beat the iShares Select Dividend ETF (DVY), a fund which focuses on dividend stocks. This suggests that not only was dividend investing better than S&P 500 investing this year, but amongst dividend investors we did better.
Hybrid Portfolio vs DVY (Dividend Freedom Tribe)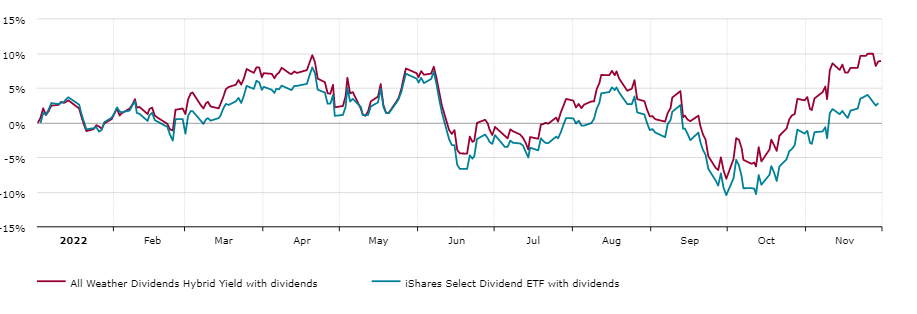
Because we’re active investors, maybe we had more motivation to pick out the right adjustments to our portfolios in late September when our portfolios went negative.
As you can see, that’s when we broke away from DVY.
In this article, I will break down the different elements that led to beating the market so far this year.
Members of the Dividend Freedom Tribe get access to 3 model portfolios (low yield, hybrid yield, high yield) which they can track in real time. We also give them all the trades at least 24 hours before we place them. Total transparency.
We will review performance for all of our 3 portfolios at the end of the year. In this article I’ll only focus on our Hybrid Yield portfolio, which is our worst performing portfolio this year.
Of course the year isn’t over yet.
And you know what they say, it’s not over until the fat lady sings.
| Year | Jan | Feb | Mar | Apr | May | Jun | Jul | Aug | Sep | Oct | Nov | Dec | Total |
|---|---|---|---|---|---|---|---|---|---|---|---|---|---|
| 2022 | +0.53% | +1.54% | +4.41% | -4.07% | +4.81% | -8.31% | +5.29% | -2.42% | -8.92% | +12.31% | +5.50% | +8.92% |
Above, I included our month-by-month total returns for the portfolio.
As you can see, what started out as a good year in Q1, quickly turned sour in Q2, and then really bad in Q3.
Thankfully, our October and November rallies have brought us back into positive territory.
Let’s break it down a little.
Sector allocation
Have you ever heard of Dickey Simpkins?
Probably not, but he is a 3x NBA champion. He was a bench player for the Chicago Bulls in 1996, 1997 and 1998. He didn’t play a single playoff minute until 1998, where in 13 games, he averaged 1.3 points per game.
Nonetheless, he has 3 championship rings, while superstars such as Patrick Ewing, Charles Barkley, Allen Iverson or Carmelo Anthony will never have one.
What is the point I’m trying to make?
If you’re on the right team, you don’t necessarily need the right players.
The first place you want to look to understand differences in performance between two portfolios, or a portfolio and an index, is by comparing sector allocation.
Certain sectors will do better than others in any environment, and if you’re more heavily weighted towards winning sectors, you’re making your life easy.
Below is the current diversification of our Hybrid Yield portfolio.
Hybrid Portfolio Diversification (Dividend Freedom Tribe)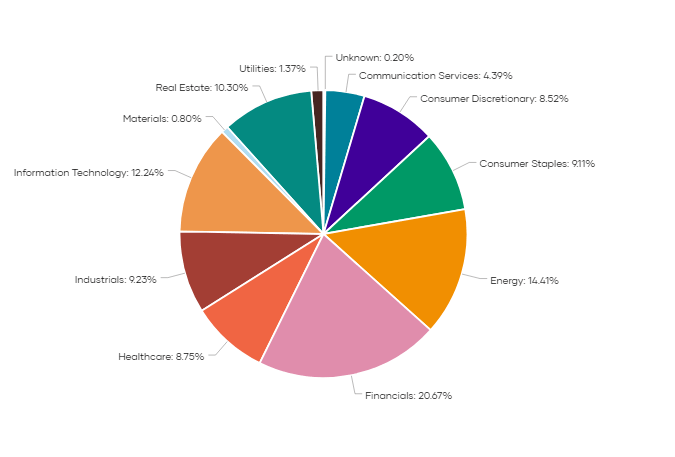
And here is the sector breakdown of the S&P 500.
S&P 500 diversification (Seeking Alpha)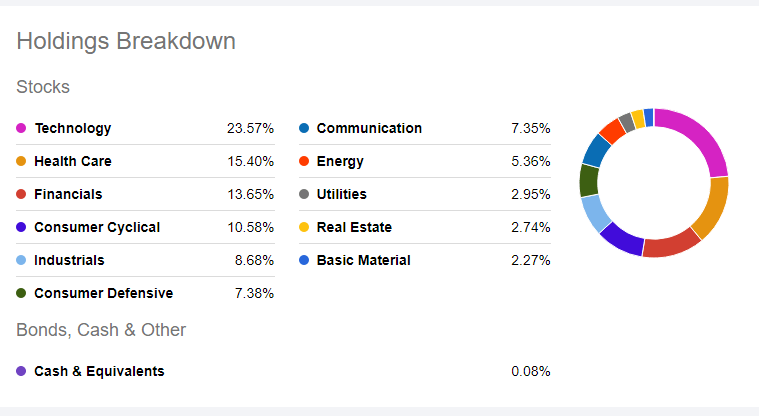
I’ll highlight the major differences in our allocations which favored our portfolio over that of the index.
First is financials, the Hybrid portfolios biggest sector, which represents 20.6% of our portfolio vs 13.6% of the index.
Hybrid Financials vs XLF (Dividend Freedom Tribe)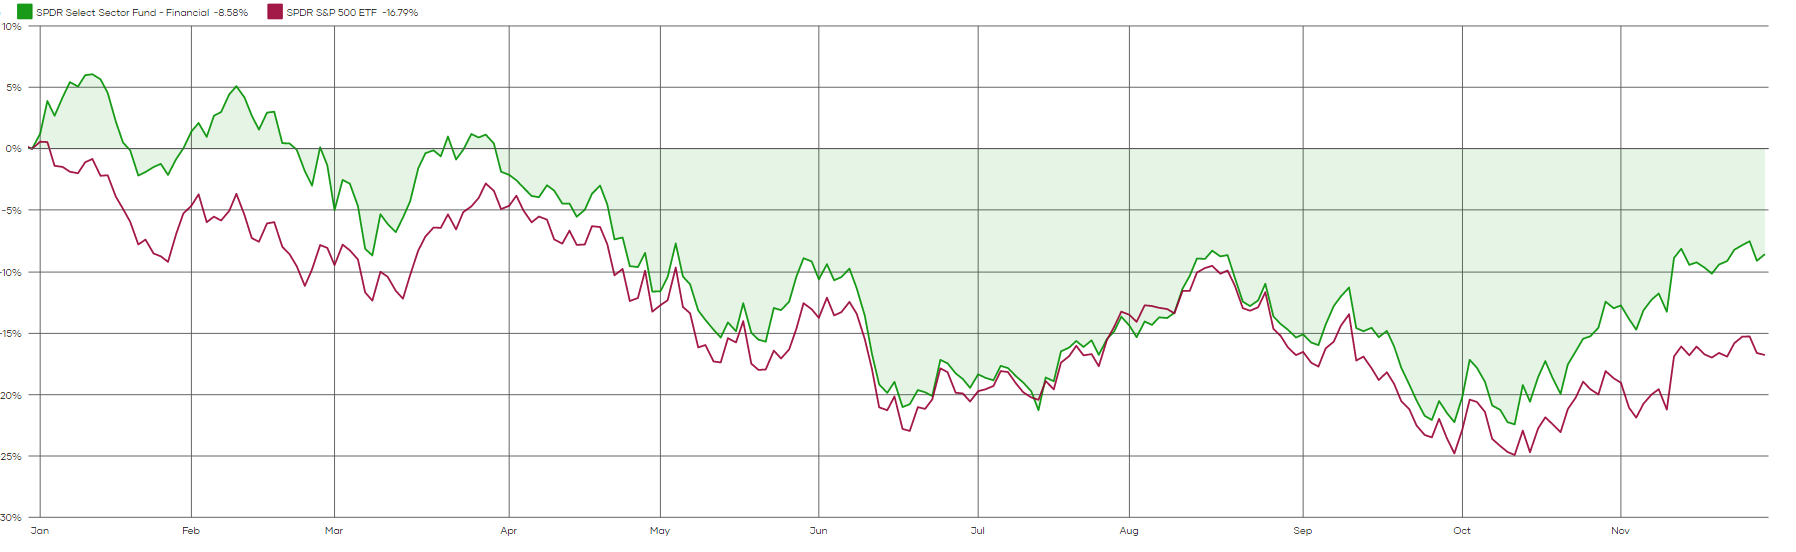
YTD, while the financials sector (XLF) is down, it is doing better than the index. All else held equal this favors our portfolio.
Next is energy, which is just 5% of the index, but 14% of our portfolio.
Hybrid Energy vs XLE (Dividend Freedom Tribe)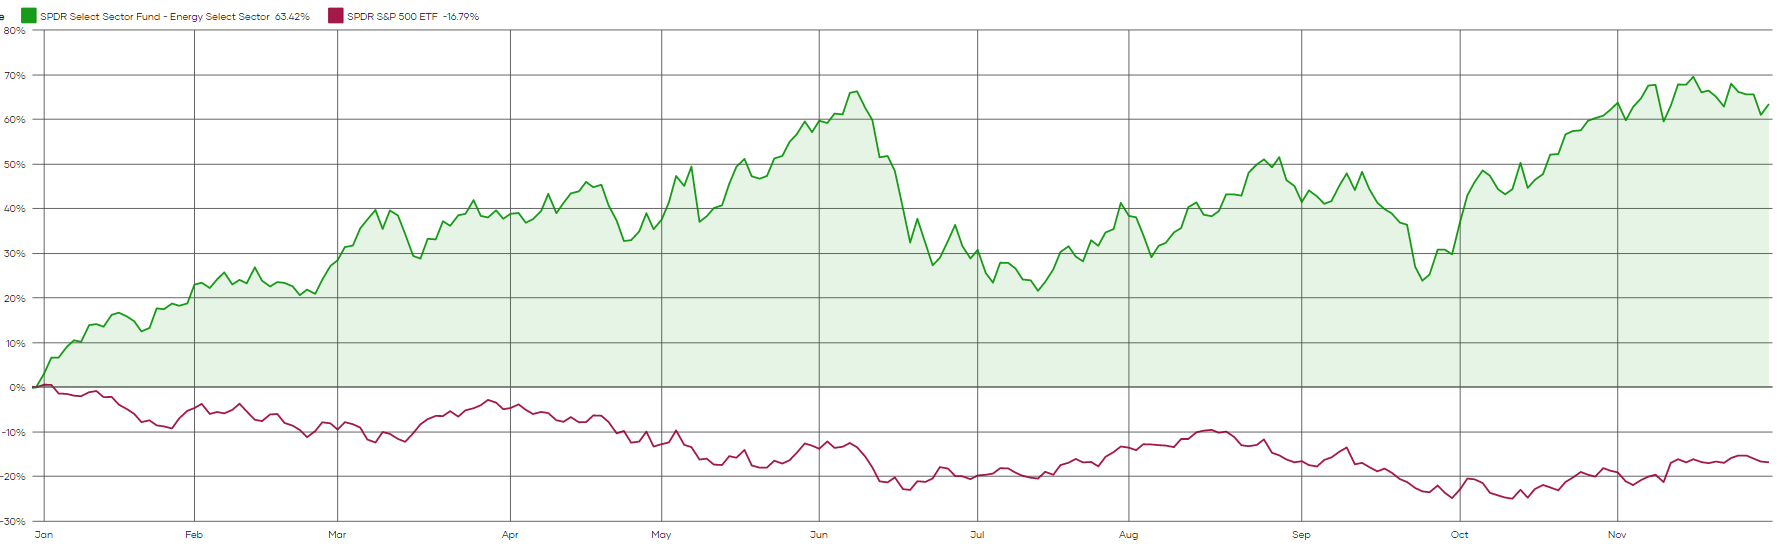
The energy sector (XLE) is up 63% YTD. This of course is a boost to our performance.
Furthermore, our portfolio has a 12% allocation to tech, while the index has 23% of its assets exposed to the sector.
Hybrid Tech vs XLK (Dividend Freedom Tribe)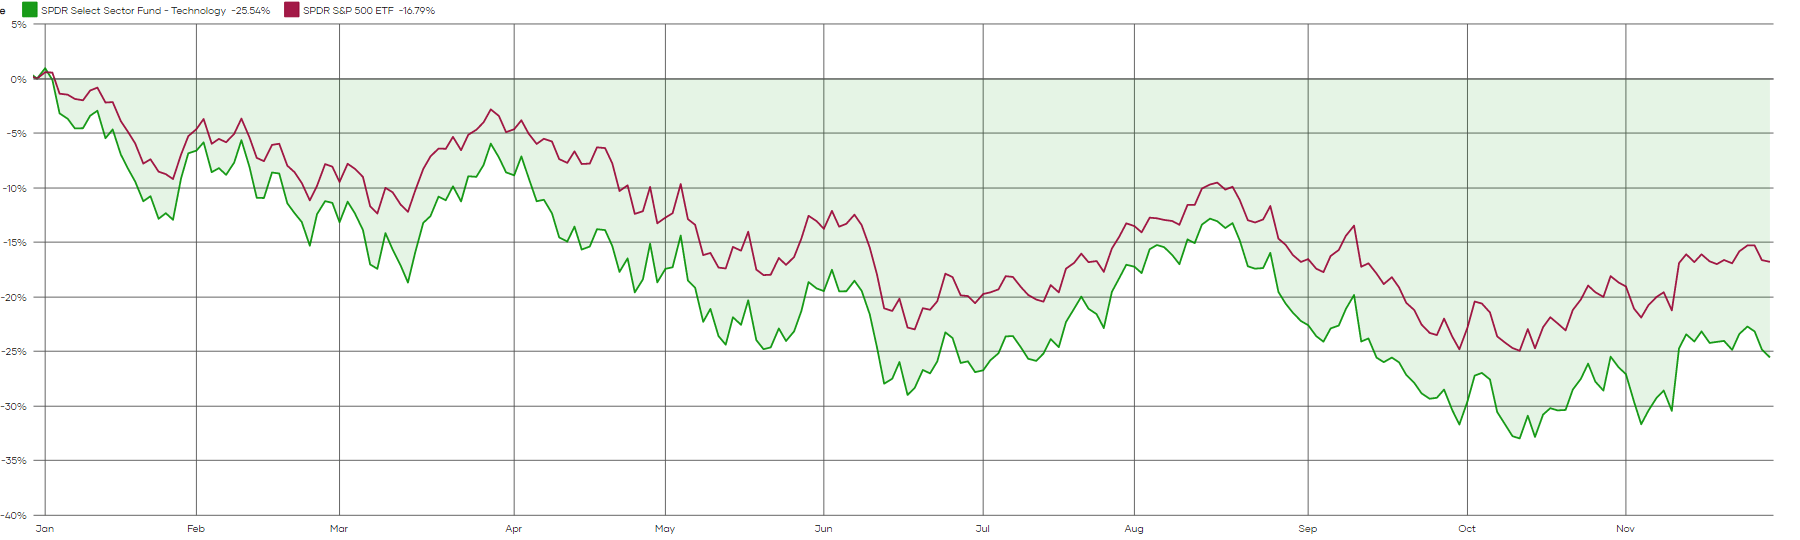
It will come to you as no surprise that the tech sector (XLK) did worse than the index this year. This also helped our portfolio.
However, we were also overexposed to Real Estate vs the index, with 10% and 2% allocations, respectively.
Hybrid RE vs XLRE (Dividend Freedom Tribe)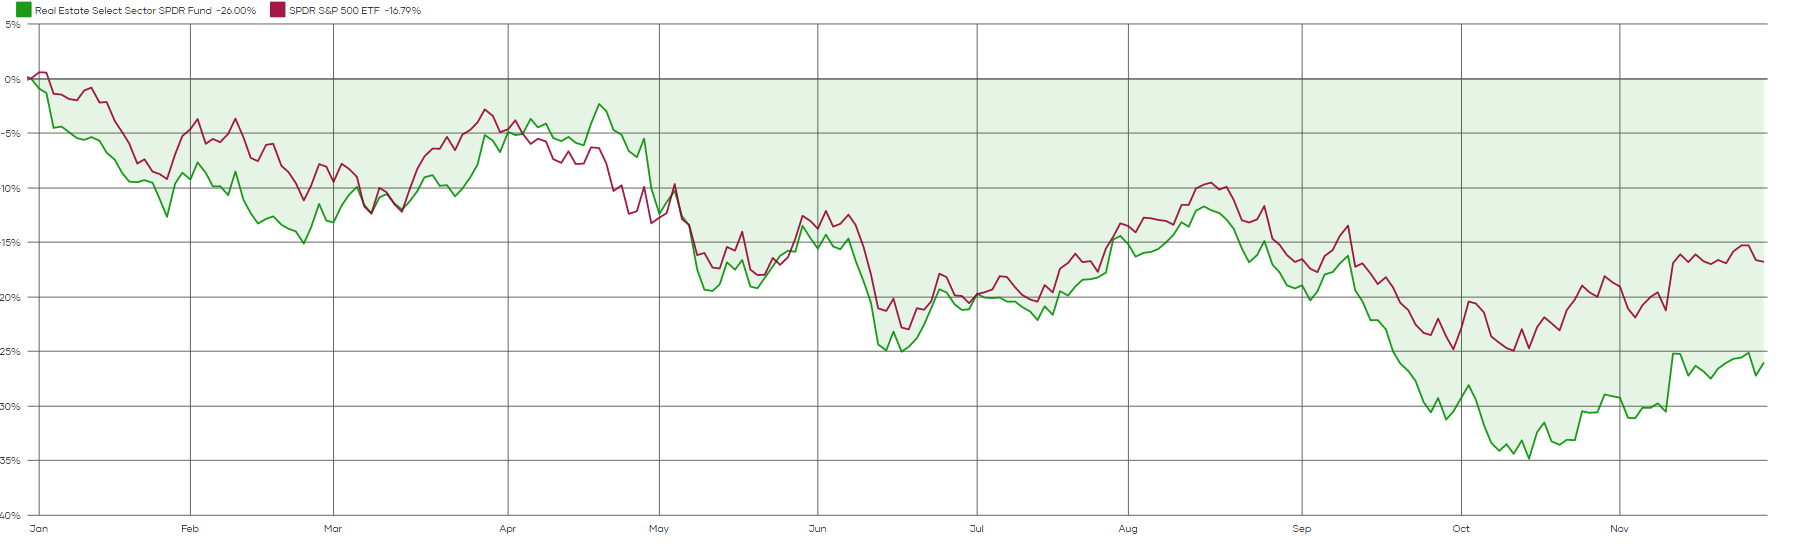
This balances out the benefit of being less exposed to tech, as real estate (XLRE) did just as bad as tech this year.
I will not look at the rest of the sectors, as they either didn’t drive performance or didn’t have big enough discrepancies with the index.
We can quite confidently say that we had superior allocation for the past year, driven primarily by our over-exposure to financials and energy.
Stock picking ability
Dickey Simpkins got 3 championship rings by being in the right team. But let’s not pretend for a minute that he had anything to do with it.
Drop Michael Jordan from the team, and the bulls were likely not a championship team. Heck, if you removed Pippen and Rodman, I’m doubtful MJ could have gotten a 3-peat by himself.
If you stacked the team full of Dickey Simpkins type players (sorry Dickey) nobody would remember the 90s Bulls.
The point I want to make here is that exposure to the right sectors doesn’t make you a good stock picker. It just makes your job easier.
So I’m going to compare our portfolios stocks in each sector to the sector funds.
| Sector | Hybrid Portfolio Performance | Sector Fund Performance |
| Utilities | 16.5% | 0.43% |
| Real Estate | -4% | -23% |
| Healthcare | 26.3% | -1.59% |
| Financials | -3.89% | -8.9% |
| Industrials | 14% | -4% |
| Information Technology | -3% | -25.7% |
| Consumer Discretionary | -4% | -32% |
| Communications Services | -1% | -36% |
| Consumer Staples | 3% | 0% |
| Materials | 22% | -8% |
| Energy | 46.5% | 62% |
So it is clear here that picking the right players for your team also explains our outperformance.
Sometimes, a handful of stocks drive the returns of the sector.
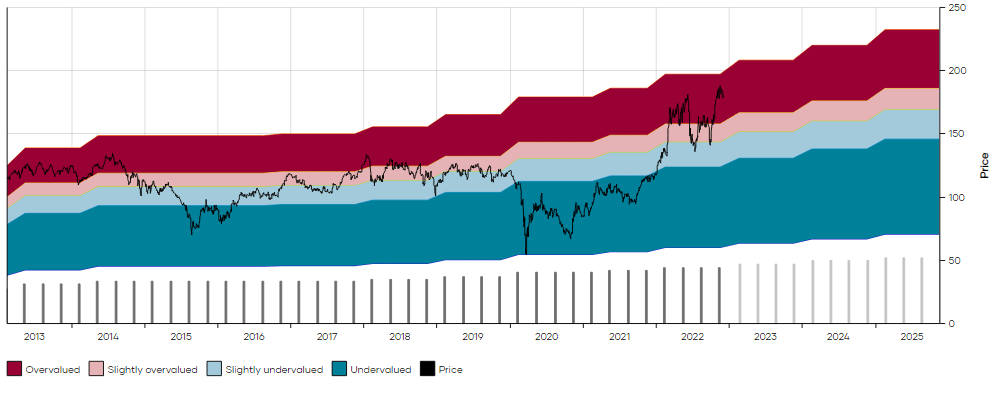
In Materials for instance, it was Air Products and Chemicals (APD) which went from being extremely undervalued to entering overvalued territory in the past few weeks, as you can see in the MAD Chart below.
(Click here to learn more about MAD Charts)
APD MAD Chart (Dividend Freedom Tribe)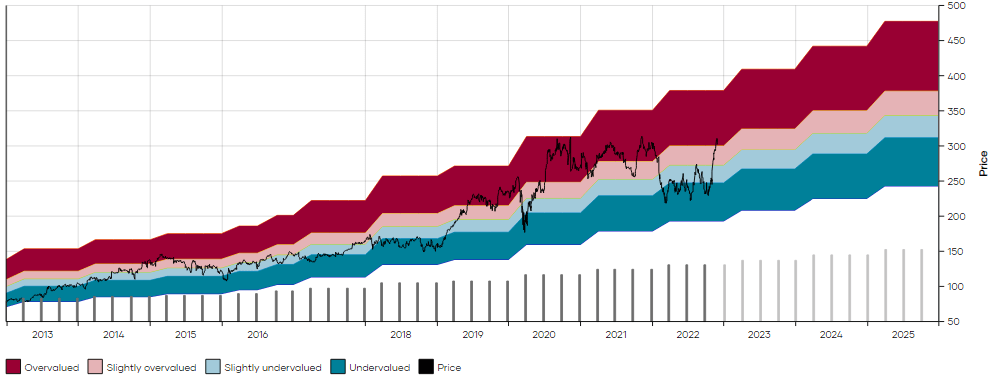
Other times, all of our picks performed in tandem to beat the sector.
In Healthcare, for instance, which was our second-best performing sector, all of our picks were up.
Merck (MRK) shot up and went from undervalued to overvalued this year.
MRK MAD Chart (Dividend Freedom Tribe)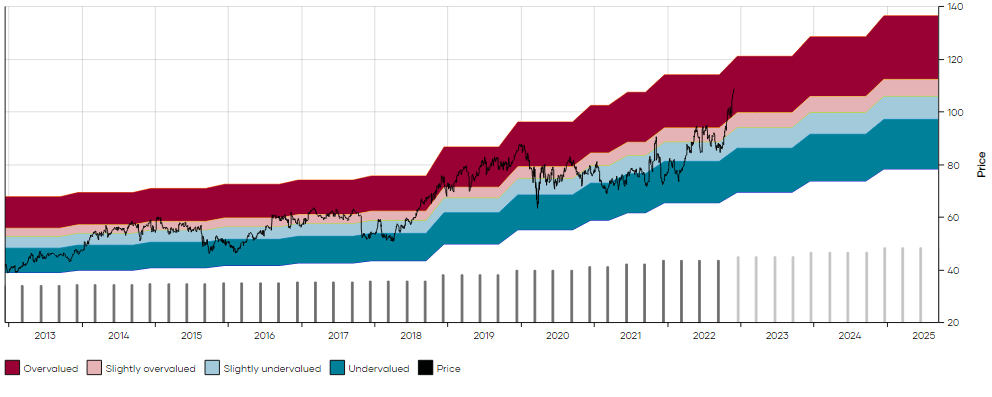
So did Cigna (CI).
Bristol Myers (BMY) went from $60 to $80. In December ’21 we wrote an article highlighting 10 ultimate dividend stocks for 2022. BMY was one of those stocks.
BMY MAD Chart (Dividend Freedom Tribe)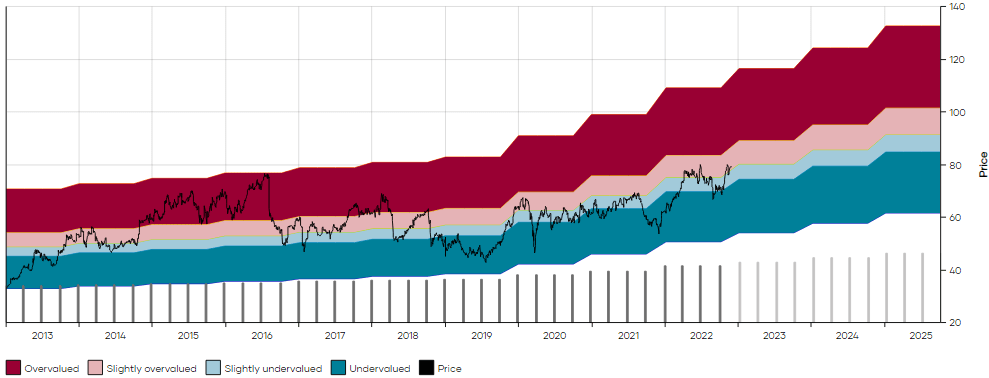
Conveniently, I said: “I’d expect BMY to trade within $75-$80 per share within the next year.”
Amgen (AMGN) and AbbVie (ABBV) also played their role. Most of these stocks are no longer buys but are solid holds.
The only sector where our picks underperformed the sector fund was Energy.
Our picks in the sector delivered total returns of 46.5% vs 62% for the sector fund.
Hybrid Energy vs XLE (Dividend Freedom Tribe)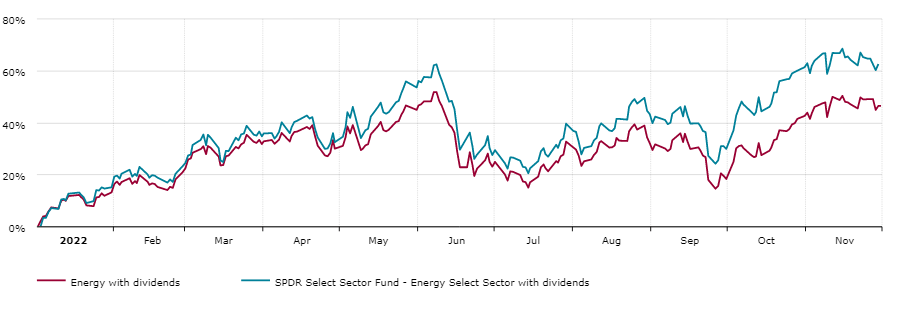
When you look in more detail, it becomes clear that from the largest energy positions in our portfolio, which I’ll list below, only Exxon (XOM) beat the sector index YTD.
Energy Stocks vs XLE (Dividend Freedom Tribe)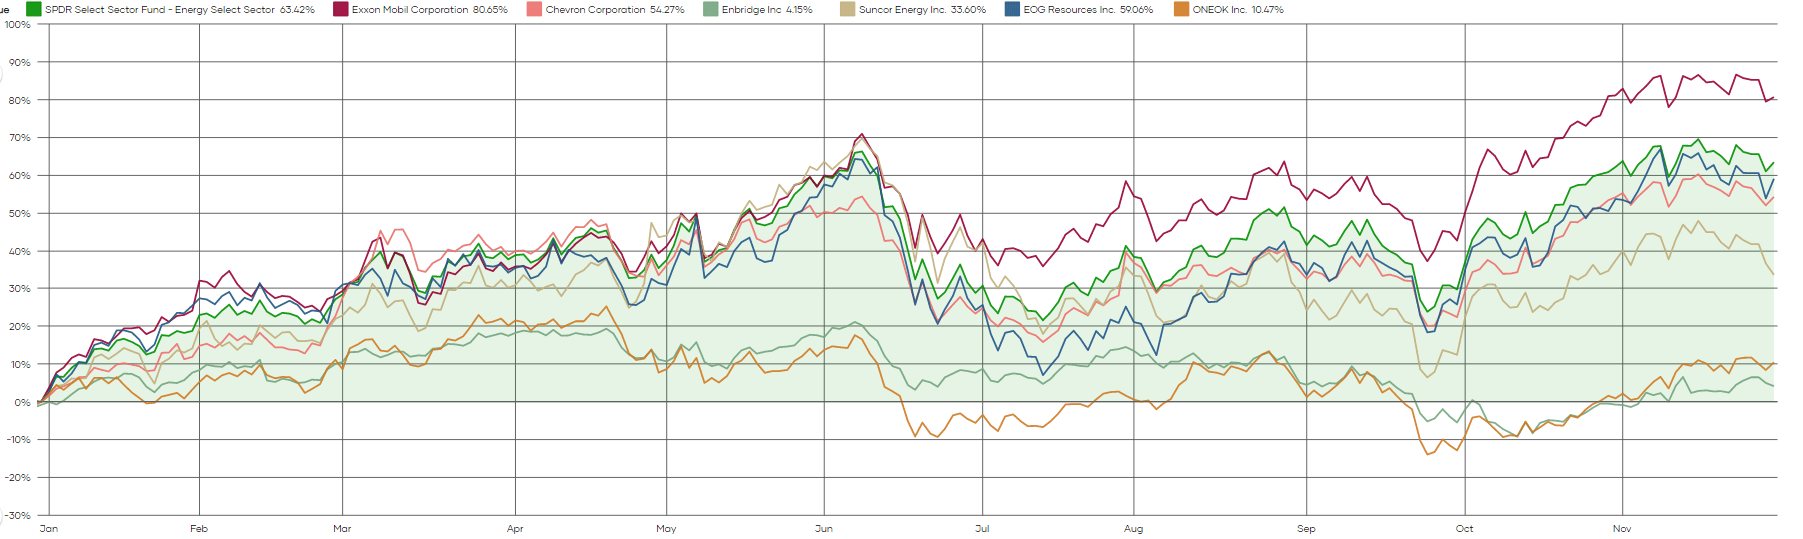
The stocks listed above, which are a significant part of our energy allocation include:
Today, only Suncor and Enbridge remain buys, as you can see in their MAD Charts below.
ENB MAD Chart (Dividend Freedom Tribe) SU MAD Chart (Dividend Freedom Tribe)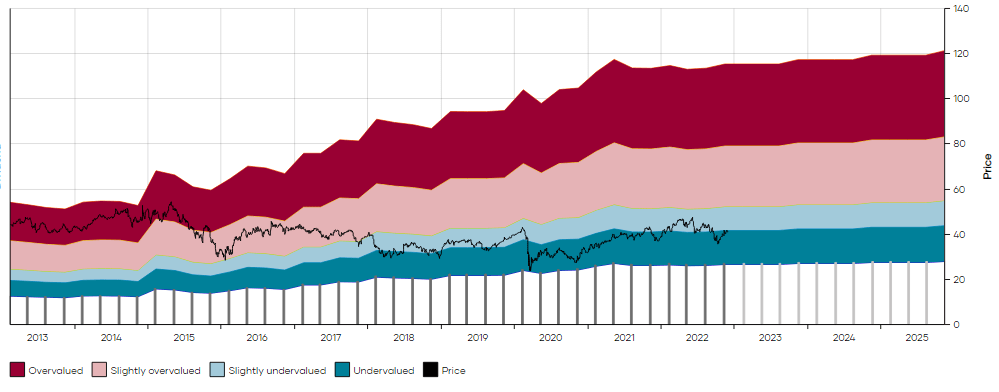
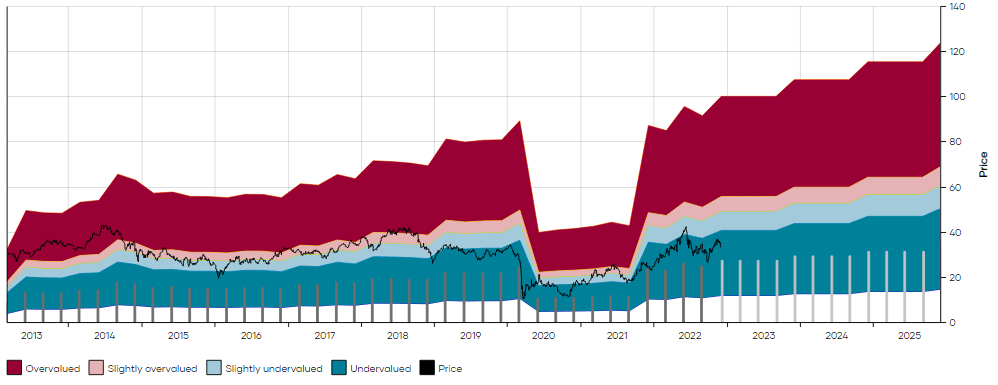
Contrast these to Chevron and Exxon’s MAD Charts, which now clearly show overvaluation.
XOM MAD Chart (Dividend Freedom Tribe) CVX MAD Chart (Dividend Freedom Tribe)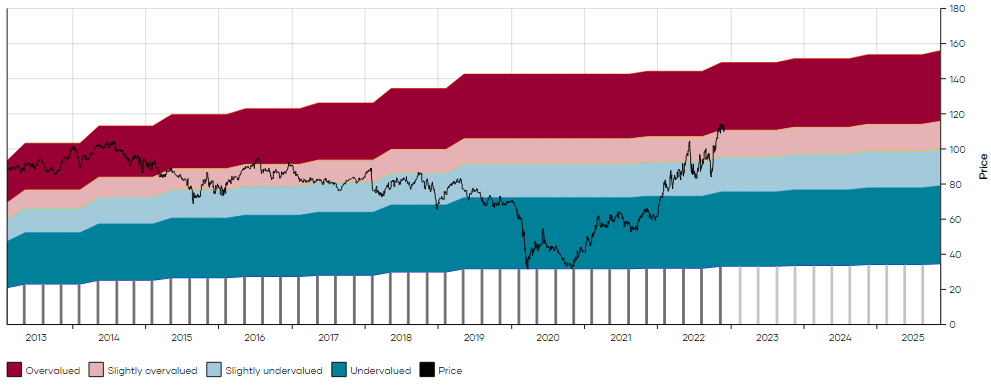
As you can see being exposed to the right names is extremely important to beating the market.
Conclusions
The two biggest contributors to beating the market are putting more of your assets into the right sectors and picking better stocks within those sectors.
The final point is timing, that is buying low and selling high. That is as much an art as a science, and we’ve written about it a lot in the past and continue to help members of the Dividend Freedom Tribe make such decisions every week.
We didn’t beat the market because we’re smart, but because we’re diligent and disciplined. We also have an amazing community of 700+ members who help us uncover great trades.
For instance Cigna (CI) which we made a total return of 44% in a 12-month holding period (we’ve exited the position entirely) was not our idea. Our members suggested we look at the stock, and we realized it was a good bet.
Each week our members vote for the stocks they want us to cover, and we analyze them with our disciplined methodology.
We have a well-rounded team to approach the markets from all angles and will continue to do our best to deliver superior results to our investors.
Since its inception in May 2020, the Hybrid portfolio has returned a total of 87%, and is beating the S&P 500 by 41% as this year’s gains have amplified prior returns while the S&P 500 has dwindled.
Hybrid vs SPY since inception (Dividend Freedom Tribe)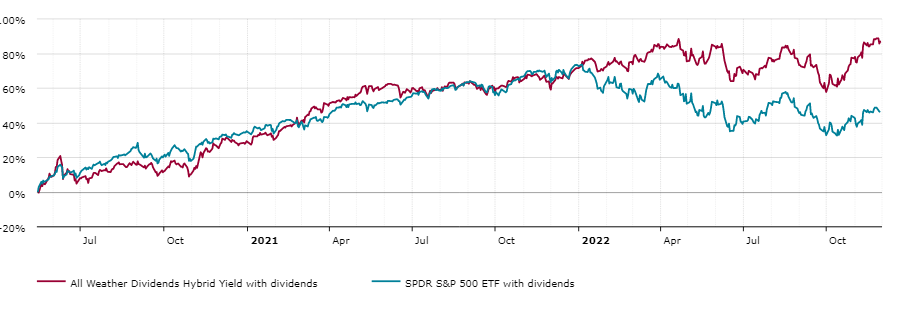
We’re not sitting back and relaxing though. We’re actively figuring out “what’s next”.
Be the first to comment