

Investment thesis
Today is not a time when Market-Makers are unduly fearful. Nor are they determined to throw fuel on the fire. The point of the article is to show that they can tell the differences, and individual investors can learn how their market expectations are changing. This is a portfolio strategy article, not a “You gotta buy XYZ now while it’s cheap” article.
We can’t reliably “time the market”, but this awareness can substantially add to your portfolio’s Alpha as you think about the value appraisals of many of the portfolio’s holdings.
Smart Money gets paid by putting capital at risk
That’s what is required for Market-Makers to do their job. They learn what risk protection costs, or they quickly perish. If they underpay, the risk eats them; if they overpay, the competition eats them.
So, we watch how much protection they buy and in what forms, day after day, for thousands of heavily-trafficked stocks and ETFs. We learn at what share prices some protection must be afforded, up to extremes – in both directions – where the “needed protection benefit is not likely enough to be worth its cost”.
Those share price extremes are a forecast of what may be coming, in a time horizon of only a few months, the legal life of the derivatives contracts providing the price change protection. But the extremes are forecasts of price change potentials often larger than the annual multi-year trends offered as investment capital traps.
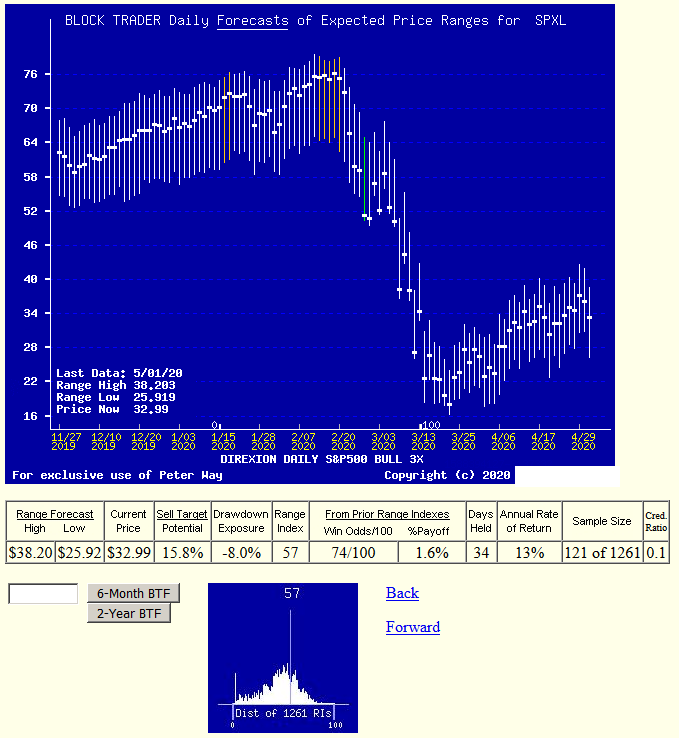
Figure 1 shows an ETF particularly well structured to illustrate how such price range forecasts may travel day by day across the recent past half-year’s time. The Direxion Daily S&P500 3x Shares (SPXL) holds representations of the market index, engineered to rise at a rate 3 times the rate the 500-stock ETF (SPY) changes in any (every) day.
Figure 1
Source: Author
The vertical lines in Figure 1 are MM daily forecasts of expected prices yet to come, not history of past prices. The heavy dot accompanying each forecast is the day’s closing market quote when the forecast was made. It splits each range into upside and downside price change prospects.
The balance between upside and downside is an important measure. We label it the Range Index [RI] with a value of the percentage of the whole forecast range which lies below the current market quote.
SPXL’s current RI of 57 has the market quote quite centrally located in the range with 43% of the forecast price span to the upside. The small picture at the bottom of Figure 1 shows the frequency of SPXL’s RI in the 1,261 market days of the past 5 years to date. That frequency distribution is reasonably but not perfectly symmetrical, with a center near the 50 point.
Because of SPXL’s market-average holdings, its well-balanced price change experiences, and its engineered triple-sensitivity to price changes, it becomes a useful sensor of where equity market valuations, in the aggregate, may be at this point in time.
Figure 2 is a table showing how SPXL’s price has changed over time (in columns) subsequent to its RI forecasts (rows) expressed as ratios of upside-to-downside price prospects. The central blue row is the even balance between upside and downside prospects and its #BUYS column counts the number of daily forecasts (about 4 ½ years) 1,133, contained in the table.
Figure 2
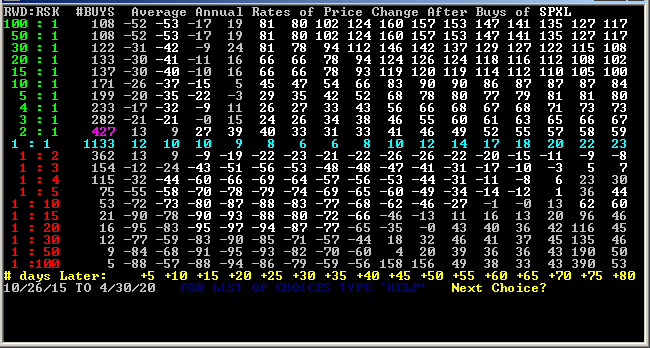
The next column to the right on that blue row tells what the average of the total 1,133 forecasts produced in the first 5 days of each forecast’s market life in terms of an annual rate of change from the price at the day’s forecast day. For all 1,133 forecasts, this average was a CAGR of +12%.
The next columns to the right measure price changes of progressively longer time periods by another 5 days, out to the 16-week limit (of market days). At that time extreme, there was an average price change at a rate of +23% CAGR gains. In earlier, shorter time periods of 20 to 40 days that average sagged a bit before recovering to its later accomplishments of above 20%.
The time dimension of the columns is the easier one to explain, so it came first. The rows dimension is less neatly discussed because it deals with how many forecasts were present at the different upside-to-downside prospects relationships of each RWD:RSK row-header. The description complexity is compounded because RI differences are not as easy to grasp as weeks of 5 market days.
A count of 108 forecasts in the 100:1 row at Figure 2’s top, by presentation design contained all RI forecasts with a RI of 1, zero, or minus. A negative RI occurs if the market quote on the forecast day is lower in price than the lowest price in the forecast range. This row contains the 108 forecasts of “screaming buys” for SPXL.
They may have gotten to that extreme by a series of progressively lower prices for a short period, which is suggested by the negative price changes in the coming 5, 10, and 15 day columns of the 100:1 row. But the subsequent time periods rapidly turn very positive with very high triple-digit CAGR returns.
The second row captioned 50:1 would contain all forecasts with RIs of (only) 2, (98/2=49), plus (by design again), all of the forecasts from the row above. Similarly, the third row of 30:1 could contain only RIs of 3, plus the row above. The 50:1 row had no forecasts with RIs of 2 so its #BUYS remained at 108, while there were 14 forecasts with RIs of 3 so the count increases to 122 and the average CAGRs change.
The 20:1 row might have RIs of 4 and 5, so the cumulative count of forecasts increases by 11 to 133. The #BUYS column cumulates from both the top downward and the bottom upwards the experiences from the more extremes until they meet at the central blue totals and averages row of all forecasts.
This manner of row cumulation has a parallel of sorts with many cumulative frequency distribution presentations having increasing observations as the distribution’s mean is approached.
The most impressive part of this Figure 2 display is its dramatic shift from strong positive price changes in forecasts above the 1:1 row to strong negative price changes in its lower half below the blue totals and averages row. It confirms the MM’s abilities to anticipate price changes within these kinds of time horizons.
Not all stocks and ETFs display this ability so neatly, and many securities evidence the MMs’ abilities asymmetrically between upside and downside forecasts, often at tipping points not right at a RI of 50 where the up to down ratio is 1:1.
In fact, on a stock by stock basis, price forecasting depends strongly upon knowing what the particular security’s RI appraisal history by MMs has been.
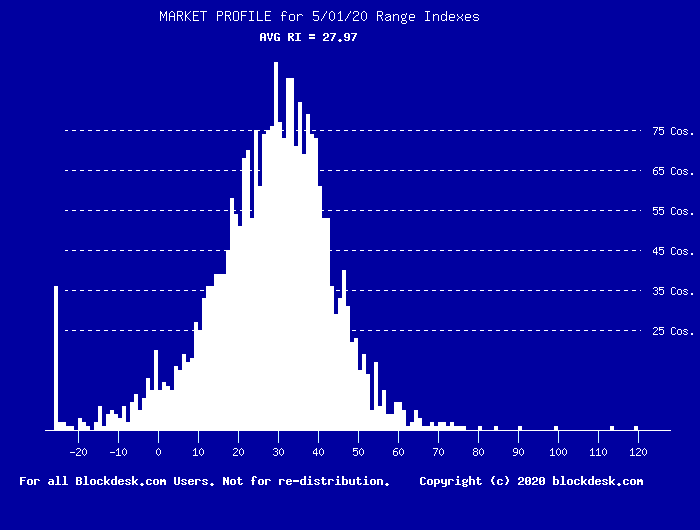
But on an overall market basis, the level of RIs for the MM forecast population (typically upwards of 2,500 issues) does have information about institutional investor attitudes toward coming price changes. To visualize this, we daily assemble the population’s RI values into a Market Profile in the same manner as the small picture of Figure 1’s RI experiences solely with SPXL.
Here is how the Market Profile looks now, on over 2,600 MM forecast subjects, with a current SPY price of $282.83 and an index price of the S&P 500 of 2,830.71.
Figure 3
Source: Author, with permission
Except for the spike at left of extreme MM forecasts with RIs < -25, the profile is quite symmetrical, averaging RIs of 28. The norm for these profile averages often ranges between RIs of roughly 20 on the low side, and 40 on the high.
Why not centered around 50, like SPXL? Would you be a buyer of, say, TSLA if market pros thought there was as much downside price change in prospect by August as potential gain? Risk as big as reward?
Normal individual investors don’t play those propositions.
But the SPXL market seems dominated by pros at “proprietary trade” desks of MM firms and other professional market trading organizations. Such players are adroit arbitrage appraisers, constantly attentive at every instant markets are open. They often are fed by the same kind of world-wide 24×7 information gathering and evaluating systems used by MMs serving institutional clients who place volume block trade orders and may be the “other side of the (protection) hedging trade” sought to fill big stock trade orders.
Such behind the scenes participants keep the markets competitive, rational and fair – usually.
But on rare occasions, the market profile suggests other opportunities, as it did on March 23rd of this year: See Figure 4.
Figure 4
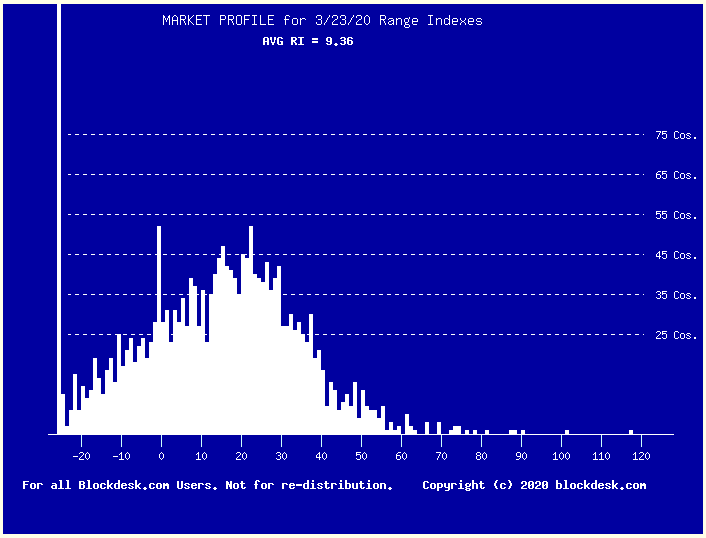 Source: Author, with permission.
That out of the picture spike at left is not a frame of the picture, it is part of the compilation of forecasts. Don’t just back up the truck, this is time to pawn the silverware! (Not everyone will, or should.) And today is not March 23rd.
Markets are not always perfect or completely rational. Succeeding days subsequently (quickly) returned to Figure 3 dimensions.
Our family has an honored slogan: “The time to take a donut is when the tray is passed – the tray may well be empty on its way back.”
Conclusion
Current equity markets appear not to be even modestly over-fully priced, despite recent apparently high(er than before) numbers.
The pros who make competitive markets what they are, honest and fair, do have insights which can produce profits within reasonable limits of probability. All participants need monitoring, since that reassurance is part of the picture and maintains the uncertainty that keeps the processes functional. Most all investors attempt to improve their forecasts.
Above-average investment profit growth (Alphas) can (should) be earned by utilizing as much reliable information as can legally be obtained. There often is more than is anticipated. Keep on enquiring.
Disclosure: I/we have no positions in any stocks mentioned, and no plans to initiate any positions within the next 72 hours. I wrote this article myself, and it expresses my own opinions. I am not receiving compensation for it (other than from Seeking Alpha). I have no business relationship with any company whose stock is mentioned in this article.
Additional disclosure: Disclaimer: Peter Way and generations of the Way Family are long-term providers of perspective information, earlier helping professional investors and now individual investors, discriminate between wealth-building opportunities in individual stocks and ETFs. We do not manage money for others outside of the family but do provide pro bono consulting for a limited number of not-for-profit organizations.
We firmly believe investors need to maintain skin in their game by actively initiating commitment choices of capital and time investments in their personal portfolios. So, our information presents for D-I-Y investor guidance what the arguably best-informed professional investors are thinking. Their insights, revealed through their own self-protective hedging actions, tell what they believe is most likely to happen to the prices of specific issues in coming weeks and months. Evidences of how such prior forecasts have worked out are routinely provided in the SA blog of my name.
Be the first to comment