

Debalina Ghosh
Investment Thesis
One of the key factors for the success of an investment portfolio is its allocation. The composition of your investment portfolio is crucial for the level of risk you take and decisive for the Total Return you achieve over the long term.
In this article, I will show you how you could allocate $5,000 among 5 ETFs/companies. Each of the picks provide you with Dividend Income and Dividend Growth and at the same time, you can aspire for an attractive Total Return and a reduced risk level of your portfolio.
Before I introduce you to the ETFs and companies that are part of this portfolio, I would like to remind you of the pillars of my investment approach: when building an investment portfolio, my objective is to reach a balance of the following factors:
- Relatively high Average Dividend Yield of the companies
- Relatively high Average Dividend Growth Rate
- Attractiveness in terms of risk and reward
- Companies with strong competitive advantages that provide an economic moat
- Companies with strong financials
- Companies with a relatively high brand value
- Consumer familiarity with the products of these companies
- Attractive Valuation of the companies
- Aiming to achieve a relatively high Yield on Cost when having a long investment horizon
- Risk diversification across sectors and industries
These are the selected ETFs and companies that are part of this portfolio:
- Schwab Strategic Trust – Schwab U.S. Dividend Equity ETF (NYSEARCA:SCHD)
- iShares Select Dividend ETF (NASDAQ:DVY)
- Johnson & Johnson (NYSE:JNJ)
- Visa (NYSE:V)
- Apple (NASDAQ:AAPL)
When aiming to invest $5,000 among 5 Dividend Income and Dividend Growth companies/ETFs, I suggest investing the largest proportion of the $5,000 in ETFs. The reason being, if we were to allocate the amount equally between all 5 picks, we would invest $1,000 in each, which would imply that each investment would have a relatively large proportion (20%) of the overall portfolio.
In my opinion, such an allocation would imply a high level of risk, since the Total Return of your overall investment portfolio would depend to a large degree on the performance of each of the 5 picks you have selected. In the case that only one out of the 5 performs badly over the long term, the Total Return of your investment portfolio would decrease significantly.
For these reasons, when aiming to allocate $5,000 between just 5 dividend income and dividend growth stocks, I would recommend that you invest the largest proportion in ETFs.
In the following, I will be more specific about the allocation: I would suggest to invest 40% in SCHD and 40% in DVY. The remaining 20% could then be distributed between 3 individual companies. In this way, the selected companies would each make up about 6.67% of the overall investment portfolio (when assuming that the remaining 20% of the overall portfolio was distributed equally among the 3 companies). In this way, you achieve a much broader risk diversification and manage to significantly reduce your level of risk when compared to a distribution of 20% for each of the individual picks.
At the same time, by implementing the suggested allocation, you achieve both a higher Average Dividend Yield and Weighted Average Dividend Growth Rate than when compared to an equal distribution among the 5 picks. The portfolio I have built for you, when implementing the suggested allocation, achieves a Weighted Average Dividend Yield [TTM] of 2.94% and a Weighted Average Dividend Growth Rate of 10.42%. If we were to allocate the $5,000 equally, you would reach an Average Dividend Yield [TTM] of only 2.17% while taking on much more risk due to the lower diversification.
Moreover, the investment portfolio I have built for you in this article, reaches a significantly higher Dividend Yield [TTM] (2.94%) than the Vanguard S&P 500 ETF (NYSEARCA:VOO), which provides shareholders with a Dividend Yield [TTM] of just 1.57%. It also provide you with a higher Dividend Yield [TTM] than the IVV iShares Core S&P 500 ETF (NYSEARCA:IVV), which offers a Dividend Yield [TTM] of only 1.54%.
At the same time, the presented portfolio offers you a higher Weighted Average Dividend Growth Rate over the past 5 Years (10.42%) when compared to the Vanguard S&P 500 ETF (Average Dividend Growth Rate of 6.37%) or the IVV iShares Core S&P 500 ETF (6.32%).
Overview of the selected ETFs and Companies
|
Company |
Sector |
Industry |
Dividend Yield [TTM] |
5 Year Average Dividend Growth |
Amount |
Proportion |
|
Apple |
Information Technology |
Technology Hardware, Storage and Peripherals |
0.62% |
8.15% |
$333.33 |
6.67% |
|
DVY iShares Select Dividend ETF |
ETF |
ETF |
3.31% |
6.98% |
$2,000.00 |
40% |
|
Johnson & Johnson |
Health Care |
Pharmaceuticals |
2.78% |
5.95% |
$333.33 |
6.67% |
|
Schwab Strategic Trust – Schwab U.S. Dividend Equity ETF |
ETF |
ETF |
3.35% |
13.74% |
$2,000.00 |
40% |
|
Visa |
Information Technology |
Data Processing and Outsourced Services |
0.78% |
17.95% |
$333.33 |
6.67% |
|
Weighted Average |
2.94% |
10.42% |
100.00% |
Source: The Author, data from Seeking Alpha
SCHD – Schwab Strategic Trust – Schwab U.S. Dividend Equity ETF
When looking for an ETF for this portfolio, I particularly consider those that provide you with an attractive Dividend Yield to be appealing, while at the same time having a strong chance of providing you with Dividend Growth in the years ahead. The combination of both Dividend Yield and Dividend Growth ensures that you can receive an attractive Dividend in the present while increasing this Dividend at attractive rates from year to year.
SCHD is one of these picks that provides you with both an appealing Dividend Yield [TTM] (3.35%) and Dividend Growth (its 5 Year Average Dividend Growth Rate is 13.74%). If I were to start to build an investment portfolio from zero, SCHD would probably be the first acquisition that I would make due to its enormously attractive combination of Dividend Yield and Dividend Growth in addition to the broad diversification it provides you with.
According to the Seeking Alpha Quant Rating, SCHD is currently rated as a buy, which underlines my own buy rating for this ETF.
Source: Seeking Alpha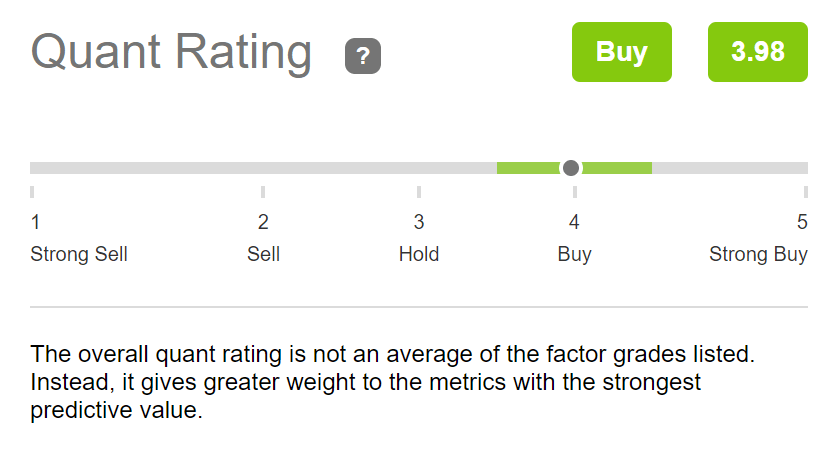
When looking at the Seeking Alpha Momentum Grades, we can see that SCHD has clearly outperformed the Median of all ETFs lately: while SCHD has shown a Total Return of 78.62% over the past 5 years, the Total Return of the Median of all ETFs has been 21.58% across the same time period. SCHD’s Performance has been 264.25% above the Median of all ETFs during this time, which strengthens my belief that it should be part of this portfolio.
When taking into consideration the ETFs’ Total Return over the past 6 month period, we can see that its performance of 5.11% is 231.95% above the performance of the Median of all ETFs over the same time period (1.54%). This provides additional evidence of its attractiveness and reinforces my opinion that it could be able to outperform the Median of all ETFs in the years ahead.
Source: Seeking Alpha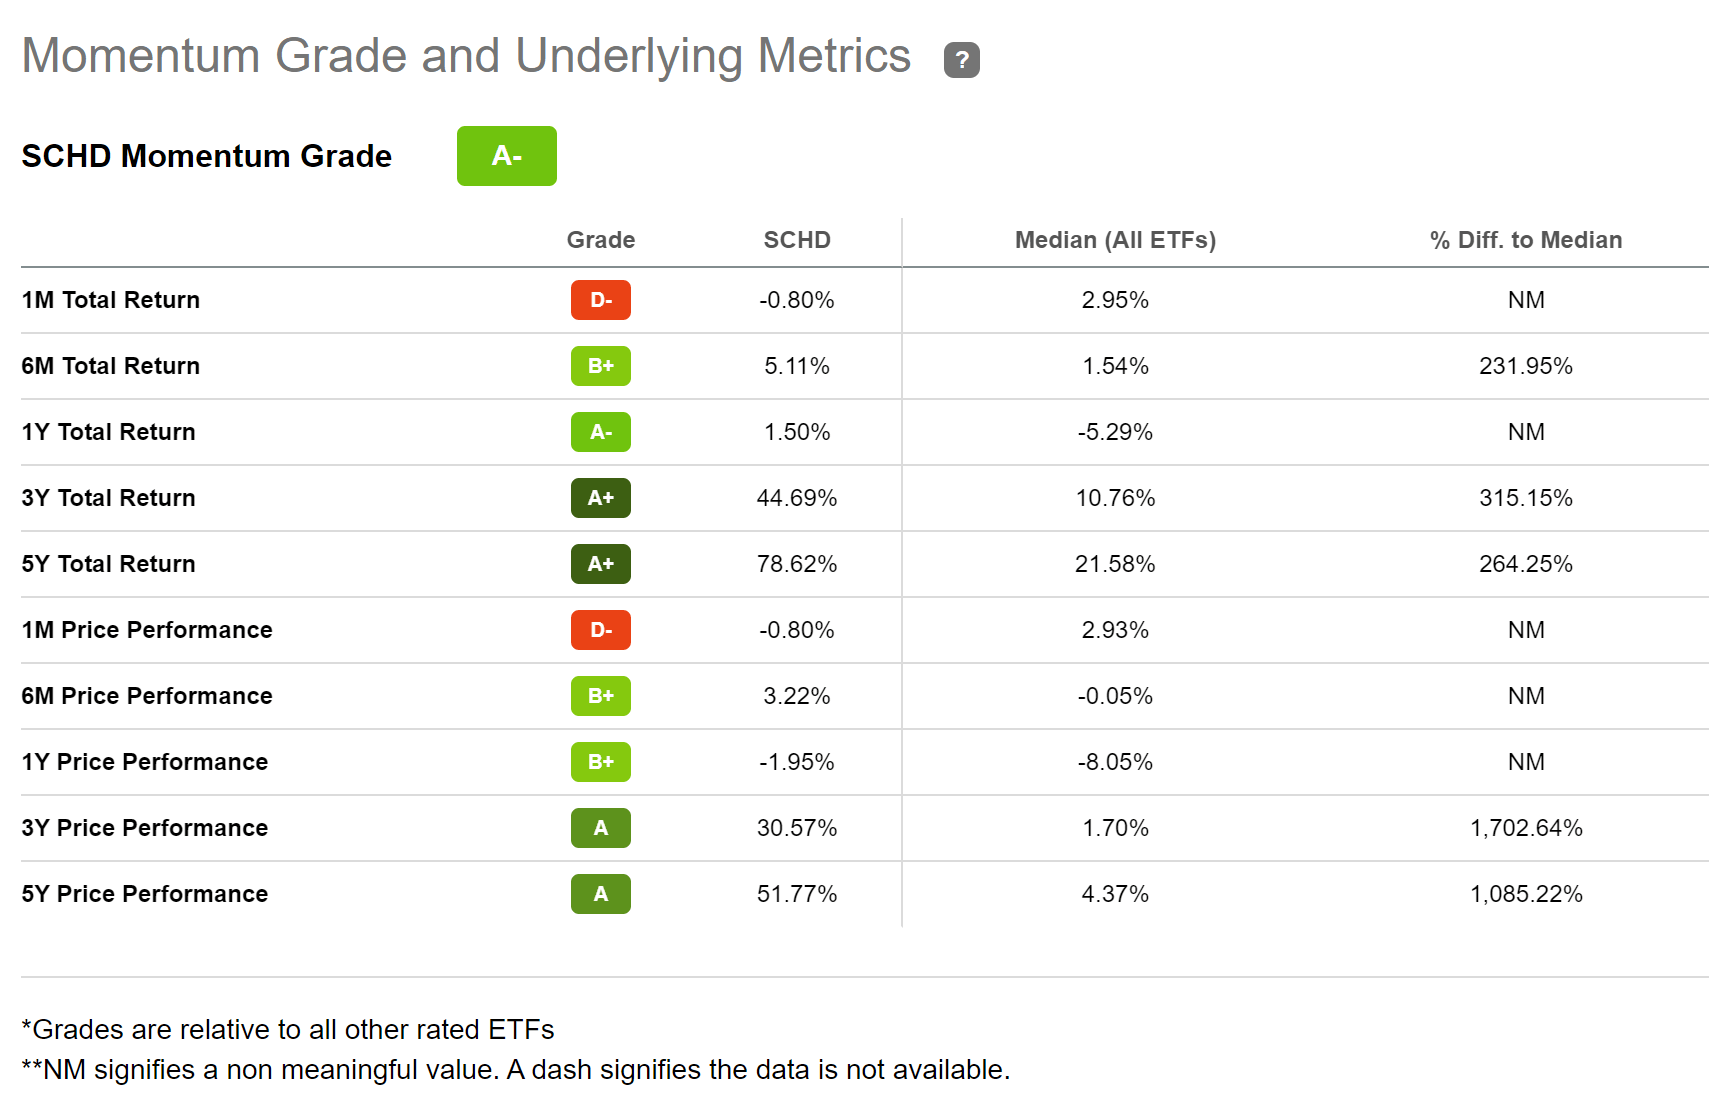
DVY iShares Select Dividend ETF
Another ETF that I consider to be particularly appealing for investors due to its Dividend Yield on the one hand, and its Dividend Growth Rate on the other, is DVY. The ETF currently has a Dividend Yield [TTM] of 3.31% and its Dividend Growth Rate 5Y [CAGR] is 6.98%.
When comparing the performance of this ETF with the performance of the S&P 500 over the past 12 months, we can see that DVY has outperformed the S&P 500: while it has shown a Total Return of 3.21%, the performance of the S&P 500 has been -7.02%. Due to the composition of this ETF, I believe that it could continue to outperform its peer group in the coming years.
Source: Seeking Alpha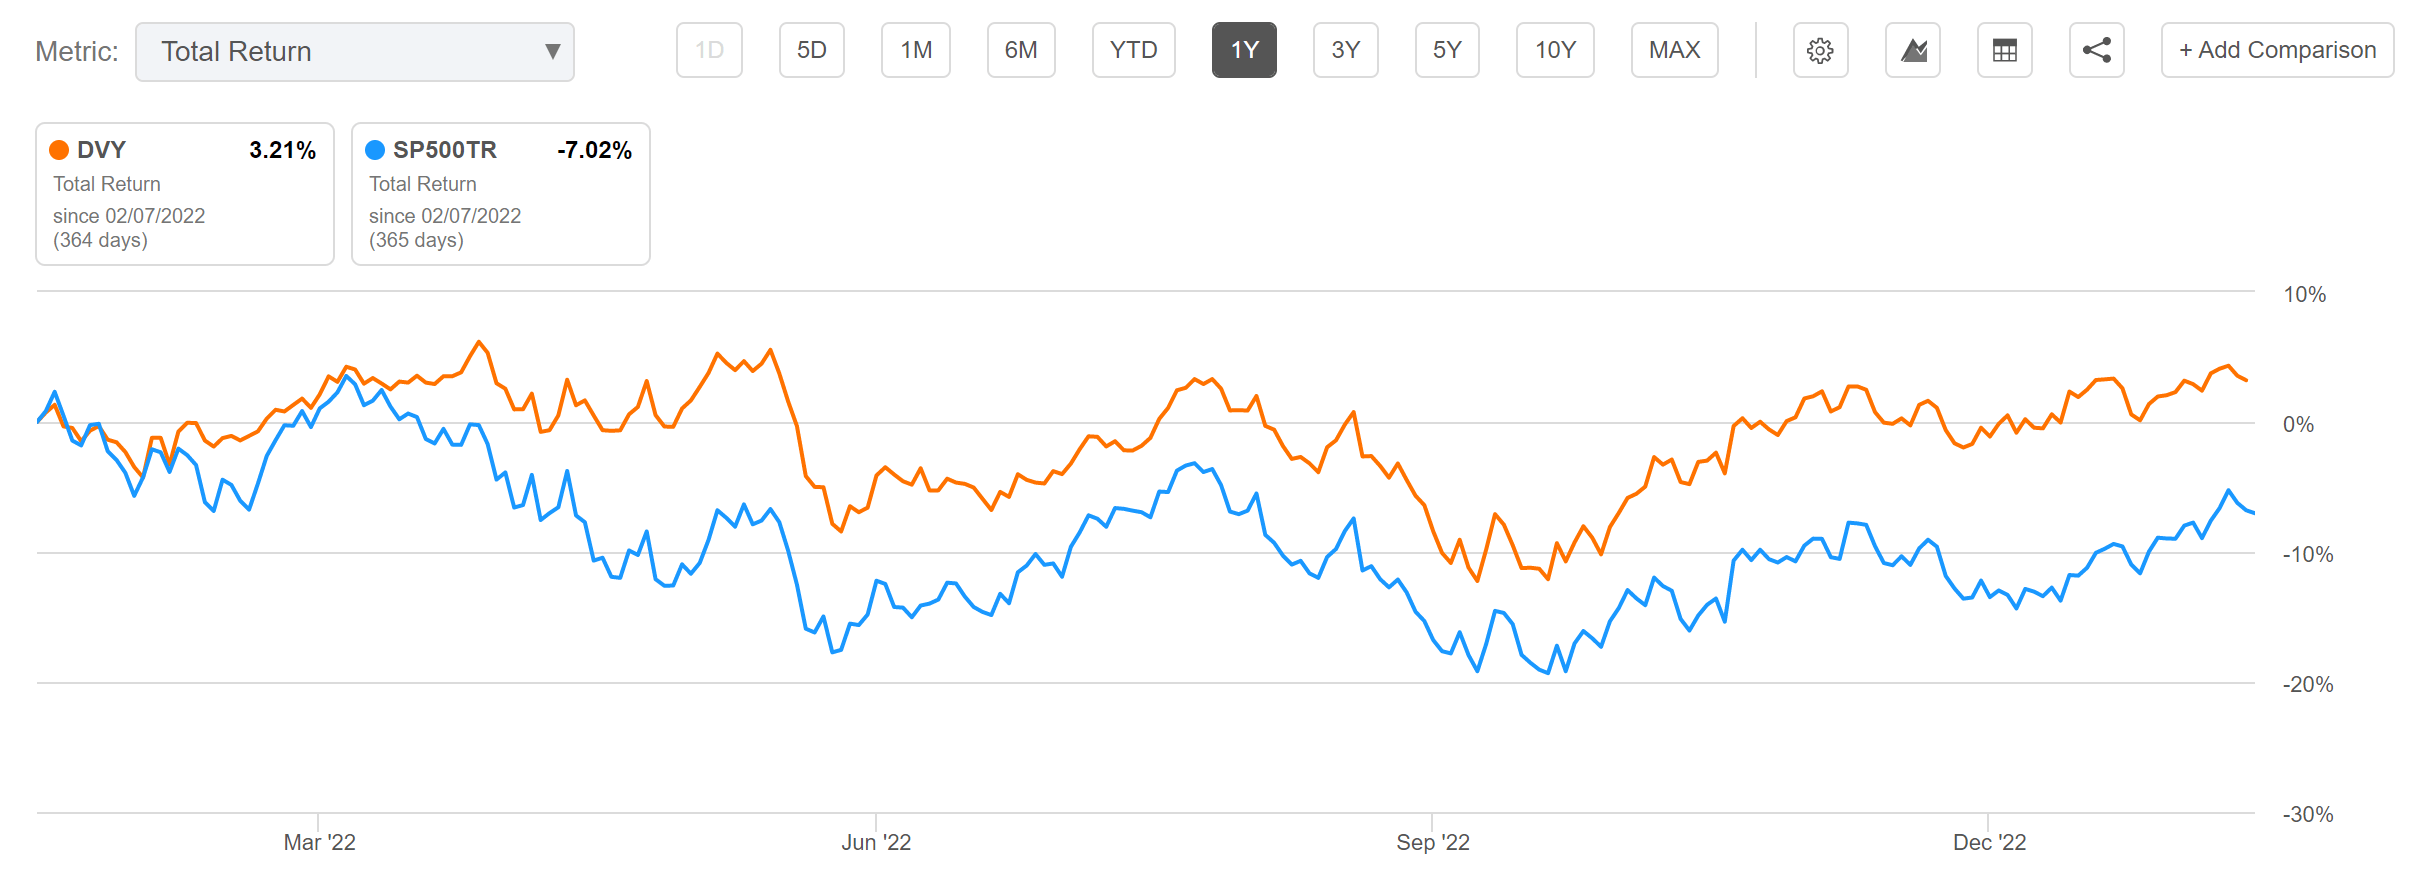
Below you can find the Top 10 Holdings of this ETF. We can see that companies such as Exxon Mobil (NYSE:XOM), Altria (MO) or Philip Morris International (NYSE:PM), which have a proven long history of Dividend Growth, are among the Top 10 Holdings of this ETF. Altria, for example, currently pays its shareholders a Dividend Yield [FWD] of 8.01% while it has shown an Average Dividend Growth of 7.70% over the past 5 years.
Source: Seeking Alpha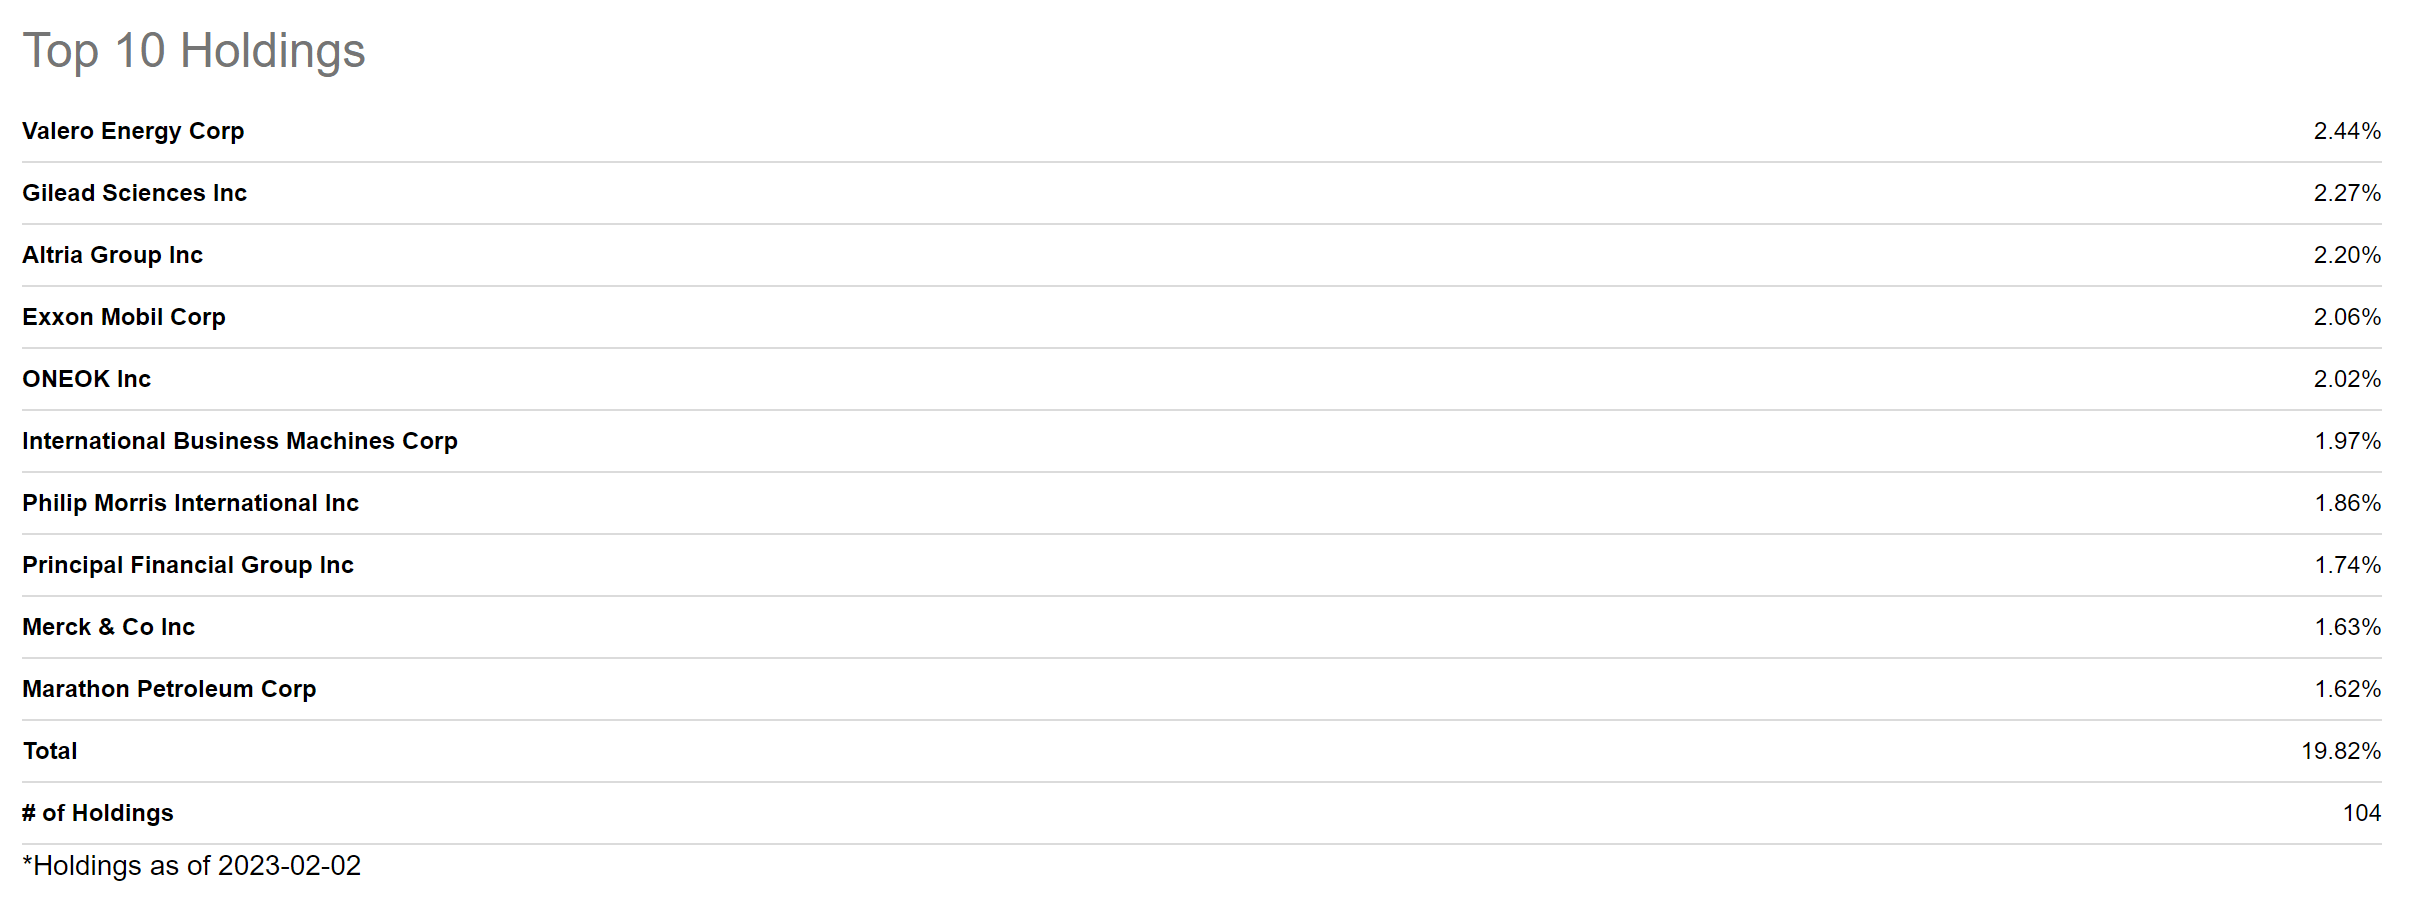
Having these types of companies as part of this ETF, strengthens my belief that it should continue to provide investors with an attractive combination of Dividend Yield and Dividend Growth in the upcoming years, thus making this ETF an ideal pick for this portfolio.
According to the Seeking Alpha Quant Rating, DVY is currently rated as a buy, which supports my own buy rating.
Source: Seeking Alpha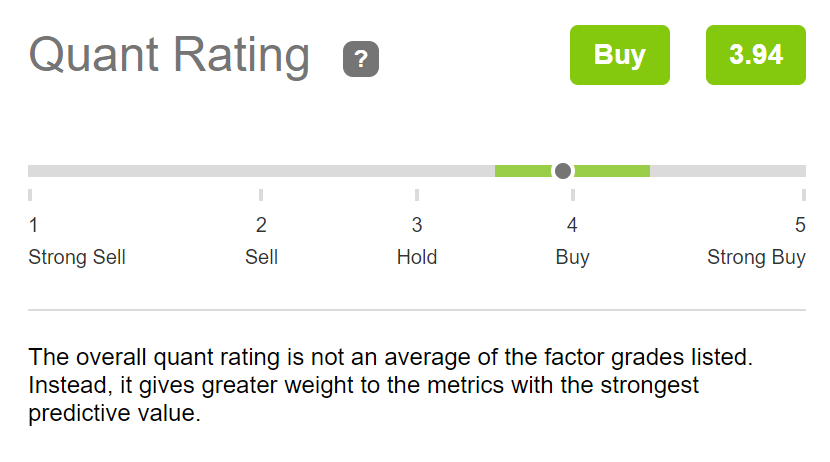
Johnson & Johnson
Johnson & Johnson is among my favorite picks when looking for a company that can provide a relatively attractive Dividend Yield and Dividend Growth, and at the same time is able to contribute to reducing the volatility of your investment portfolio.
When creating an investment portfolio, I think it’s important to not only have companies that can ensure your portfolio achieves a high Total Return; it is also important to have companies in the mix that provide a certain stability and that can protect your portfolio in times of a recession or a stock market crash. In my view, Johnson & Johnson is such a company.
Within the past 12 month period, Johnson & Johnson has shown a Total Return of -1.99% when compared to the Total Return of the S&P 500, which has been -6.79%, indicating that the company can contribute to protecting your portfolio.
Source: Seeking Alpha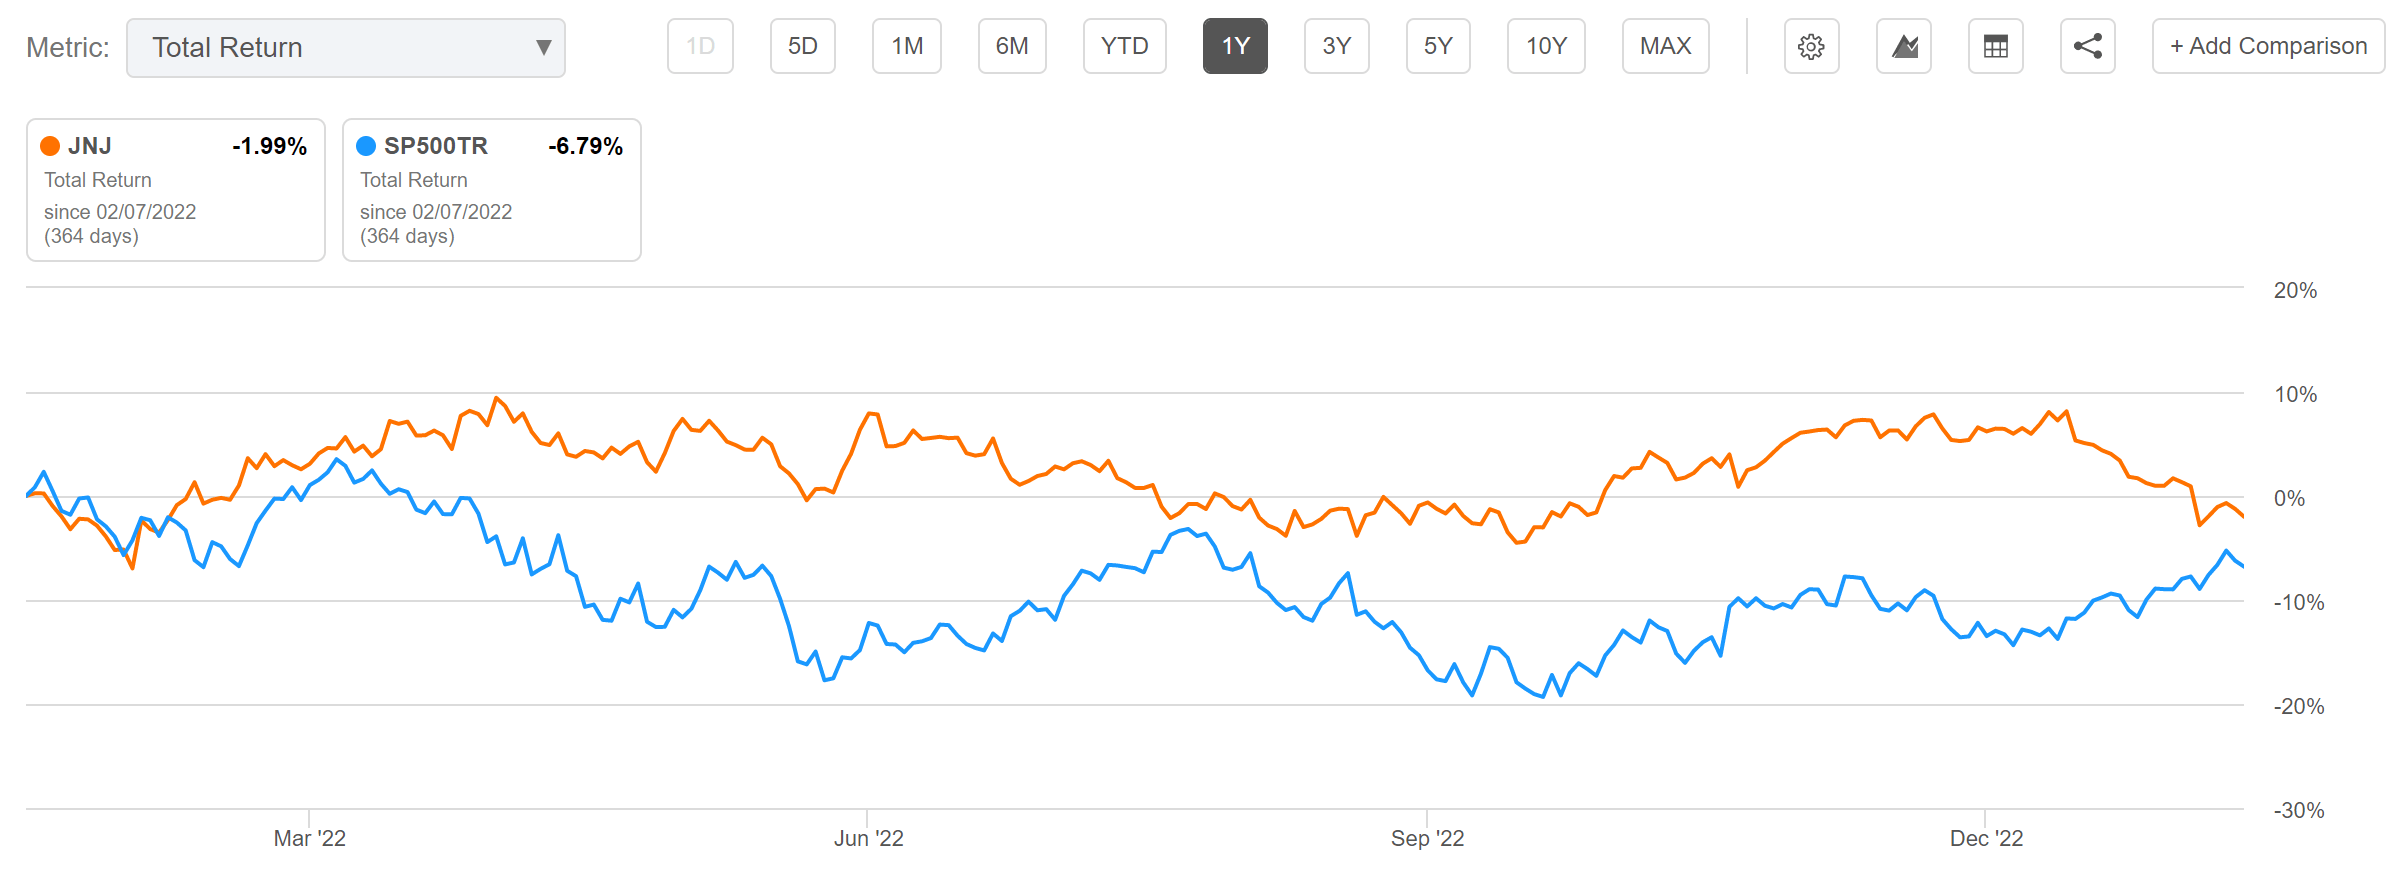
We get further approval that Johnson & Johnson can contribute to reducing the level of risk and volatility associated with your portfolio from looking at the company’s low 24M Beta of 0.32. This number shows us that if the broader stock market was to decrease by 10%, the Johnson & Johnson stock would tend to go down by only 3.2%, which serves as a strong indicator that the company is an excellent fit for this portfolio in order to reduce its volatility.
Moreover, I consider Johnson & Johnson’s current Valuation to be very attractive. At this moment of writing, Johnson & Johnson has a P/E [FWD] Ratio of only 18.67, which is 32.54% below the Sector Median (27.68). At the same time, the company’s P/E [FWD] Ratio is significantly lower than its competitors such as Eli Lilly and Company (NYSE:LLY) (P/E [FWD] Ratio of 41.80), AstraZeneca (NASDAQ:AZN) (30.52) and Novo Nordisk A/S (NVO) (28.32).
The Seeking Alpha Dividend Grades, which are shown below, confirm that Johnson & Johnson is not only an excellent choice in order to reduce portfolio volatility, but it also provides us with evidence that the company can provide you with an attractive Dividend Yield and with Dividend Growth. In terms of Dividend Growth and Dividend Consistency, the company is rated with an A+. For Dividend Yield, it receives a B+ rating.
Source: Seeking Alpha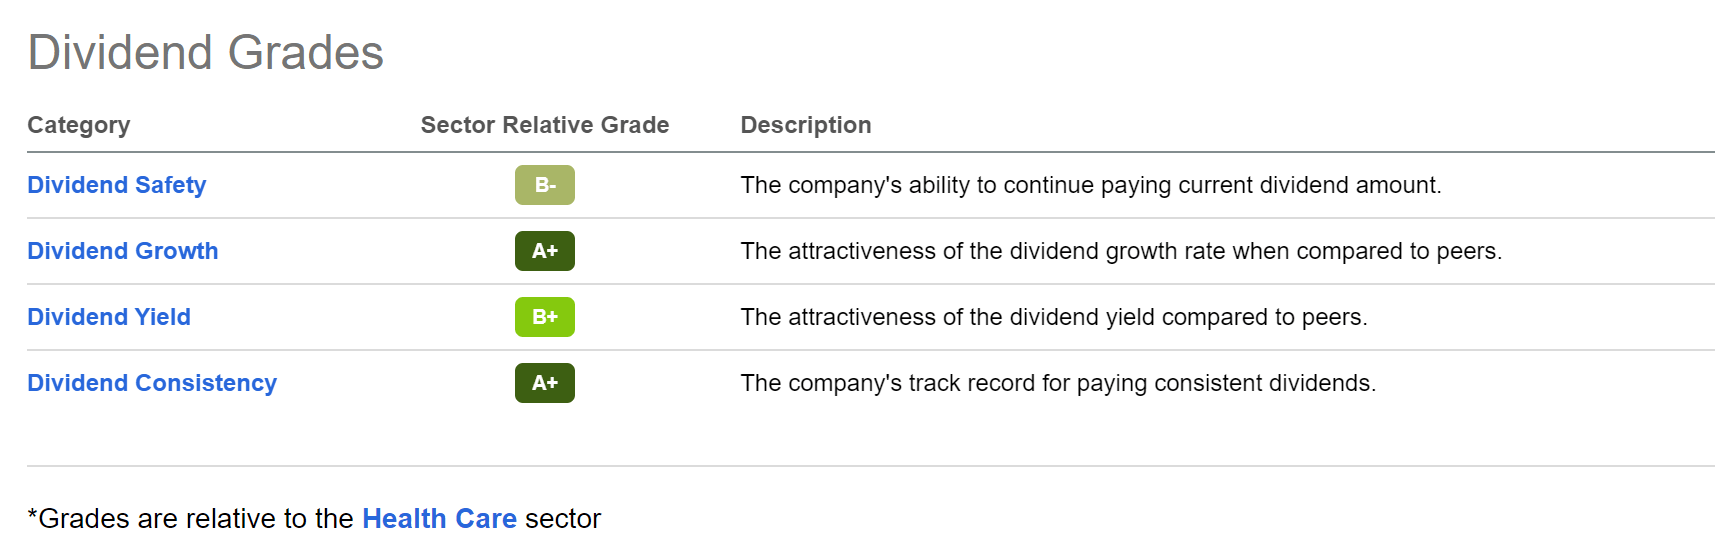
Visa
Visa is among my top choices when looking for a company that can provide Dividend Growth to your investment portfolio. There are a wide variety of metrics that make me believe that Visa should be able to provide your investment portfolio with Dividend Growth: the company’s Dividend Growth Rate 5Y [CAGR] is 17.95% and its Average Free Cash Flow Per Share Growth Rate [FWD] over the past 5 years is 16.43%. Both numbers support my theory that Visa should be able to contribute to increasing the Average Dividend Growth Rate of your investment portfolio in the following years.
In addition to that, Visa’s Revenue Growth Rate [FWD] is 14.14% and its EPS Diluted Growth [FWD] Rate is 17.74%, confirming that the company is absolutely on track in terms of Growth. All these metrics reinforce my belief that Visa should be able to grow its dividend substantially in the coming years and therefore be able to raise the Average Dividend Growth Rate of your portfolio.
In addition, Visa currently has an extremely attractive Valuation: Visa’s P/E [FWD] ratio is 28.00, which is 13.45% below its average of the last 5 years. At the same time, the company currently has a Price / Cash Flow [FWD] Ratio of 25.07, which is 17.73% below its Average Price / Cash Flow [FWD] Ratio over the past 5 years. This confirms that you will currently pay a lower price compared to the Cash Flow that the company generates year over year when compared to its 5 Year Average.
Moreover, Visa’s Price / Sales [FWD] Ratio of 14.61% is 10.84% below its Average from the past 5 years (16.38), once again providing evidence that the company is currently undervalued.
In addition to the above, I would like to point out that Visa’s current Valuation is lower than that of its main competitors: when comparing the company’s Valuation with Mastercard (NYSE:MA), or PayPal (NASDAQ:PYPL), it can be highlighted that Visa has the lowest Valuation among the three: while Visa’s current P/E [FWD] Ratio is 28.00, Mastercard’s is 30.70 and PayPal’s is 38.54.
The Seeking Alpha Quant Ranking further confirms that Visa is one of the top picks in its Industry and Sector: the company is ranked 16th out of 69 within the Data Processing and Outsourced Services Industry and 117th out of 662 within the Information Technology Sector.
Source: Seeking Alpha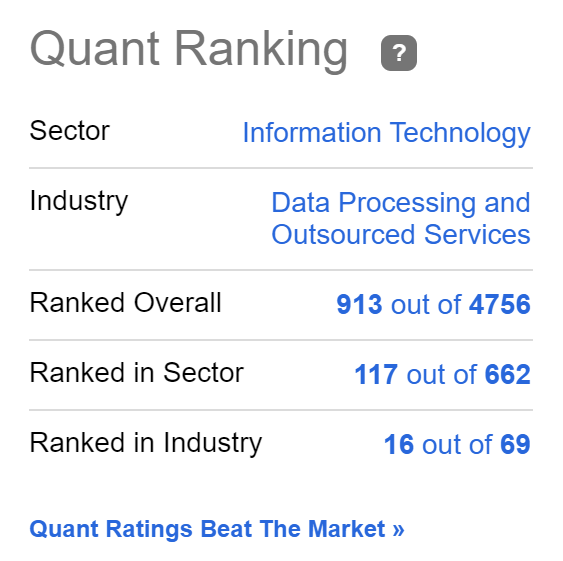
Apple
When building a portfolio consisting of only 5 picks, we need to make sure that the probability of an attractive Total Return of the company we aim to invest in is high. This is due to the percentage of the pick’s overall portfolio being relatively high. Even though we have already reduced the percentage of each company to 6.67% (due to the fact that we have allocated 80% of this investment portfolio between the 2 selected ETFs). One of the companies that I believe offers a high probability to show an attractive Total Return over the long term is Apple.
Within the past 5 years, the company from Cupertino has managed to clearly outperform the S&P 500: in this time period, Apple has shown a Total Return of 300.57% while the S&P 500 has shown 66.61%.
Source: Seeking Alpha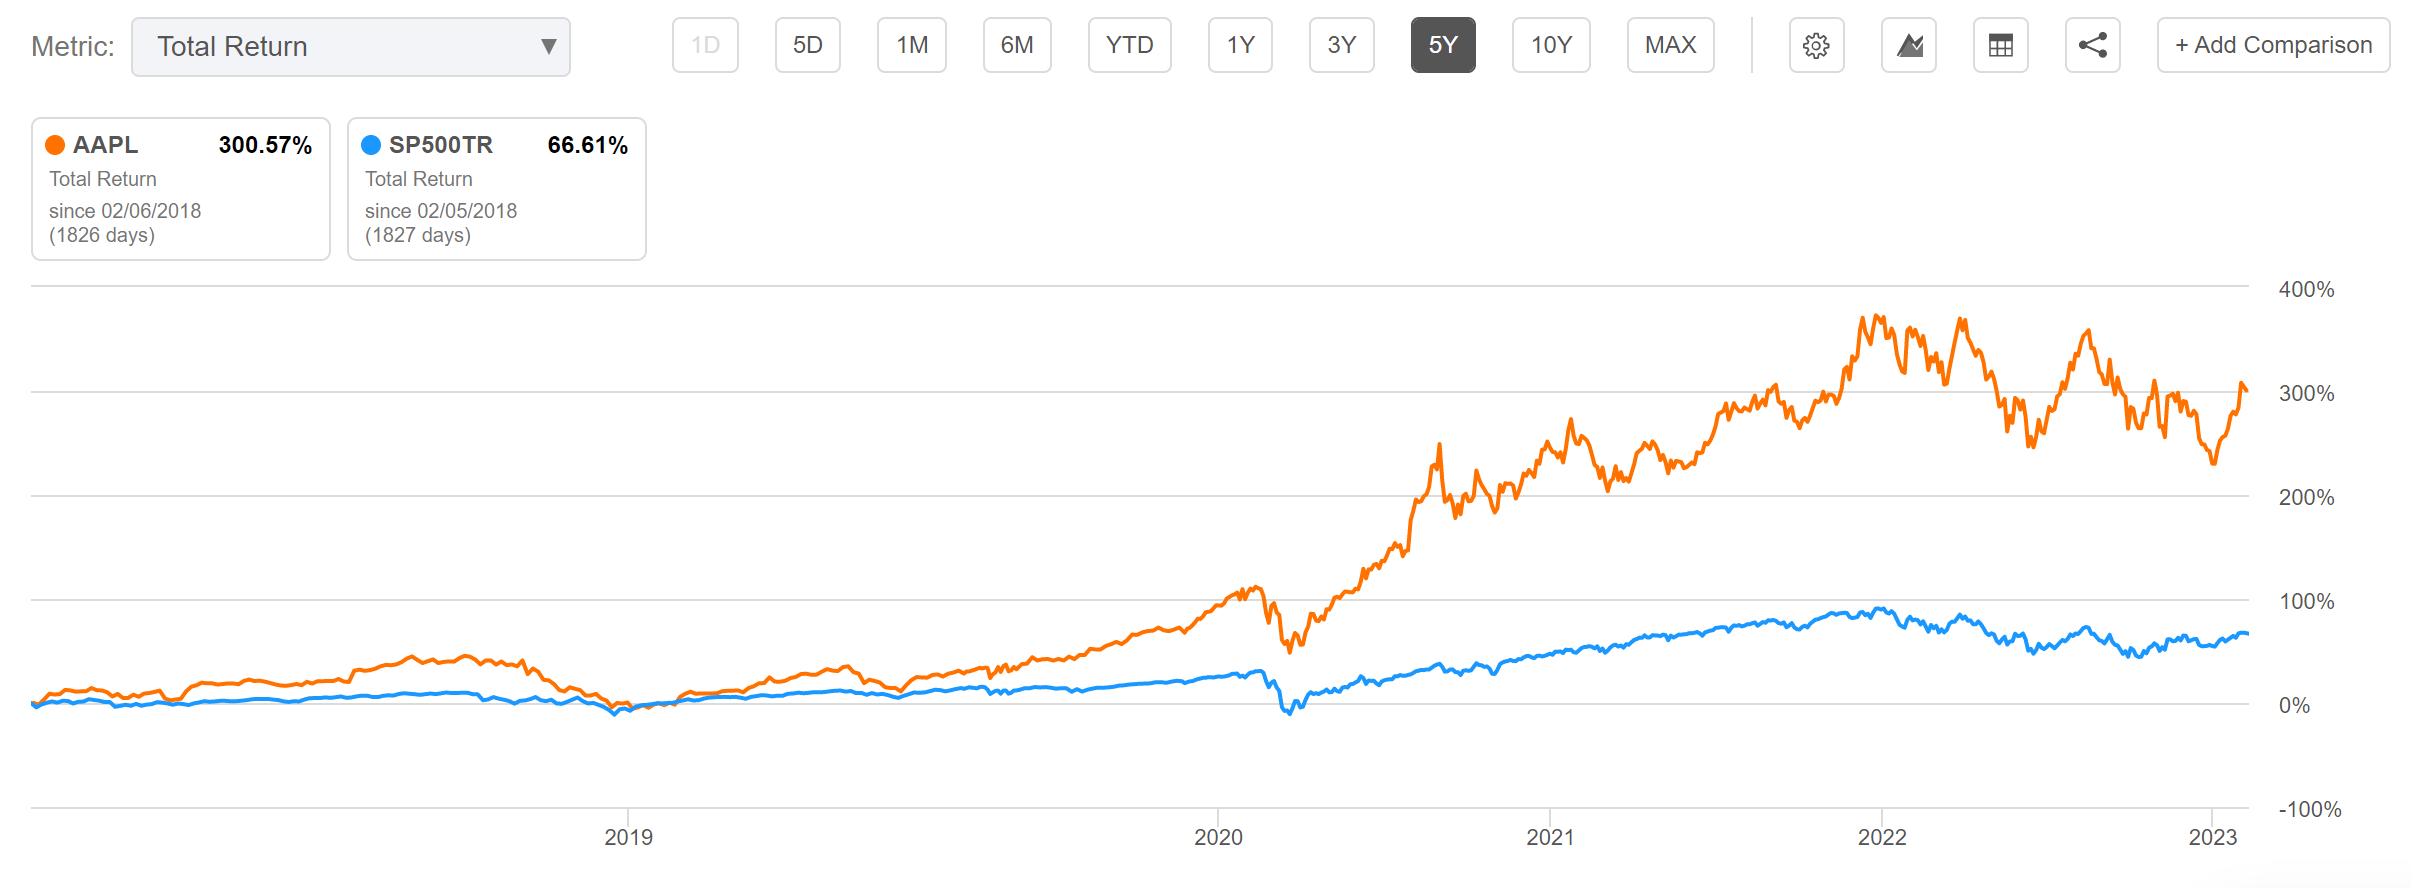
Even though I don’t believe that Apple will continue to outperform the S&P 500 to such a degree, I do believe it could be able to slightly outperform the S&P 500 over the next years, thus making the company an attractive choice to be part of this portfolio. The reasons for believing this are, among other factors, the company’s strong competitive advantages that I expect to contribute to its continuous growth in the years to come.
Even though the company is not cheap at its current price level, I believe that the current stock price is not too high. The Apple stock still receives my buy rating: Apple’s P/E [FWD] Ratio of 25.91 is only 8.97% above its P/E [FWD] Ratio from the past 5 years (23.13), indicating that the company is currently fairly valued.
Conclusion
One of the objectives of this article was it to show you how you could build an investment portfolio with the amount of $5,000. In addition to that, I have demonstrated how you could allocate this amount among 5 picks in order to achieve a broad diversification, a reduced level of risk, and, at the same time, aspire to achieve an attractive Dividend Yield in combination with Dividend Growth.
In order to significantly reduce the level of risk of your investment portfolio (so that its Total Return depends less on the individual performance of some of the selected picks), I have suggested allocating 80% between two different ETFs (40% for SCHD and 40% for DVY).
Due to the allocation of this portfolio that I have built for you in this article, you would achieve an attractive Weighted Average Dividend Yield [TTM] of 2.94%. At the same time, the selected picks have shown an attractive Weighted Average Dividend Growth Rate of 10.42% over the past 5 years. This strengthens my belief that they should be able to provide you with significant Dividend Growth in the years ahead.
At the same time, and in addition to the ETFs that I have selected for you, there is also a stock which helps you to reduce portfolio volatility (Johnson & Johnson) and which would contribute to protect your portfolio during the next stock market crash. There is also one that I expect to contribute significantly to a higher Average Dividend Growth Rate of your portfolio (Visa) and another that has strong competitive advantages and I expect to be able to show an attractive compound annual rate of return while having a long investment horizon (Apple).
Due to the allocation of these 5 picks, you could benefit from the broad risk diversification of its ETFs while also benefiting from the advantages of each individual company selected for this portfolio (Johnson & Johnson, Visa and Apple).
Authors Note: Thank you for reading! I would love to hear your feedback on this article! How would you allocate $5,000 among 5 ETFs/companies? Do you own any of the ETFs/companies mentioned in this article?
Editor’s Note: This article discusses one or more securities that do not trade on a major U.S. exchange. Please be aware of the risks associated with these stocks.
Be the first to comment