

Fundamental Forecast for the US Dollar: Neutral
- But for the Russia-Ukraine conflict, the US Dollar‘s fundamental moorings appear to be less supportive.
- The 2s5s10s butterfly has receded to its narrowest spread since October 2021, a sign that the US Treasury yield curve has become less supportive of the US Dollar.
- According to the IG Client Sentiment Index, the US Dollar has a mixed bias heading into the last week of February.
US Dollar Week in Review
The US Dollar had another strong week, adding +0.63%, its fifth consecutive weekly gain in a row, and seventh over its past eight. Even though EUR/USD rates saw a fair degree of volatility, it only closed lower by -0.17%. Instead, GBP/USD and USD/JPY rates were the driving factors behind the DXY’s gains, with the former losing -1.43% and the latter adding +2.20%. With energy and grain prices calming down, the commodity currencies backed off as well: AUD/USD rates were down by -1.14%; USD/CAD rates added +0.18%; and NZD/USD rates fell by -0.80%.
It remains the case that US economic data are not a significant factor in the US Dollar’s recent success; markets barely reacted to either the February US nonfarm payrolls report or the February US consumer price index releases over the past two weeks. Instead, with the European Union’s and United States’ sanctions continuing to reverberate back to the West in the form of higher commodity prices and interbank market funding stresses, demand for liquidity has been the primary reason behind greenback strength.
US Economic Calendar in Focus
Consistent with the US Dollar’s lack of reaction to typically important US economic data releases, it is reasonable to question whether or not the March Federal Reserve meeting will produce a significant impact unto itself.
The fact is, ever since Fed Chair Jerome Powell said that he would back a 25-bps rate hike this month, sensitivity to US economic data has been diminished. When the Fed raises rates this week, there is a decent chance that markets simply treat it like a fait accompli and immediately shift their attention back to headlines around Russia and Ukraine.
Nevertheless, here’s the US economic data due out in the coming days:
- On Tuesday, March 15, the February US producer price index is due at 12:30 GMT, while January US net long-term TIC flows will be released at 20 GMT.
- On Wednesday, March 16, weekly mortgage applications figures will be published at 11 GMT, followed by February US retail sales at 12:30 GMT. January US business inventories and the March US NAHB housing market index are scheduled to come out after the US cash equity open at 14 GMT. In the afternoon, the results of the March Fed meeting are due at 18 GMT, followed by Fed Chair Powell’s press conference at 18:30 GMT.
- On Thursday, March 17, weekly US jobless claims figures are in focus at 12:30 GMT, alongside February US building permits, February US housing starts, and the March US Philadelphia Fed manufacturing index. February US industrial production data are due at 13:15 GMT.
- On Friday, March 18, the February US Conference Board leading index will be published at 14 GMT, as will February US existing home sales. Richmond Fed President Tom Barkin will give remarks at 16:30 GMT. Chicago Fed President Charles Evans will speak at 18 GMT, with Fed Governor Michelle Bowman talking at 19 GMT.
Atlanta Fed GDPNow 1Q’22 Growth Estimate (March 8, 2021) (Chart 1)
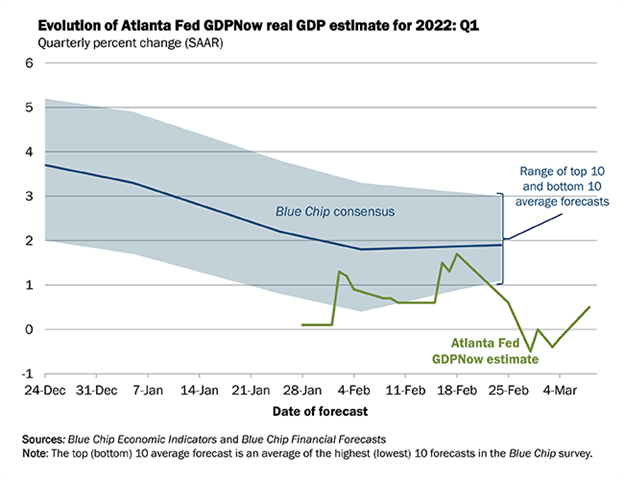
Based on the data received thus far about 1Q’22, the Atlanta Fed GDPNow growth forecast is now at +0.5% annualized, up from 0% on March 1. The downgrade was a result of “first-quarter real personal consumption expenditures growth increased from +2.3% to +3.4%, while the nowcast of the contribution of net exports to first-quarter real GDP growth decreased from -0.94% to -1.00%”
The next update to the 1Q’22 Atlanta Fed GDPNow growth forecast is due on Wednesday, March 16 after the February US retail sales and business inventories data.
For full US economic data forecasts, view the DailyFX economic calendar.
The First of Many Rate Hikes
It is effectively set in stone that the Fed will hike rates by 25-bps at their meeting this week. We can measure whether a Fed rate hike is being priced-in using Eurodollar contracts by examining the difference in borrowing costs for commercial banks over a specific time horizon in the future. Chart 2 below showcases the difference in borrowing costs – the spread – for the March 2022 and December 2023 contracts, in order to gauge where interest rates are headed by December 2023.
Eurodollar Futures Contract Spread (March 2022-December 2023) [BLUE], US 2s5s10s Butterfly [ORANGE], DXY Index [RED]: Daily Timeframe (March 2021 to March 2022) (Chart 2)
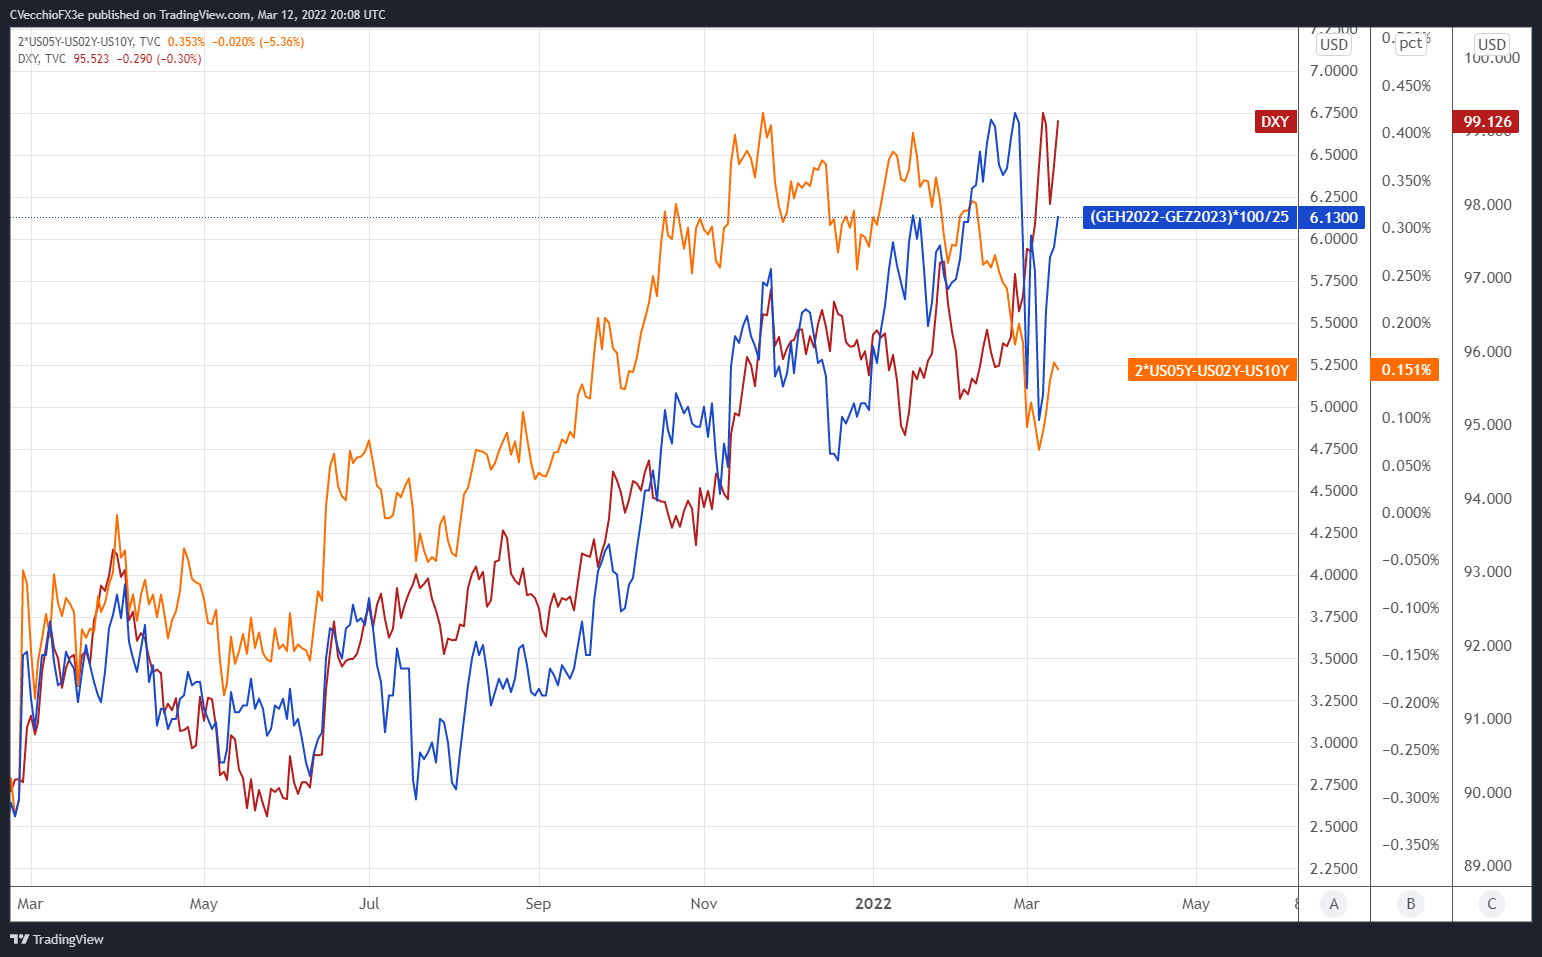
By comparing Fed rate hike odds with the US Treasury 2s5s10s butterfly, we can gauge whether or not the bond market is acting in a manner consistent with what occurred in 2013/2014 when the Fed signaled its intention to taper its QE program. The 2s5s10s butterfly measures non-parallel shifts in the US yield curve, and if history is accurate, this means that intermediate rates should rise faster than short-end or long-end rates.
There are six25-bps rate hikes discounted through the end of 2023. Rates markets are pricing in a 100% chance of six 25-bps rate hikes and a 13% chance of seven 25-bps rate hikes through the end of next year. The 2s5s10s butterfly has begun to widen in recent weeks, evidence that markets are refocusing on what the Fed will do and less on the market implications around Russia’s invasion of Ukraine.
US Treasury Yield Curve (1-year to 30-years) (March 2020 to March 2022) (Chart 3)
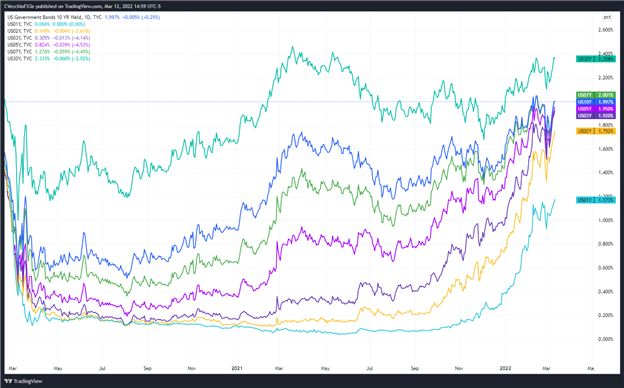
The widening of the 2s5s10s butterfly coupled with rising US Treasury yields is helping reinforce the US Dollar’s rebound. Rapidly rising inflation expectations (as measured by the 2y2y and 5y5y inflation swap forwards) coupled with evidence of liquidity stresses persisting suggest that the US Dollar will not be weighed down by the Fed only raising rates by 25-bps this week. Bonds are positioned such that it is very likely the Fed raises rates for several consecutive meetings in a row: March, May, June, and July, at a minimum.
CFTC COT US Dollar Futures Positioning (March 2020 to March 2022) (Chart 4)
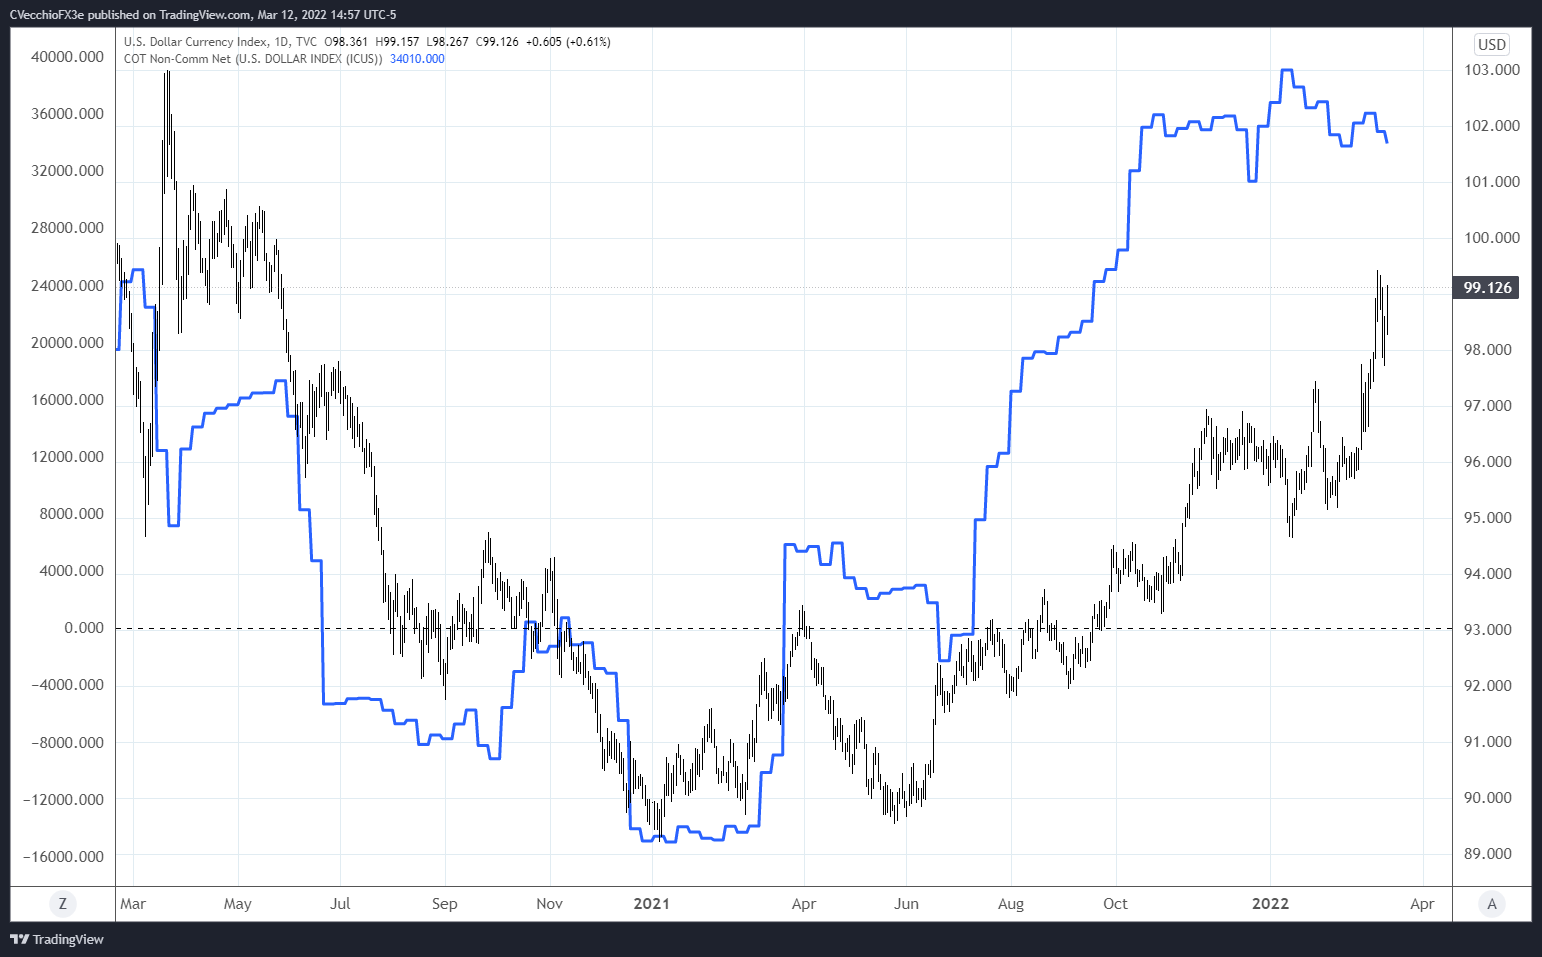
Finally, looking at positioning, according to the CFTC’s COT for the week ended March 8, speculators decreased their net-long US Dollar positions to 34,010 contracts from 34,743 contracts. Net-long US Dollar positioning has continued to prove stable since October 2021, just off its highest level since October 2019.
— Written by Christopher Vecchio, CFA, Senior Strategist
Be the first to comment