

Mykola Sosiukin/iStock via Getty Images
This article was published on Dividend Kings on Wednesday, Jan. 4, 2023.
Lottery fever is sweeping the nation yet again. In the last few days, 250 million Megamillions tickets were sold, about one for every adult in the US.
And why not?
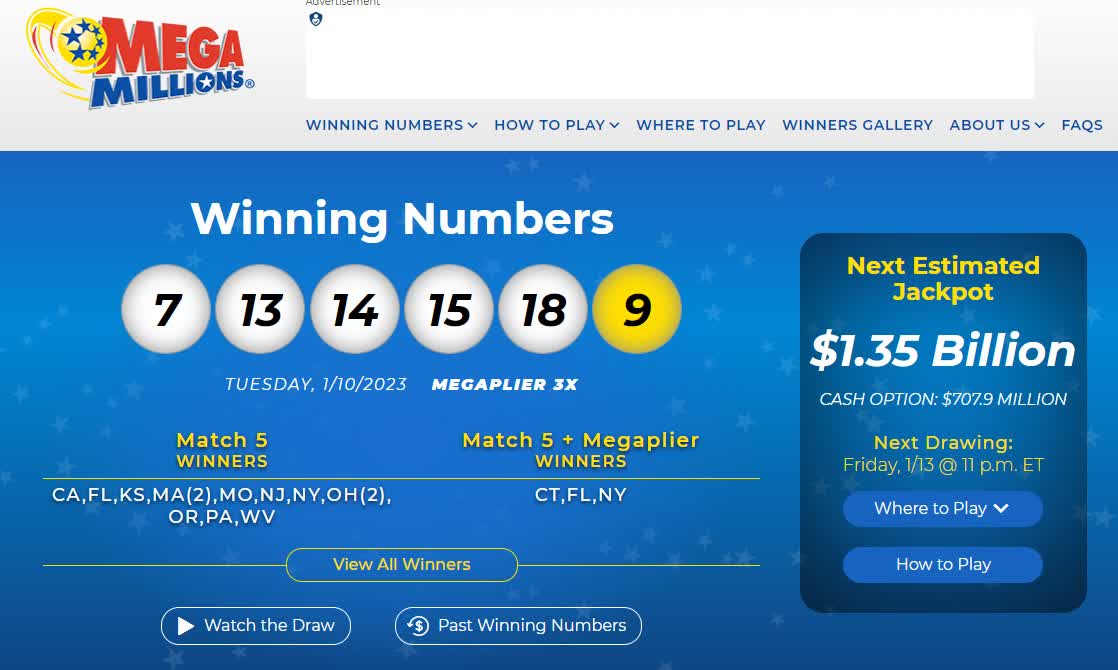
Megamillions
People are dreaming of becoming overnight billionaires with almost $1.5 billion on offer.
But before you get too swept up in the mania, let me remind you of three important facts.
3 Critical Things To Know About This Billion-Dollar Jackpot
First, I must admit that anytime the jackpot goes above $1 billion, I buy one ticket, no more, no less.
The reason is simple. If I buy no tickets, my odds of winning are zero. If I buy one ticket, the odds are one in 303 million. That’s infinitely better than zero, and my family gets to spend a few days dreaming about what each of us would do with our $300,000 year-one payday (more on this later).
Why not buy two tickets? Or three? Because 2/303 million odds are effectively the same as 1/303 million, the marginal benefit is half as large.
In other words, buying two tickets, or even 20, won’t let my family dream of what we’d do with our riches any more than one.
But does it ever actually make sense, mathematically speaking, to play the lottery? Nope.
You might think that if the jackpot gets big enough, such as over $303 million, then it makes statistical sense to buy a ticket. While there are emotional reasons to do so, as I do, the math is very clear.
The famous saying “the lottery is a tax on those who can’t do math” is accurate.
For the sake of an example, if all 320 million people in the United States buy a single random ticket, the probability that at least one person wins is about 66.6%. “That ‘at least’ part is key, though,” Dreyer says. “The probability that exactly one person wins is 36.6%. That means that 45% of the time if you win, you’re splitting the jackpot with at least one other person. … Presumably, the larger the prize, the more tickets people purchase, and the more likely you are to split the prize. It is a nasty spiral.” – Forbes
When the jackpot grows so large that 320 million tickets get sold (possibly the Friday drawing), more likely than not, there will be more than one winner.
And you can’t forget about taxes, which will run 40% to 45% of the cash option for most people.
What does this mean for math? No matter how large the jackpot gets, for every $1 you spend on the lottery, you can never expect to win more than $0.86. There is never a time when the lottery is a good investment.
- the lottery is always and forever, for entertainment purposes only
And this often-overlooked fact that taxes and multiple winners will always ruin the lotto math brings me to another important point.
The Jackpot Needs To Be $4 Billion To Become An Overnight Billionaire
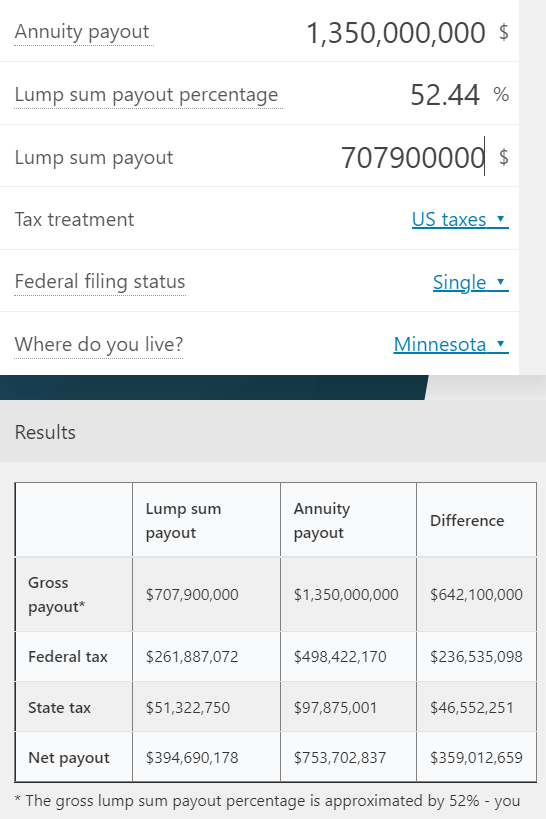
Omnicalculator
In my home state, the after-tax cash option is 26% of the jackpot, or $395 million. Even if you live in a state that doesn’t tax the lotto (like FL), you aren’t going to be joining the three commas club.
Not unless the jackpot grows to approximately $4 billion.
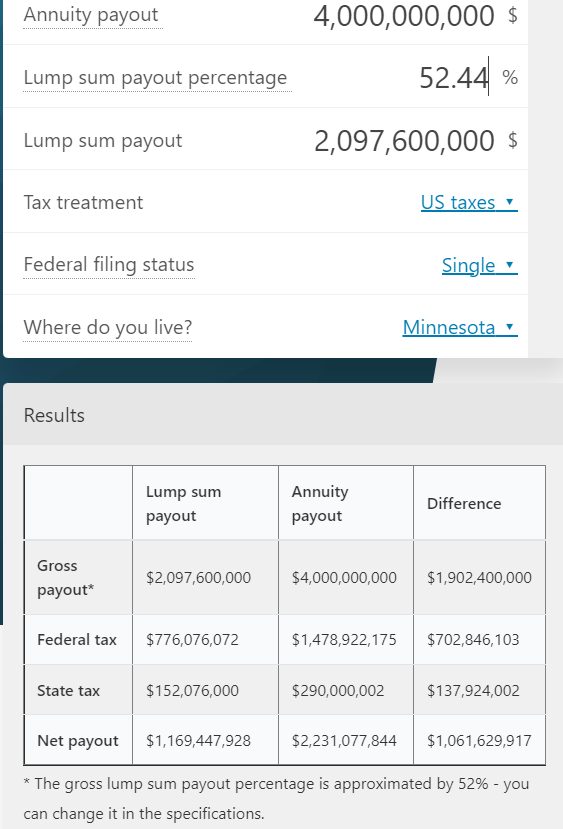
omnicalculator
And most importantly of all, if you do win the jackpot, you must beware of the lottery curse.
Jackpots Can Be As Much A Curse As A Blessing
Money isn’t good or evil, it’s a powerful tool like fire. In the right hands, it can build civilizations and empires. In the wrong hands, it can burn your house down and destroy everything you love.
Money won’t make you into a sinner or a saint, it just magnifies who you already are.
Just take a look at some of these examples of too much money landing in the hands of the wrong people, who fell victim to the lottery curse.
Jack Whittaker: Won $315 million in 2002
Not all states let winners stay anonymous, and Jack Whittaker’s win was widely publicized. He was deluged with people asking for money and favors…
His company was hit with frivolous lawsuits from people who wanted to get access to his deep pockets, which cost him millions in legal fees…
A year later, Brandi (his granddaughter) was found dead under suspicious circumstances. The case was never solved…
Brandi’s mother, was found dead seven years after he won the jackpot. Whittaker’s wife divorced him.” – liveabout.com
Mr. Whittaker was already rich when he won this jackpot. He’s proof that even smart people can become overwhelmed when the world learns you’ve become super rich.
William Post III: Won $16.2 million in the Pennsylvania Lottery
Post spent his money wildly. He spent most of the first yearly installment of his winnings, which totaled over $400,000, in just two weeks. After a year, he was half a million dollars in debt…
His girlfriend sued him, claiming they had agreed to share the money if he won. When she won her court claim, he couldn’t pay, so his lottery payouts were frozen.
He had to declare bankruptcy, and he only managed to hold onto about $2.6 million — which he immediately spent. He was arrested for assault after firing a shotgun at a man who was pestering him for money.
Worst of all, his brother hired a hitman to kill him and his wife so he’d inherit the money. Post was on wife number six at that point.
Thirteen years later, this lottery curse victim died alone and penniless. He’d been living off of welfare payments. – liveabout.com
And these are just two of the most dramatic tales of woe-befalling winners of multi-million dollar jackpots.
So what if I’m “lucky” enough to win? Here’s how I make sure that my family doesn’t suffer the lottery curse and that this blessing remains so.
What You Should Do If You’re “Lucky” Enough To Win The Lottery
Statefarm
Statefarm
State Farm has three great articles about what to do if you win the lottery, but it boils down to this.
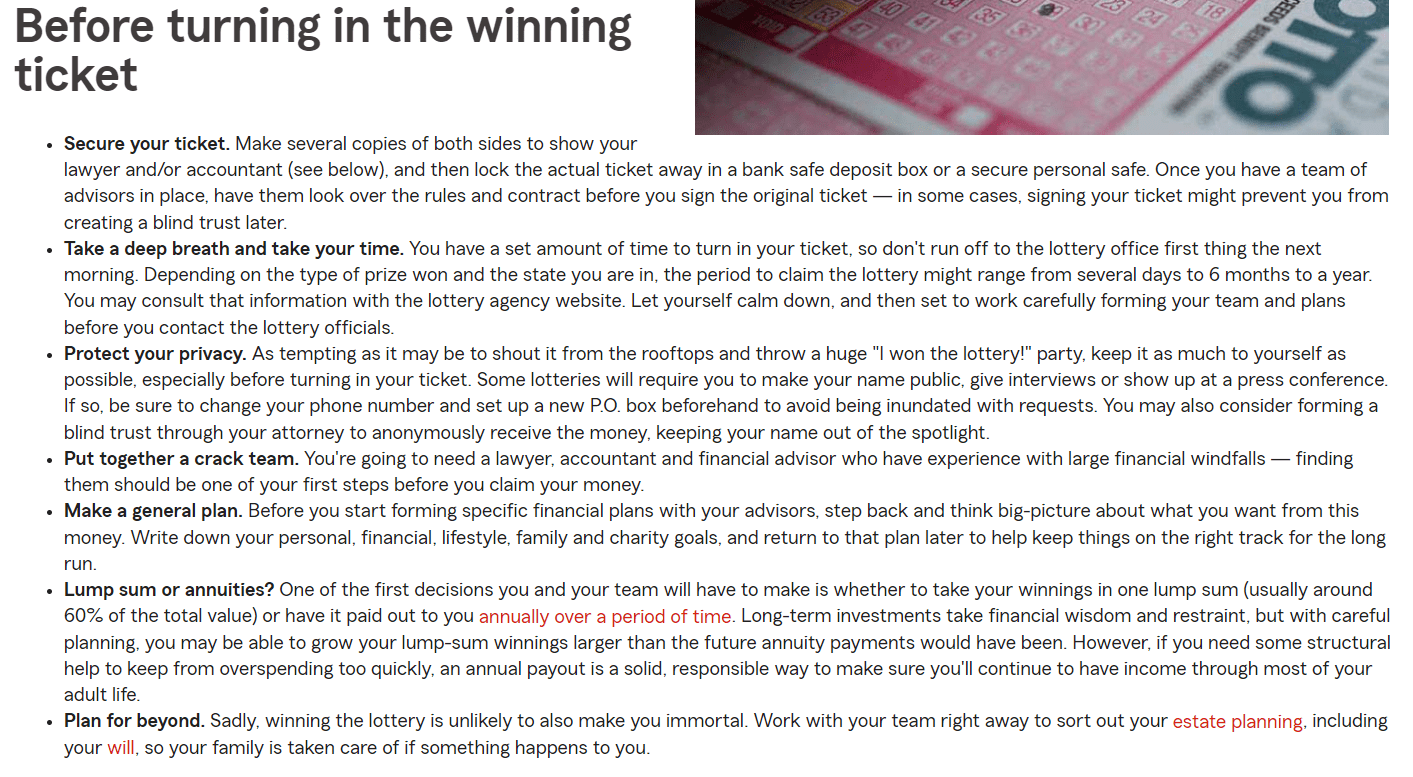
- protect the ticket (sign, photocopy both sides, safety deposit box until you claim it)
- protect your privacy (if your state allows it, remain anonymous forever, tell no one outside your circle of trust)
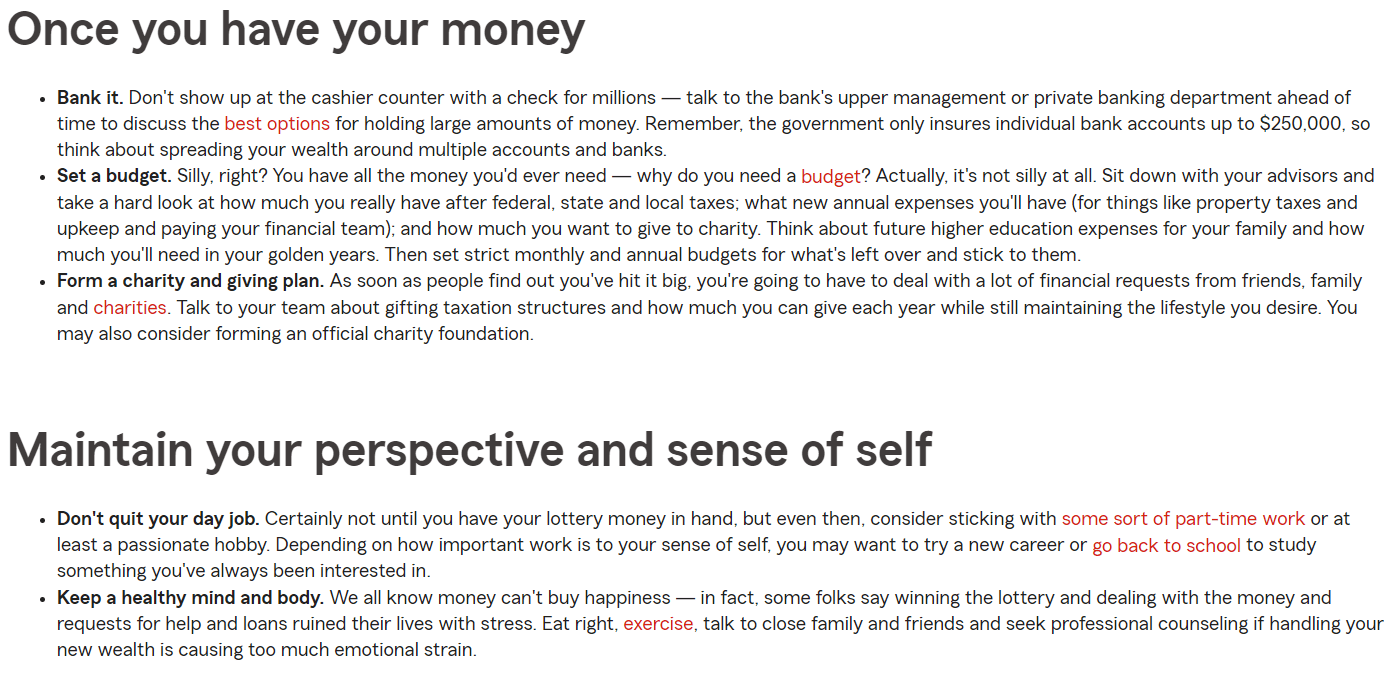
- protect your newfound wealth (invest it wisely)
- protect your sanity (don’t let the money change you)
What if I won? How would I protect my family from the dreaded lottery curse?
What I’ll Do If I Win The Jackpot
I would tell no one other than the six family and friends who would share in the annual distributions from my new family trust.
I would keep working because I love what I do. Helping people learn how to achieve their financial dreams is my life’s mission, not a job.
Find something you love to do, and you’ll never work a day in your life.” – Harvey MacKay
And here’s how I’d actually spend that $395 million check.
- Immediately take 1%, or $3.95 million and spend it on charity and family and friends
50% of that would go to GiveDirectly, my favorite charity. Why? For all the reasons I explain in this article.
Would I even tell GiveDirectly that I won the lottery? No, the fewer people know, the better.
I would coordinate the annual million-dollar match campaign with them to allow my $2 million donation to become part of a $3 million match campaign so that I double the impact.
- $4 million effective donation
- 8,333 people lifted out of poverty
- $10.4 million economic impact
I would take the other $2 million for my six closest and most trusted family and friends and split it into six equal amounts.
Every year I would increase the donation to charity by 0.1% all the way to 5.0%.
The family and friends distributions would also rise by 0.1% per year, capped at 1%.
As the hedge fund grows (a home office fund I would manage myself via a spreadsheet that takes minutes per year), GiveDirectly and each of my family members would get exponentially more.
What about splurging on dreams, like cars, mansions, yachts, and private jets?
Here is the only thing I’d buy right away.

Toyota
This is my dream car, the 2023 Toyota Prius Prime.
- Consumer Reports most reliable car in the world
- the lowest cost of ownership
- 40 miles all-electric range
- than 57 MPG after that
- can fit a 65-inch TV in the back (I’ve done this)
- It looks like a Ferrari
- the ultimate chick magnate for the kind of woman I’m looking to marry and start a family with;)
What about a mega-mansion? My dream home is in North Oaks, the richest town in Minnesota (3rd to 5th best state to raise a family in every year, according to US New and World Reports).
- MN is the Finland of America, a utopia for raising a family
North Oaks has a median income of $179K and a median home value of $830K. It also has some of the best schools in the country, is incredibly safe, and is five minutes from my family. This is the kind of home I dream of and one day will buy for my family. A $1 to $2 million home that’s luxurious but not outrageously lavish.

Sotheby’s
No penthouses or corporate jets for me.
I wouldn’t even buy a house like this right away, lest that tip off someone to the jackpot win. I’d wait a year or two and get a mortgage.
Why not pay cash? Because of what I plan to do with 99% of the $395 million jackpot.
How I’d Invest The “$1.5 Billion” Jackpot
The key to my family’s jackpot dreams is the same thing that fuels our long-term plans. That would be the ZEUS Income Growth Portfolio that will one day be our family office hedge fund.
Dividend Kings ZEUS Income Growth Portfolio
I’ve linked to articles about each of the 14 world-beater blue-chips I plan to entrust with 100% of my life savings as soon as my family can afford it.
Why is ZEUS Income Growth the favorite portfolio I’ve ever built? Because it’s the best hedge fund I’ve ever seen. And it works for so many kinds of investors.
History’s Best Hedging Strategy: Bonds + Managed Futures
| Bear Market | Managed Futures | Bonds | 50/50 Bonds Managed Futures | S&P |
| 2022 Stagflation | 17% | -13% | 2% | -28% |
| Pandemic Crash | 0% | -0.5% | 0% | -34% |
| 2018 | 6% | 2% | 4% | -21% |
| 2011 | -7% | 5% | -1% | -22% |
| Great Recession | 14% | 7% | 11% | -58% |
| Tech Crash | 29% | 9% | 19% | -50% |
| 1998 Bear Market | NA | 1% | 1% | -22% |
| 1990 Recession | 21% | 1% | 11% | -20% |
| 1987 Flash Crash | 57% | -3% | 27% | -30% |
| 1980 to 1983 Stagflation Period | 195% | NA | 195% | 51% |
| Average | 37% | 1% | 19% | -23% |
(Sources: Barclays, DBMF, Charlie Bilello, Soc Gen, Portfolio Visualizer Premium)
In fact, in 42 years, there hasn’t been a single bear market where combining bonds and managed futures wasn’t flat or went up while stocks averaged a 23% decline.
- long bonds did even better, with an average positive gain of closer to 25%
In other words, imagine having 33% of your portfolio go up 20% to 25%, the mirror image of the market’s decline.
Better yet? Bonds + managed futures historically deliver 4.5% annual returns, or 1.5% after inflation, which is 2X the historical real return of cash.
Or, to put it another way, cash stays flat in a bear market and earns 0.8% after inflation over time.
Bonds + managed futures = up 20% in a bear market and earn about 1.5% after inflation.
And the bonds and managed futures we recommend? Up 25% in bear markets, and they earn 6% to 7% returns (about 2% to 3% after inflation) or 3X more than cash.
This is why we use long bonds and managed futures for the 33% hedging bucket in ZEUS because this is the best hedging strategy in history, both in terms of effectiveness and long-term returns.
ZEUS Income Growth Vs. 60/40
| Metric | 60/40 | ZEUS Income Growth | X Better Than 60/40 |
| Yield | 2.1% | 4.1% | 1.95 |
| Growth Consensus | 5.1% | 8.3% | 1.63 |
| LT Consensus Total Return Potential | 7.2% | 12.4% | 1.72 |
| Risk-Adjusted Expected Return | 5.0% | 8.7% | 1.72 |
| Safe Withdrawal Rate (Risk And Inflation-Adjusted Expected Returns) | 2.8% | 6.4% | 2.31 |
| Conservative Time To Double (Years) | 26.0 | 11.2 | 2.31 |
(Source: DK Research Terminal, FactSet)
Fundamentals are far superior to a 60/40 and are even better than the S&P 500.
ZEUS Income Growth Vs. S&P 500
| Metric | S&P | ZEUS Income Growth | X Better Than S&P 500 |
| Yield | 1.7% | 4.1% | 2.41 |
| Growth Consensus | 8.5% | 8.3% | 0.98 |
| LT Consensus Total Return Potential | 10.2% | 12.4% | 1.22 |
| Risk-Adjusted Expected Return | 7.1% | 8.7% | 1.22 |
| Safe Withdrawal Rate (Risk And Inflation-Adjusted Expected Returns) | 4.9% | 6.4% | 1.32 |
| Conservative Time To Double (Years) | 14.8 | 11.2 | 1.32 |
(Source: DK Research Terminal, FactSet)
Heck, these fundamentals are superior to even the Nasdaq!
ZEUS Income Growth Vs. Nasdaq
| Metric | Nasdaq | ZEUS Income Growth | X Better Than S&P 500 |
| Yield | 0.8% | 4.1% | 5.13 |
| Growth Consensus | 10.9% | 8.3% | 0.76 |
| LT Consensus Total Return Potential | 11.7% | 12.4% | 1.06 |
| Risk-Adjusted Expected Return | 8.2% | 8.7% | 1.06 |
| Safe Withdrawal Rate (Risk And Inflation-Adjusted Expected Returns) | 5.9% | 6.4% | 1.08 |
| Conservative Time To Double (Years) | 12.2 | 11.2 | 1.08 |
(Source: DK Research Terminal, FactSet)
And it beats just about every hedge fund I’ve tested it against.
So let’s see how ZEUS Income Growth performed against some of the best fund managers in history.
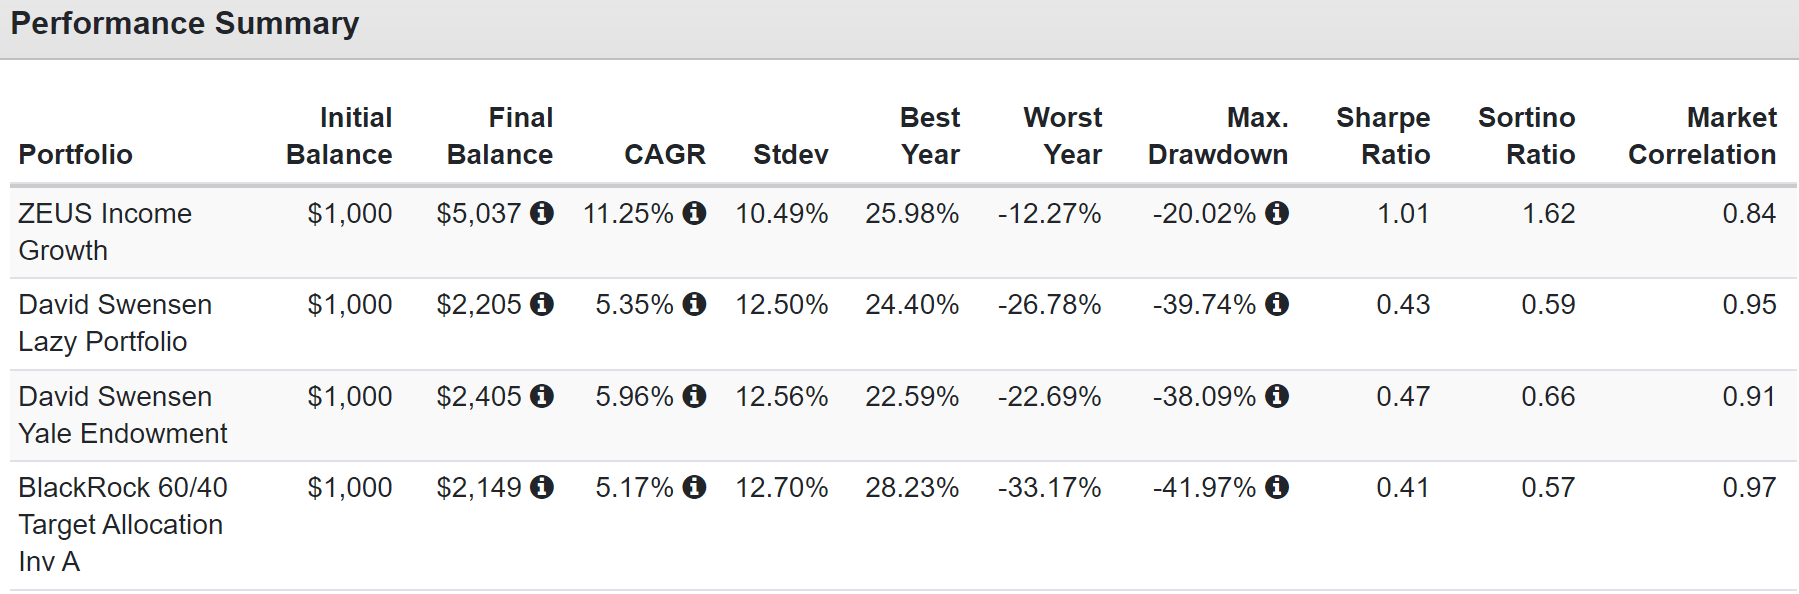
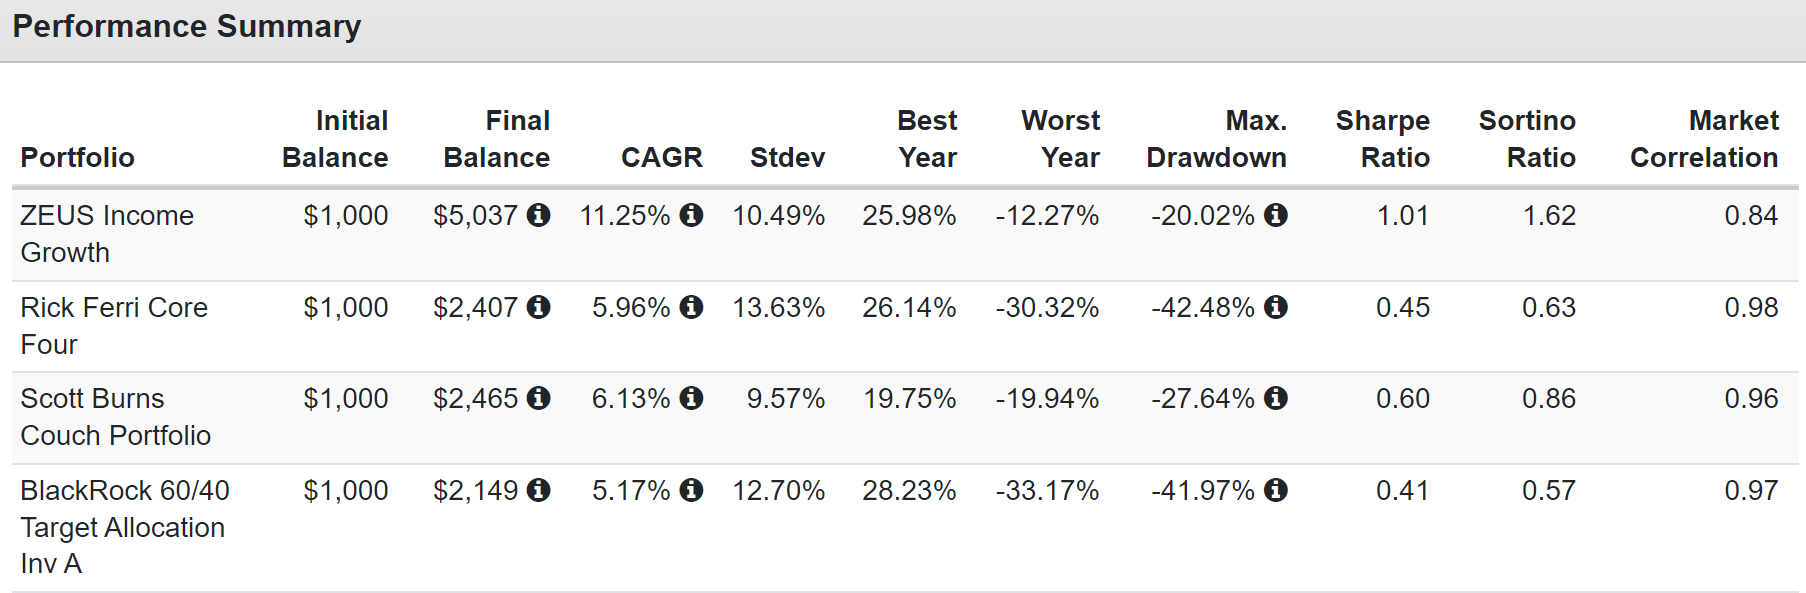
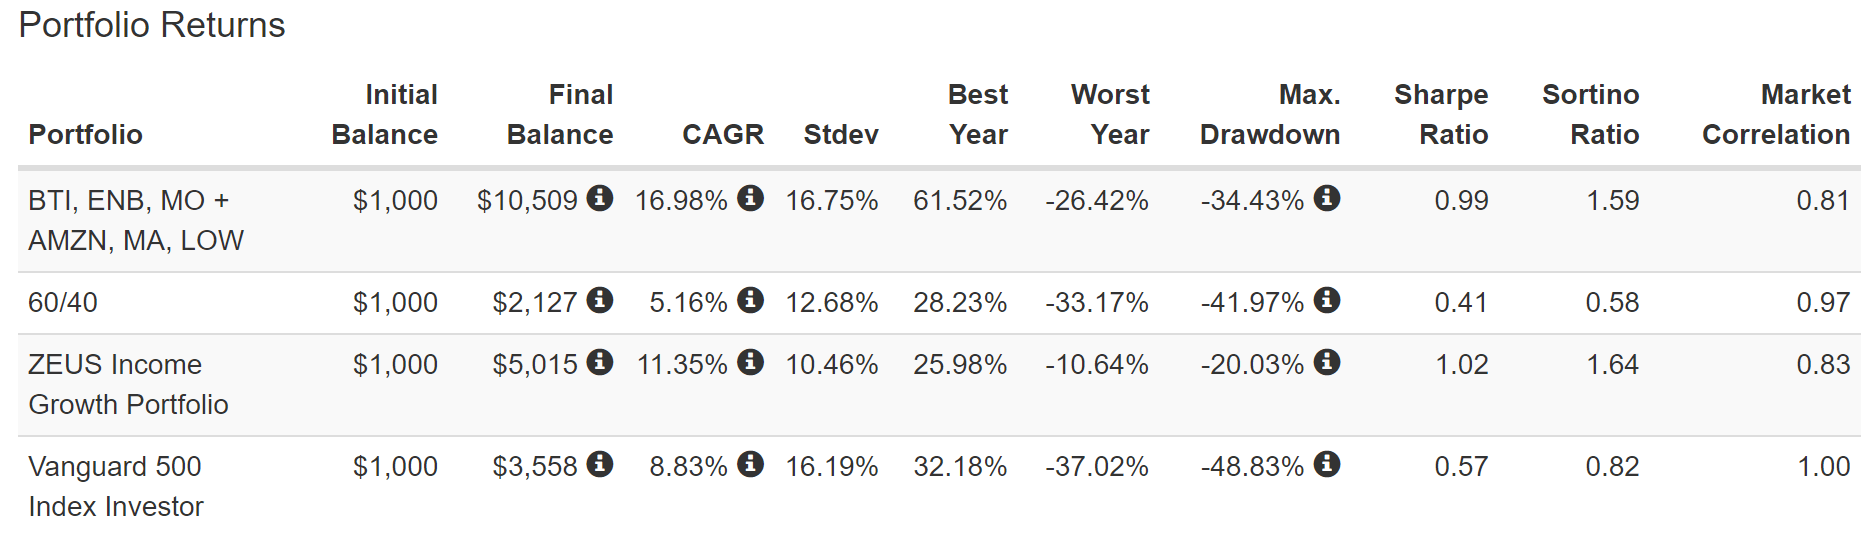
Historical Returns Since December 2007 (Start Of The Great Recession)
Portfolio Visualizer Premium
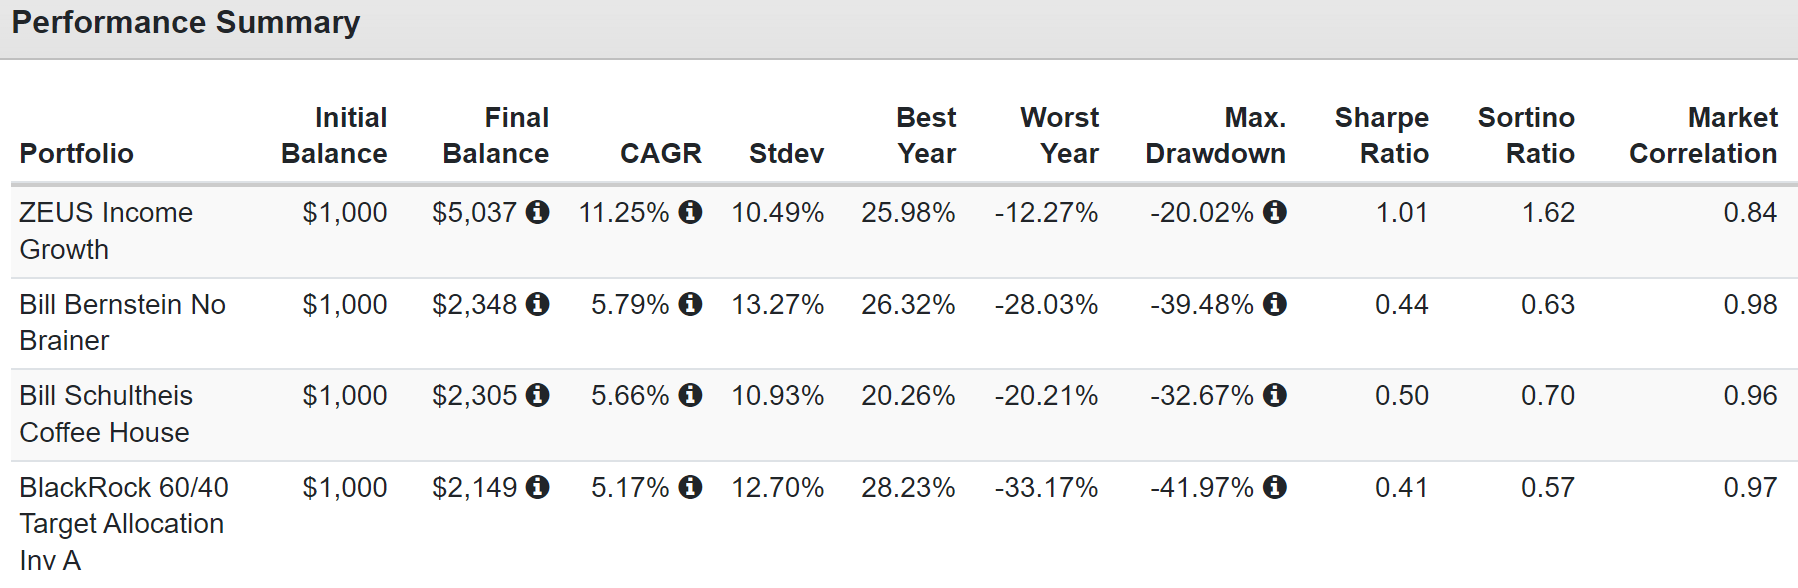
ZEUS offers 2X the returns of these famous hedge funds but with lower annual volatility, much smaller peak declines in the Great Recession, and 2X to 3X better negative-volatility-adjusted returns (Sortino ratio).
That should be no surprise since the ratio of 67% stocks and 33% hedging assets has been the Sortino-optimized asset allocation for the last 50 years.
- according to Nick Maggiulli
- Chief Data Scientist for Ritholtz Wealth Management
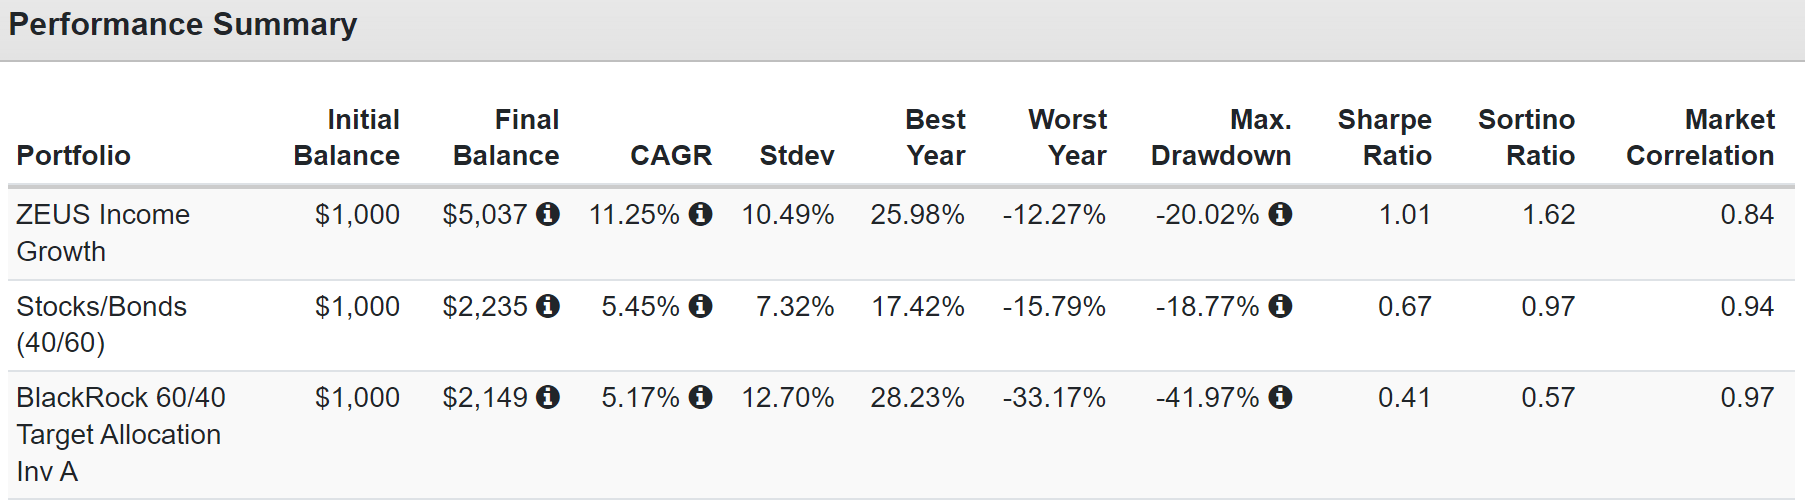
Historical Returns Since December 2007 (Start Of The Great Recession)
Portfolio Visualizer Premium
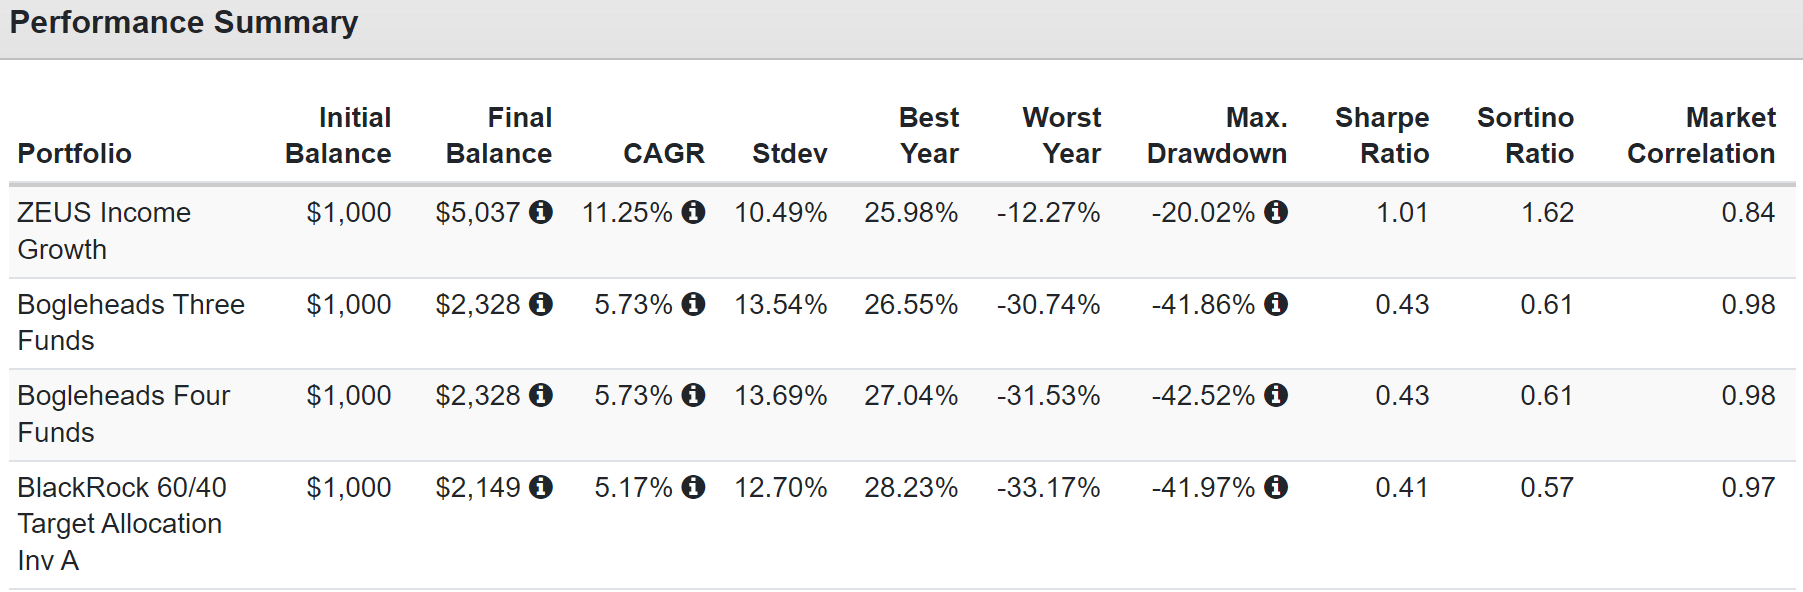
What about Vanguard’s super simple approach to pure ETFs? ZEUS delivers 2X the returns and one-half smaller peak declines in the Great Recession and 2.5X to 3X the negative-volatility-adjusted returns.
Historical Returns Since December 2007 (Start Of The Great Recession)
Portfolio Visualizer Premium
How would you like to beat one of the best hedge fund managers in history? With lower volatility? ZEUS did it.
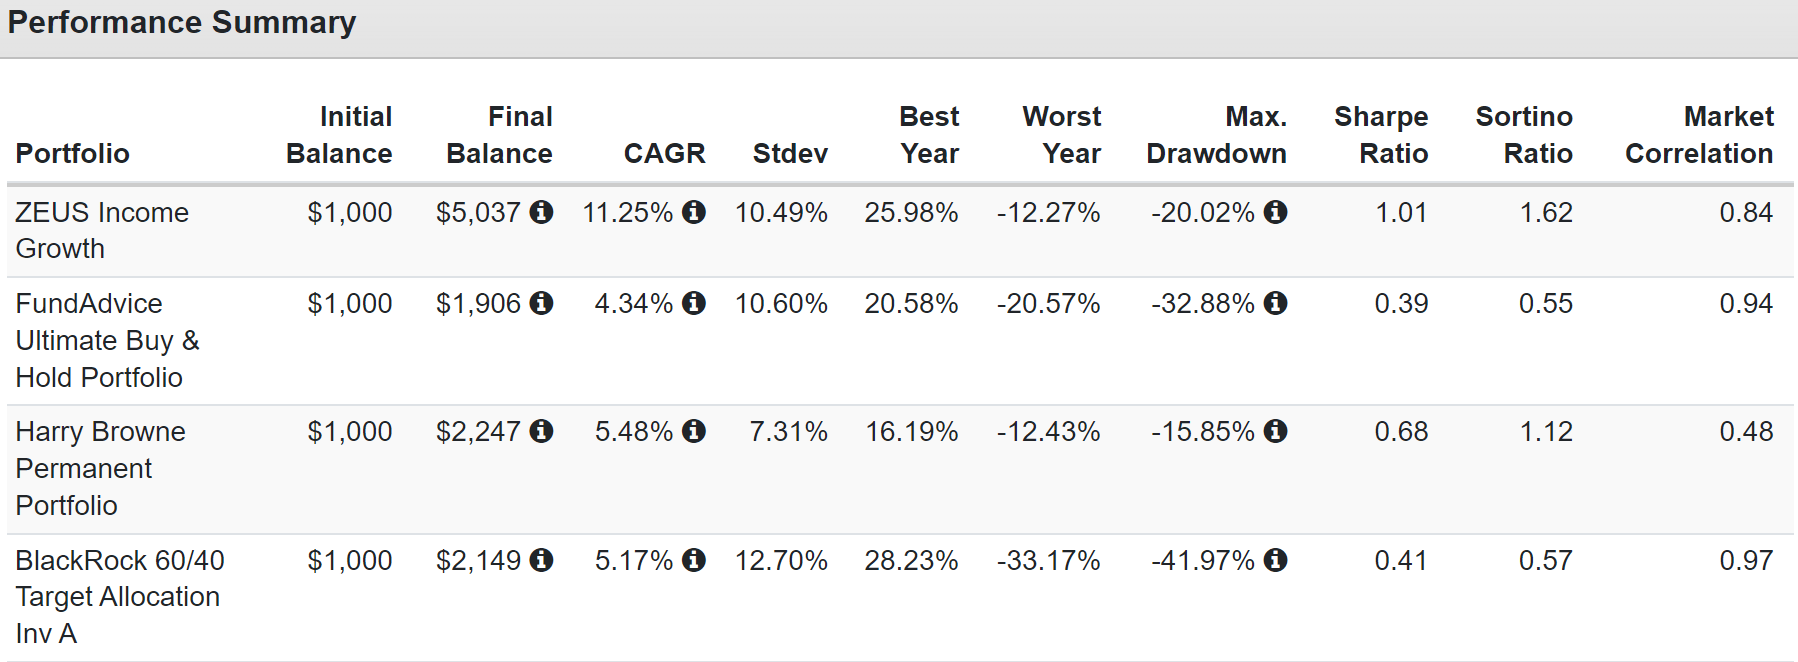
Historical Returns Since December 2007 (Start Of The Great Recession)
Portfolio Visualizer Premium
Harry Brown’s portfolio managed lower volatility, but ZEUS still delivered 50% better negative volatility-adjusted returns.
Historical Returns Since December 2007 (Start Of The Great Recession)
Portfolio Visualizer Premium
Hedge fund manager Larry Swedroe can’t hold a candle to ZEUS other than his fat tail portfolio generating 7% annual volatility but with just 1% annual real returns.
- slightly better than a 100% T-bill portfolio (which had 6X lower annual volatility)
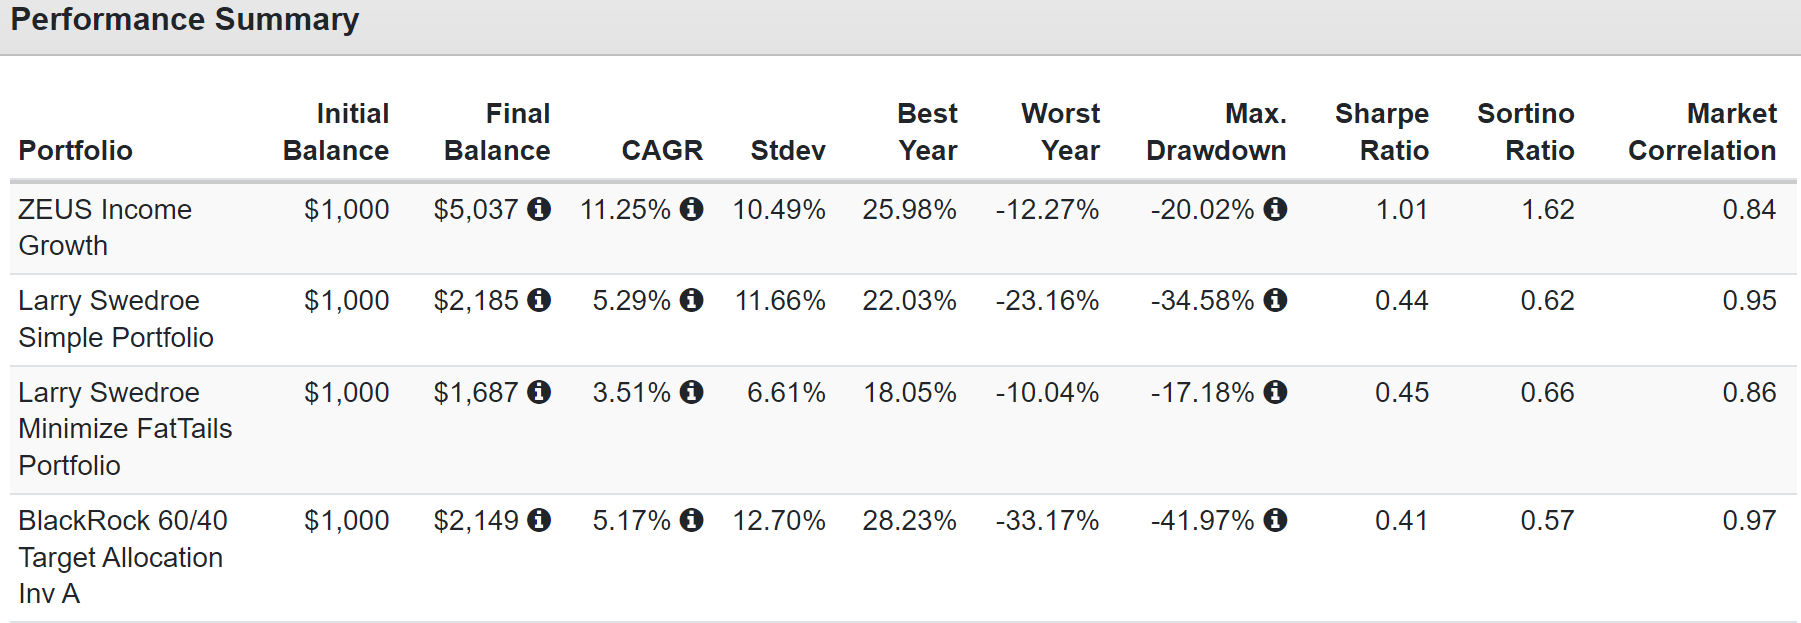
Historical Returns Since December 2007 (Start Of The Great Recession)
Portfolio Visualizer Premium
Twice the returns of Ray Dalio, the hedge fund king, and 63% better negative-volatility-adjusted returns.
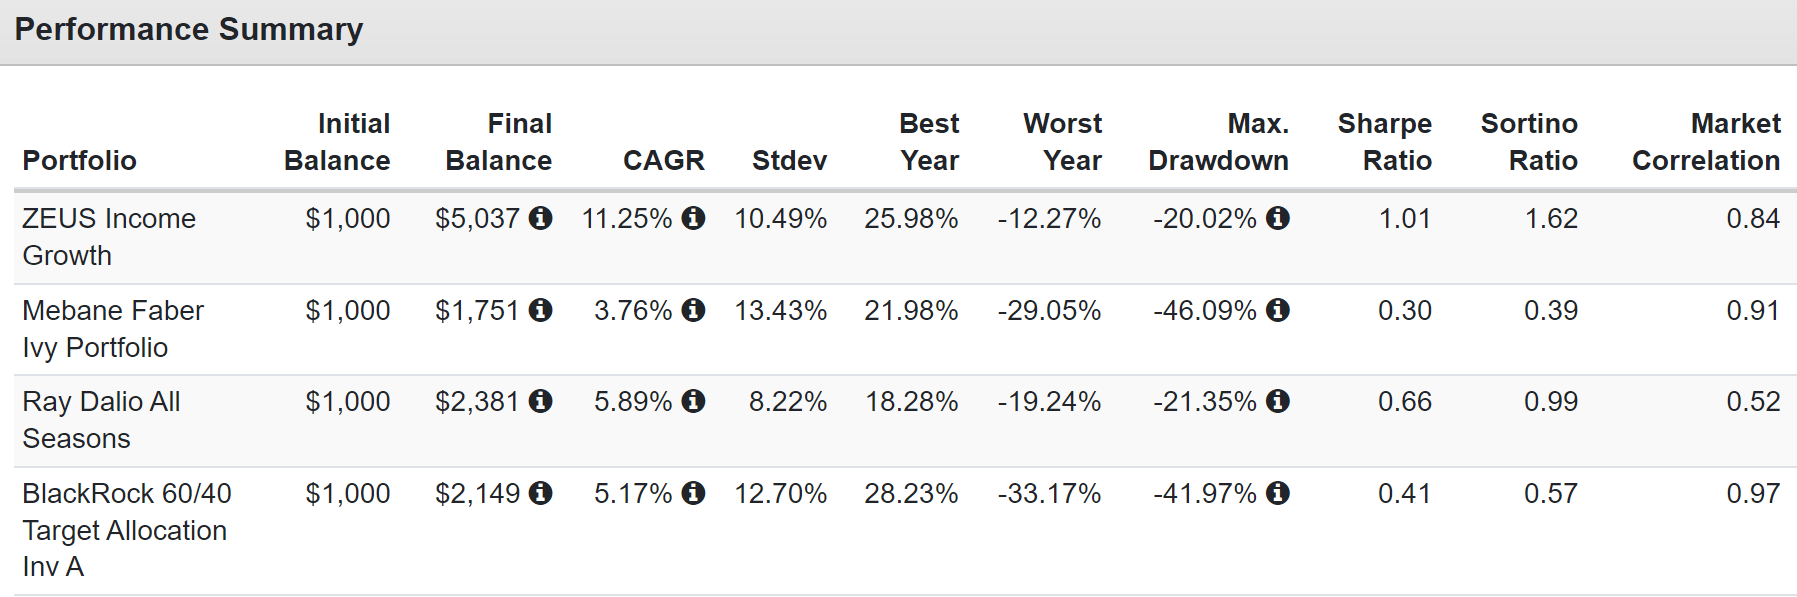
Historical Returns Since December 2007 (Start Of The Great Recession)
Portfolio Visualizer Premium
Yet again, 2X the returns, lower declines in the GFC, and much better negative-volatility-adjusted returns.
Historical Returns Since December 2007 (Start Of The Great Recession)
Portfolio Visualizer Premium
15 hedge fund challengers and ZEUS vanquished them all.
ZEUS Income Growth Vs. Market During Bear Markets
| Bear Market | ZEUS Income Growth | 60/40 | S&P | Nasdaq |
| 2022 Stagflation | -14% | -21% | -28% | -35% |
| Pandemic Crash | -9% | -13% | -34% | -13% |
| 2018 | -10% | -9% | -21% | -17% |
| 2011 | 4% | -16% | -22% | -11% |
| Great Recession | -20% | -44% | -58% | -59% |
| Average | -10% | -21% | -33% | -27% |
| Average Decline vs. Benchmark | NA | 48% | 30% | 36% |
(Source: Portfolio Visualizer Premium)
Show me a hedge fund that can deliver market-like long-term returns with an average peak decline of just 10% in bear markets. That’s 70% less than the S&P and 64% less than the Nasdaq. Heck, it’s 52% less than a 60/40!
- like riding over the market’s deepest potholes in a Rolls Royce
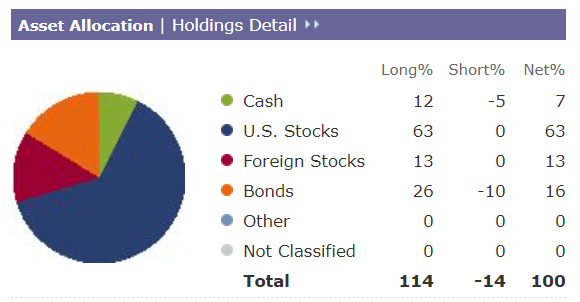
What my family’s ZEUS jackpot portfolio would look like.
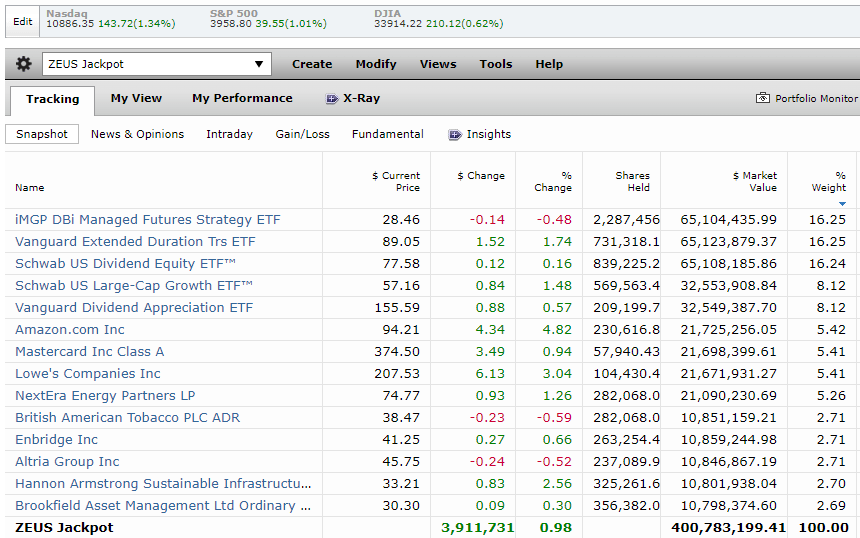
Morningstar
I would invest all the money immediately.
Why?
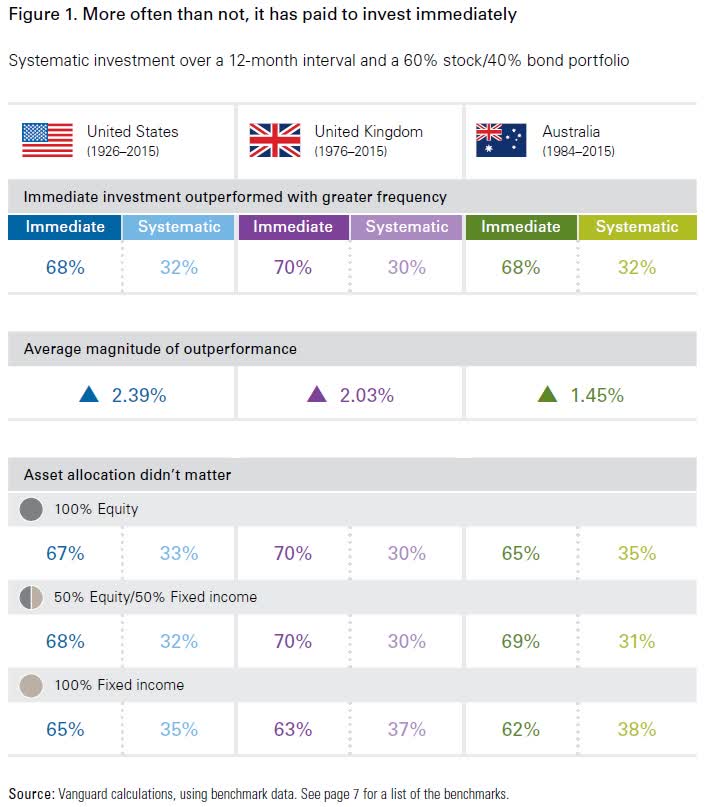
Vanguard
Because even outside of bear markets, investing right away is the optimal strategy. In a bear market, it’s optimal 85% to 100% of the time, depending on the severity of the market decline.
This is the best portfolio I’ve ever designed, and let me show you why.
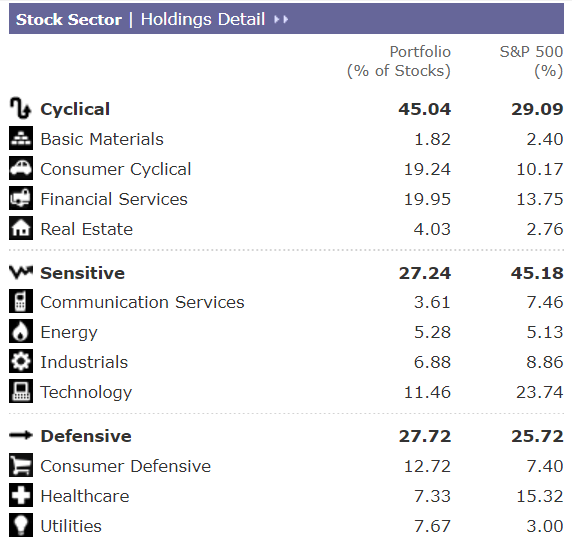
ZEUS Jackpot Portfolio Fundamentals
Morningstar
Diversified by asset class and stock investing style.
- 33% growth
- 33% value
- 33% core
Perfect balance for whatever happens in the US economy, both in 2023 and beyond.
Morningstar
Exposure to every part of not just the US economy but the global economy.
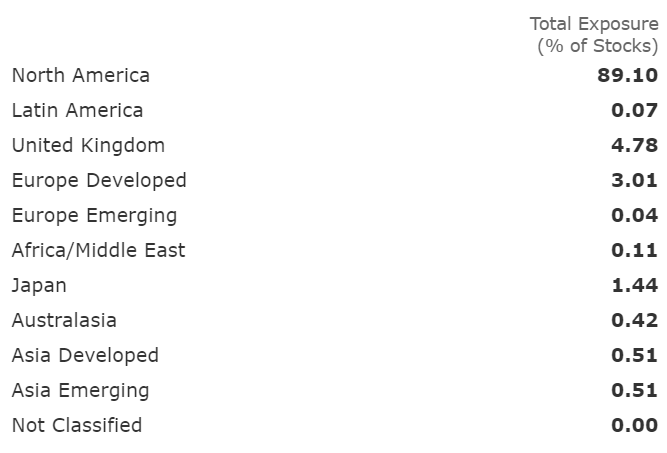
Morningstar
World-beater income growth at a reasonable price, and Morningstar’s analysts are even more bullish than FactSet’s, expecting 14% long-term returns.
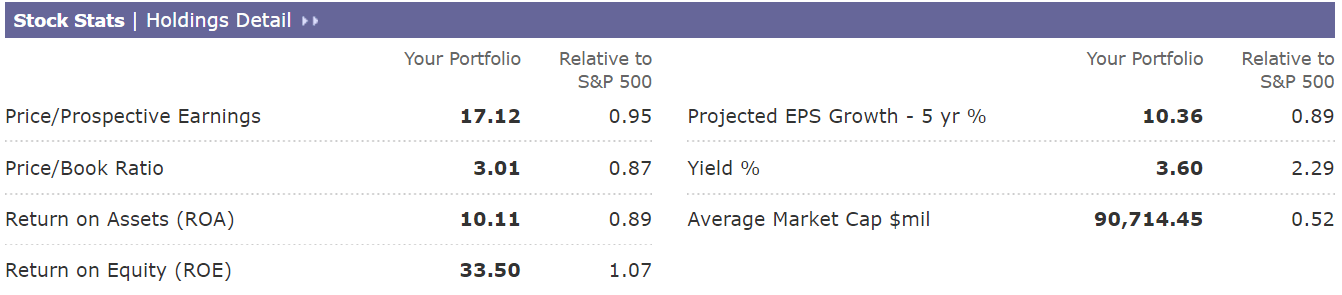
Morningstar
But where the true value lies in the low expenses of this hedge fund. The average hedge fund charges 5% annual fees.
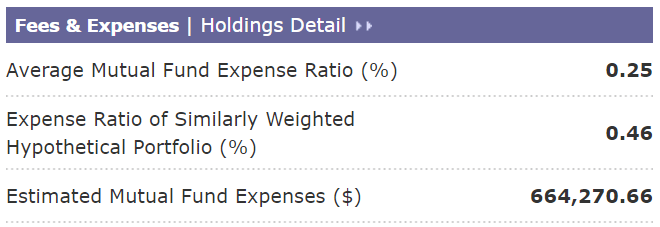
Morningstar
Hedge fund beating returns with far lower peak declines in even the most extreme market crashes and 20X cheaper than the average hedge fund.
And as for diversification?
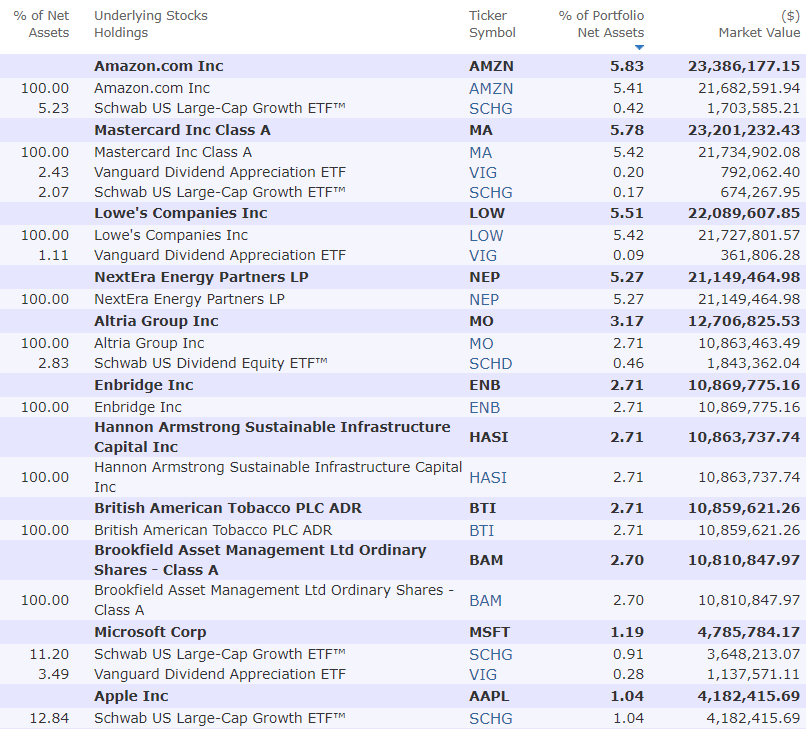
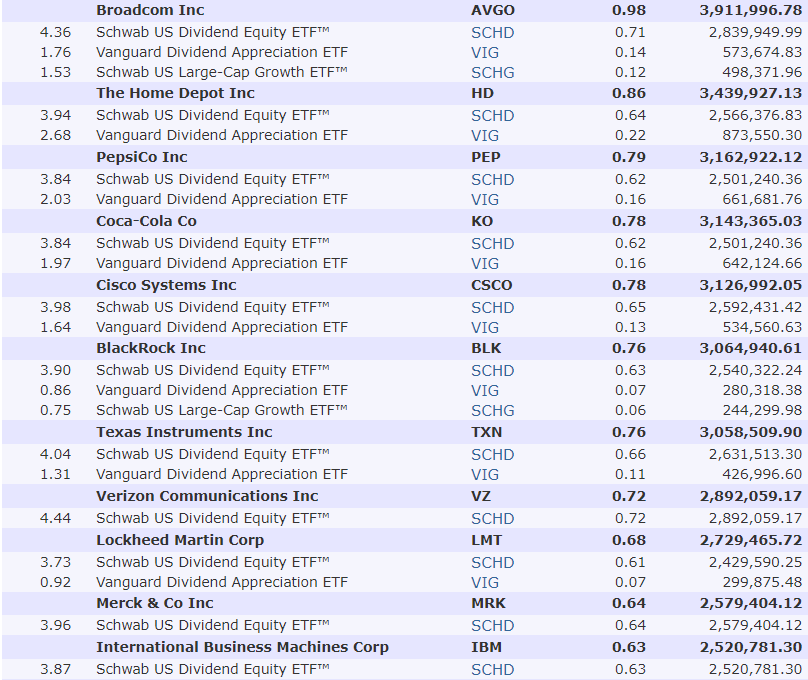
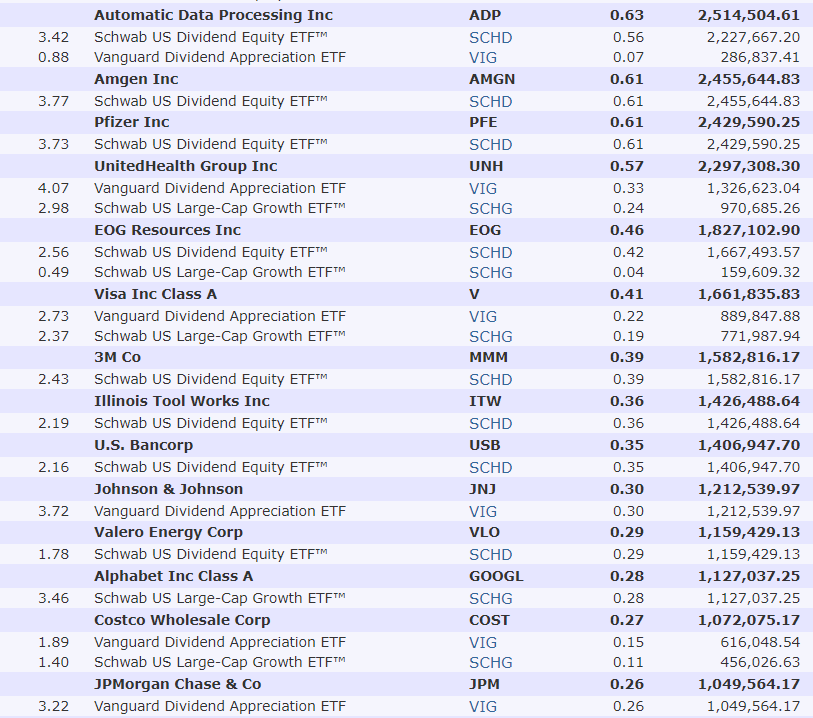
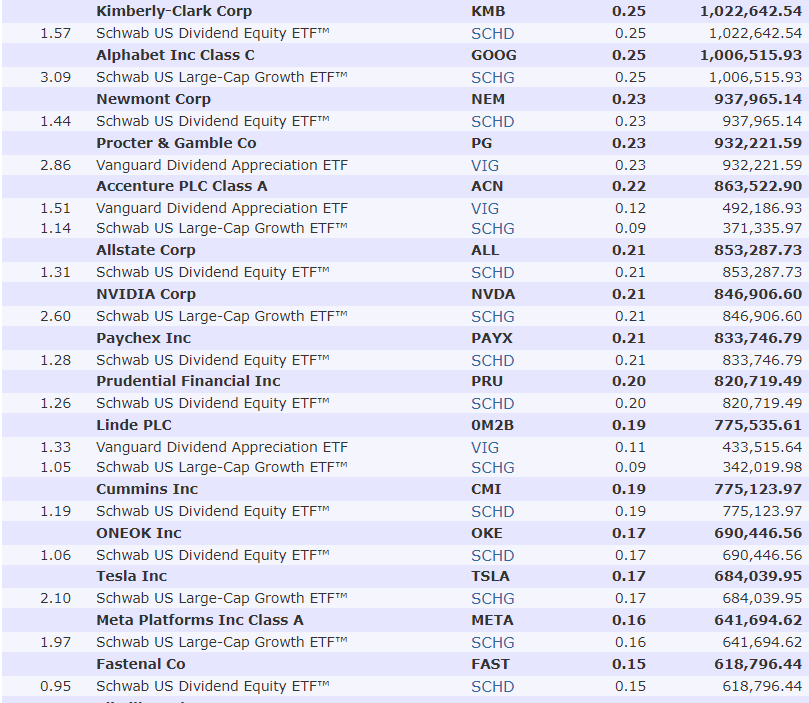
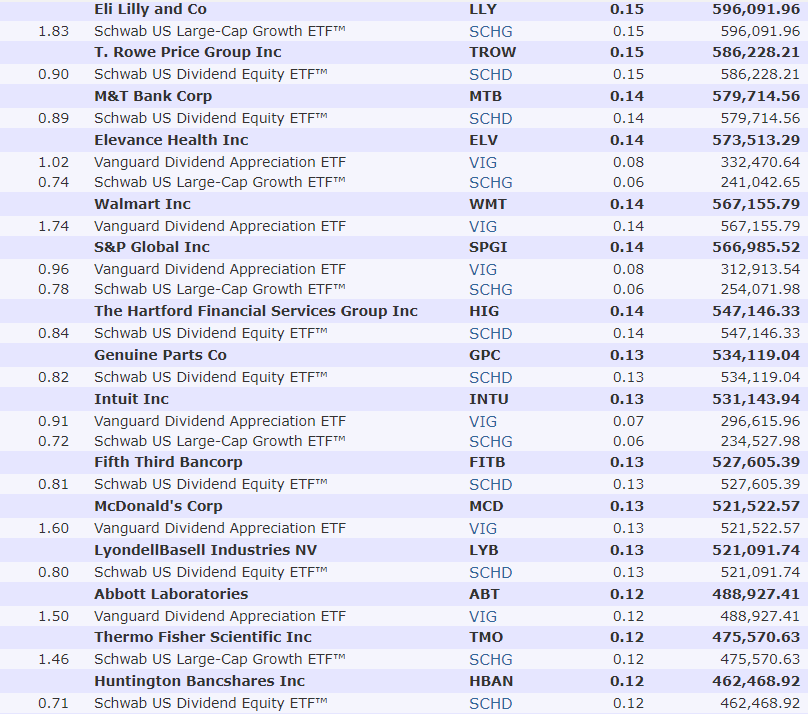
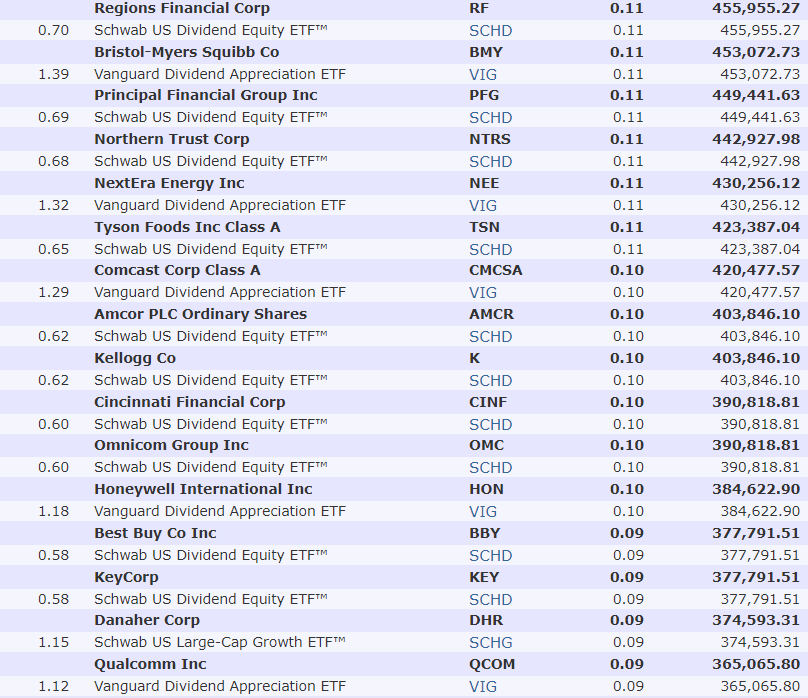
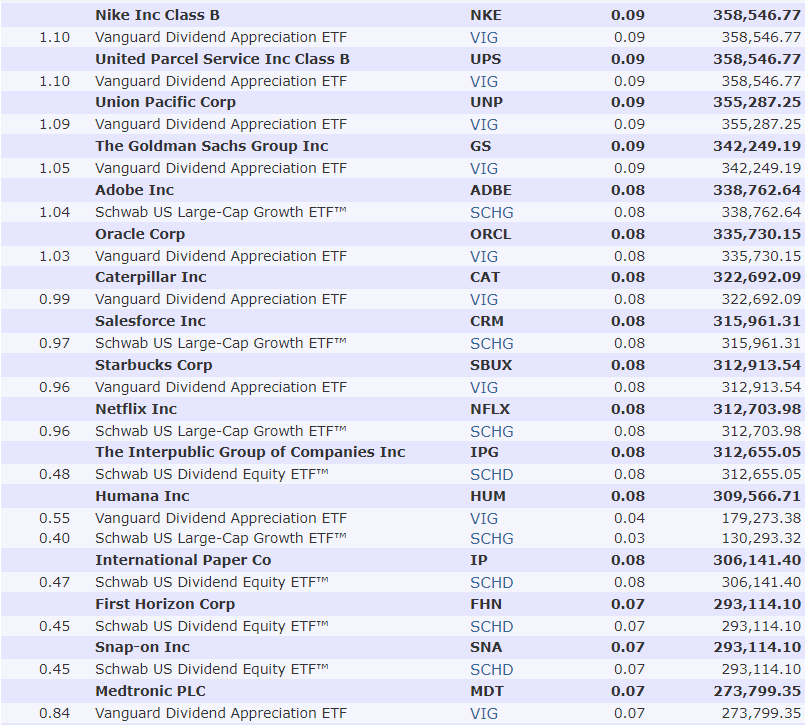
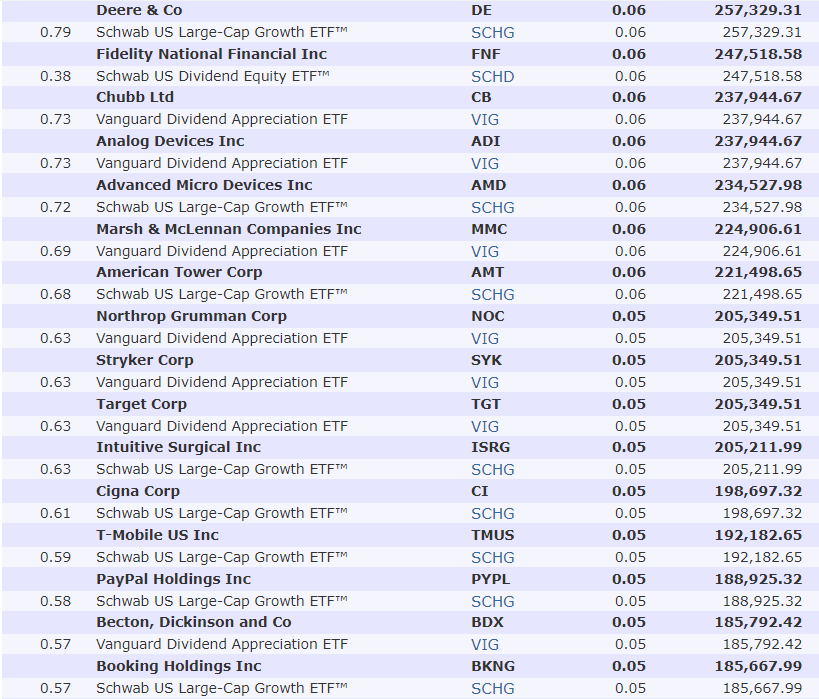
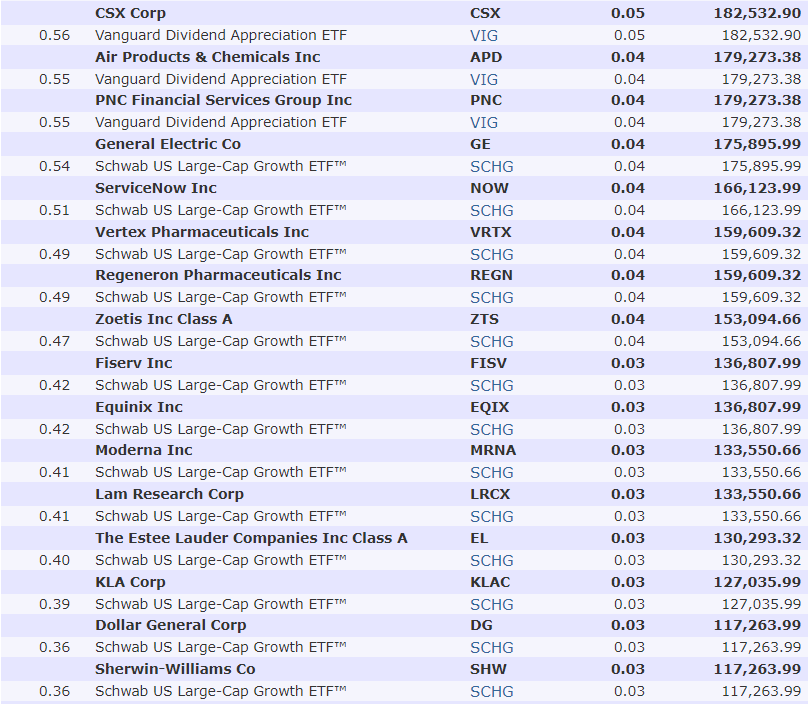
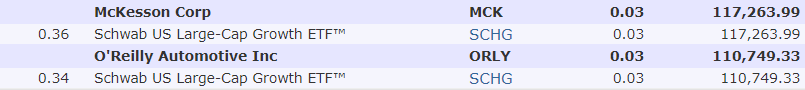
578 Of The World’s Best Companies Working Hard For My Family
My family would own 14 stocks that take five minutes per year to rebalance via spreadsheet. But our fortune would be in the hands of 578 of the world’s best companies, who count every human on earth as a customer.
Morningstar
Morningstar
Morningstar
Morningstar
Morningstar
Morningstar
Morningstar
Morningstar
Morningstar
Morningstar
So what would such a jackpot hedge fund mean for my family in the future?
Inflation-Adjusted Consensus Total Return Potential: $390 Million Initial Investment
| Time Frame (Years) | 4.8% CAGR Inflation-Adjusted 60/40 | 10.1% Inflation-Adjusted ZEUS Income Growth | Difference Between ZEUS Income Growth Consensus and 60/40 Consensus |
| 5 | $493,027,359.58 | $632,106,080.12 | $139,078,720.54 |
| 10 | $623,271,736.66 | $1,024,507,939.81 | $401,236,203.15 |
| 15 | $787,923,124.70 | $1,660,506,917.66 | $872,583,792.96 |
| 20 | $996,070,917.24 | $2,691,324,407.01 | $1,695,253,489.77 |
| 25 | $1,259,205,677.66 | $4,362,057,746.80 | $3,102,852,069.14 |
| 30 (retirement time frame) | $1,591,853,462.64 | $7,069,956,983.57 | $5,478,103,520.92 |
| 35 | $2,012,377,716.75 | $11,458,878,962.84 | $9,446,501,246.09 |
| 40 | $2,543,993,005.58 | $18,572,377,086.63 | $16,028,384,081.05 |
| 45 | $3,216,046,549.60 | $30,101,826,868.62 | $26,885,780,319.02 |
| 50 | $4,065,638,304.23 | $48,788,584,067.71 | $44,722,945,763.48 |
| 55 | $5,139,669,020.93 | $79,075,796,486.42 | $73,936,127,465.49 |
| 60 (investing lifetime) | $6,497,429,350.07 | $128,164,850,639.71 | $121,667,421,289.64 |
| 100 (perpetual charitable trust, institutional time frame) | $42,383,114,925.23 | $6,103,399,834,184.45 | $6,061,016,719,259.22 |
(Source: DK Research Terminal, FactSet)
For someone who wants to eliminate extreme global poverty by beating Andrew Carnegie’s record for charitable giving, you can see why this is an appealing portfolio.
- Carnegie donated $438.5 billion in today’s dollars
While this jackpot wouldn’t make me a billionaire overnight, I’d get there in 10 years and eventually be able to donate hundreds of billions if I lived long enough trillions.
- donate thousands, and you can make a difference to a few
- donate millions, and you can change a lot of people’s lives
- donate billions, and you can change the world
- donate trillions over time, and you can change everything
OK, so this is a very impressive portfolio that beats every hedge fund in Portfolio Visualizer’s database. But what evidence is there that ZEUS Income Growth can actually deliver 12% to 13% long-term returns?
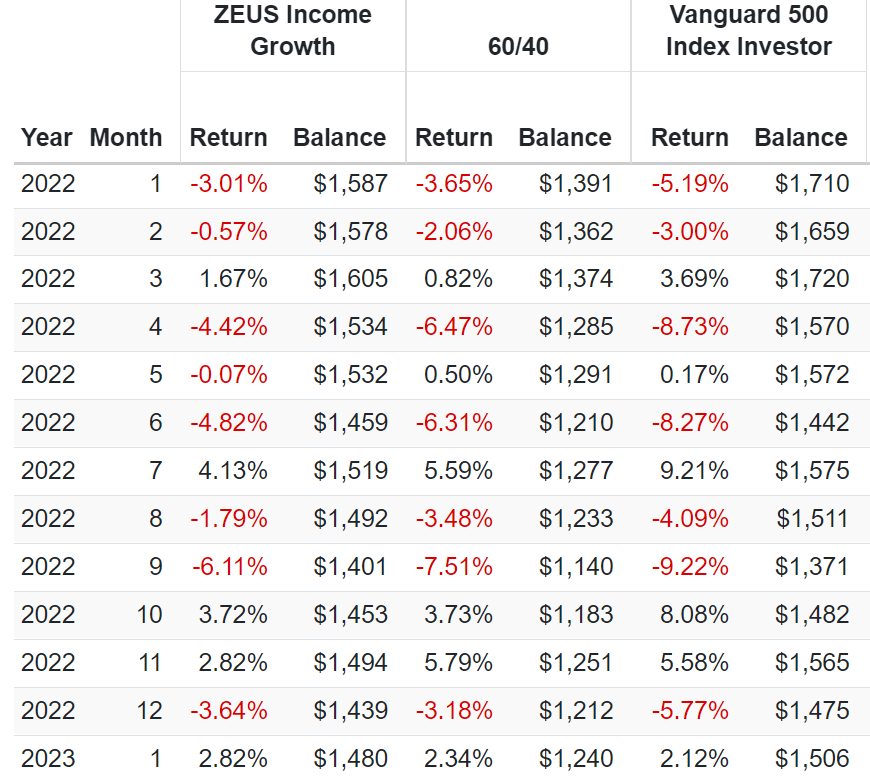
Historical Returns Since December 2007 (Start Of The Great Recession)
The future doesn’t repeat, but it often rhymes. – Mark Twain
Remember, “past performance is no guarantee of future results.”
But studies show that blue chips with relatively stable fundamentals offer predictable returns based on yield, growth and valuation mean reversion over time.
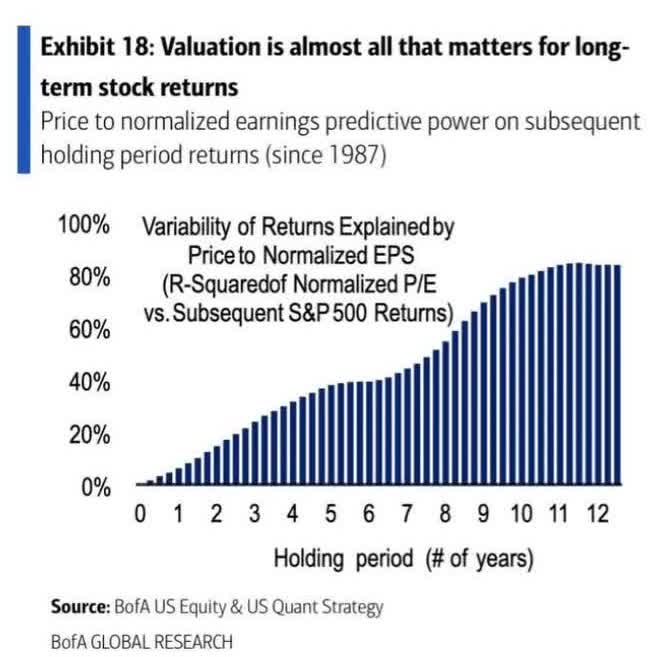
Bank of America
15 years is a period when 90% of returns are a result of fundamentals, not luck.
Portfolio Visualizer Premium
Market and 60/40 beating returns? Check. Low volatility? How, barely a bear market during the Great Recession.
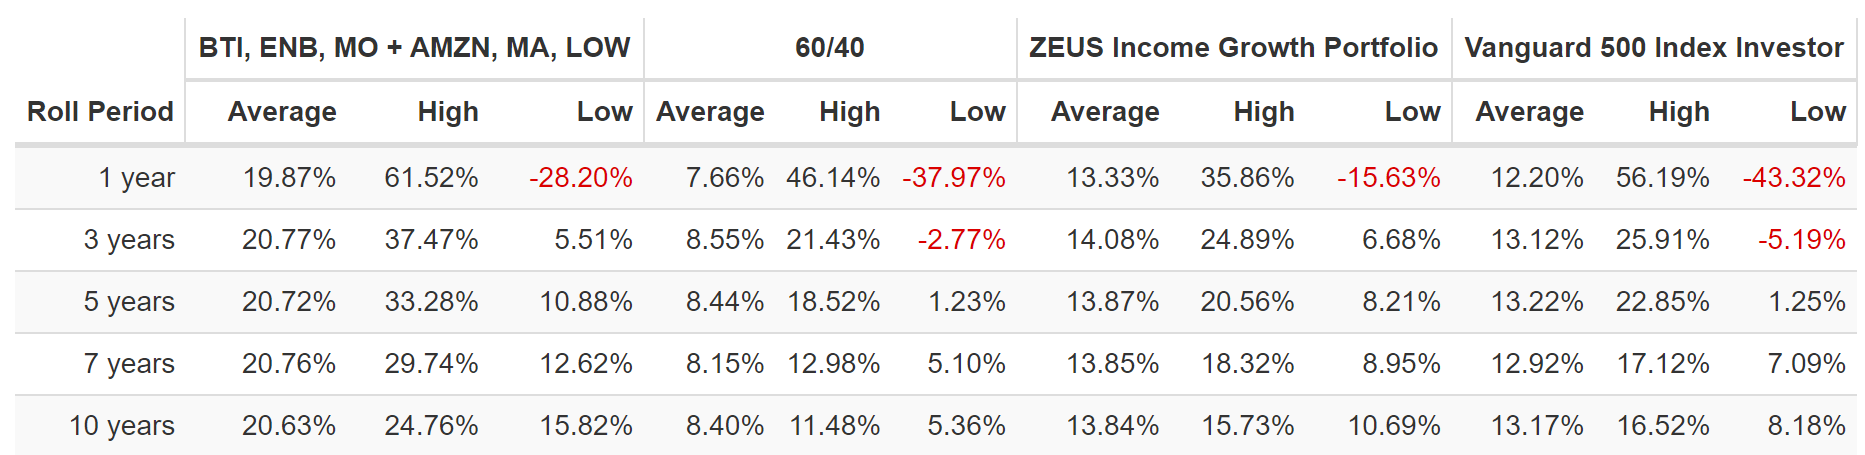
Portfolio Visualizer Premium
13% to 14% rolling returns, just like Morningstar expects in the future and similar to the 12% to 13% FactSet expects.
Portfolio Visualizer Premium
The S&P has suffered four bear markets in the last 15 years.
- historically, bear markets have occurred once every four years since WWII
- even the Fed’s QE doesn’t prevent bear markets
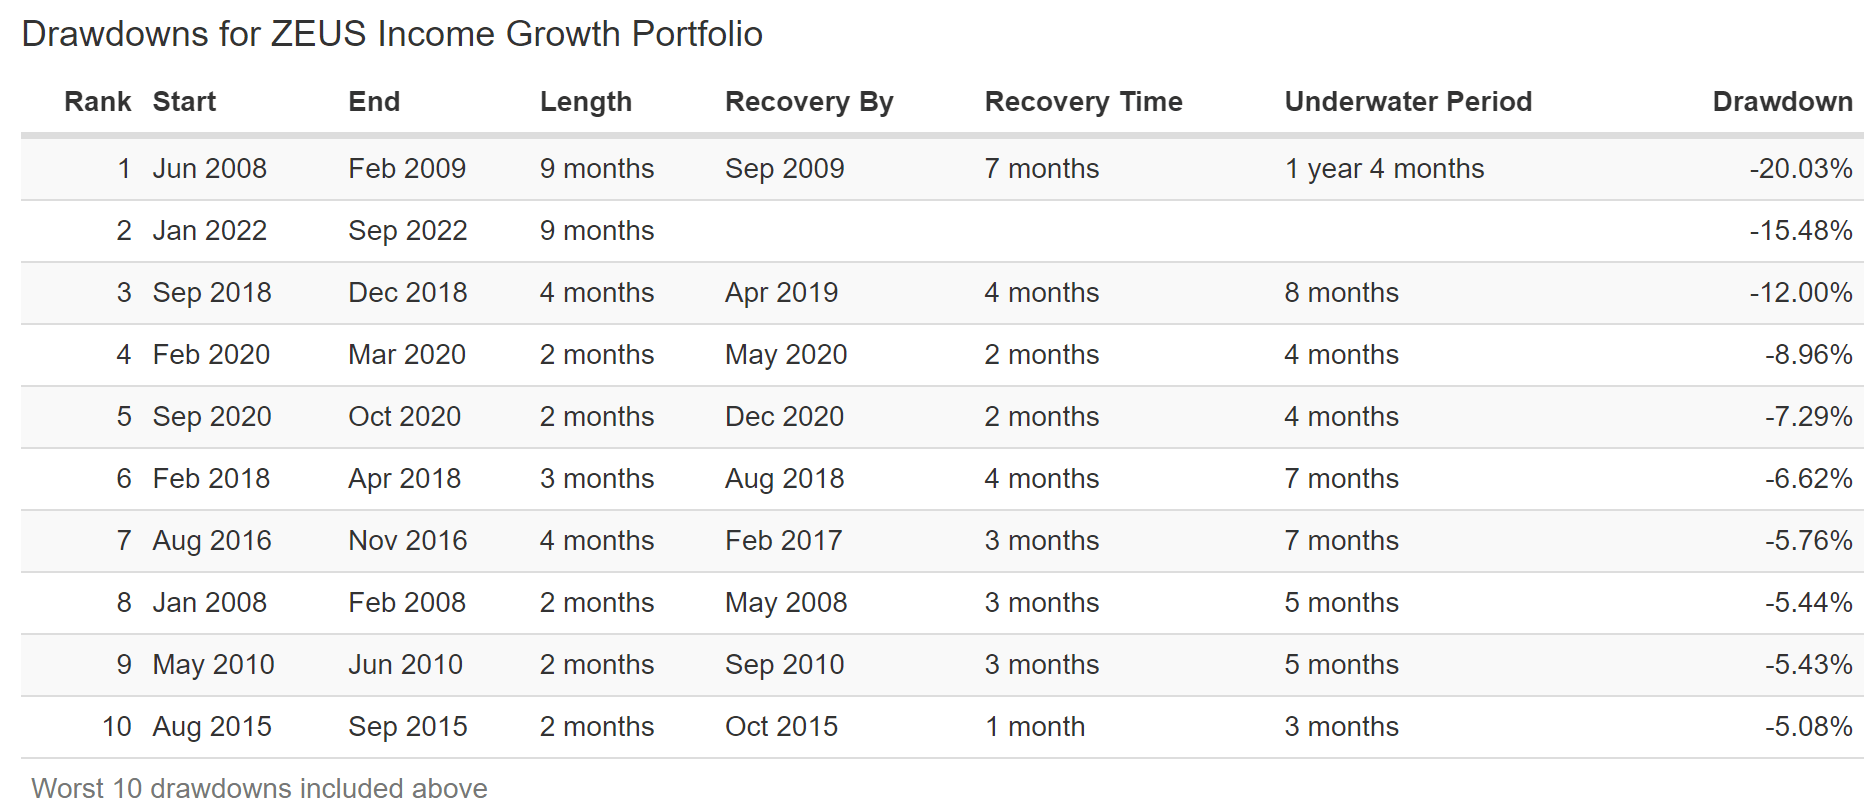
ZEUS Income Growth had just one, and it took the 2nd largest market crash in history to barely achieve a bear market for this portfolio.
It had three corrections. How many did the S&P have?
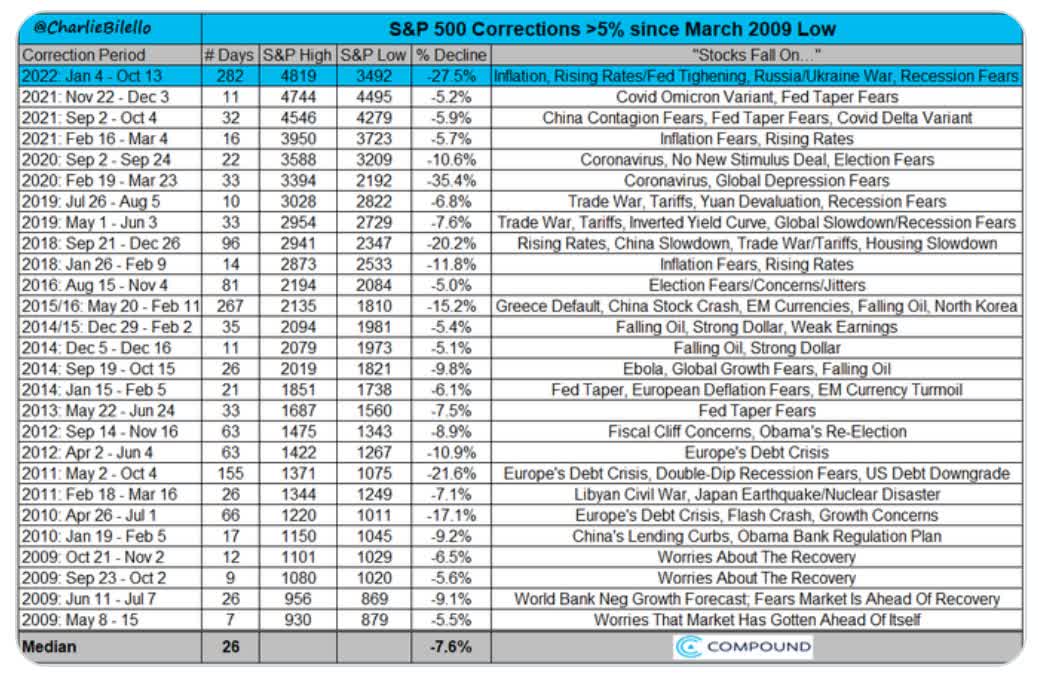
Charlie Bilello
The S&P has suffered ten corrections, four bear markets, and 27 pullbacks since the Great Recession.
ZEUS has had ten pullbacks in the last 15 years.
ZEUS Income Growth During The Great Recession
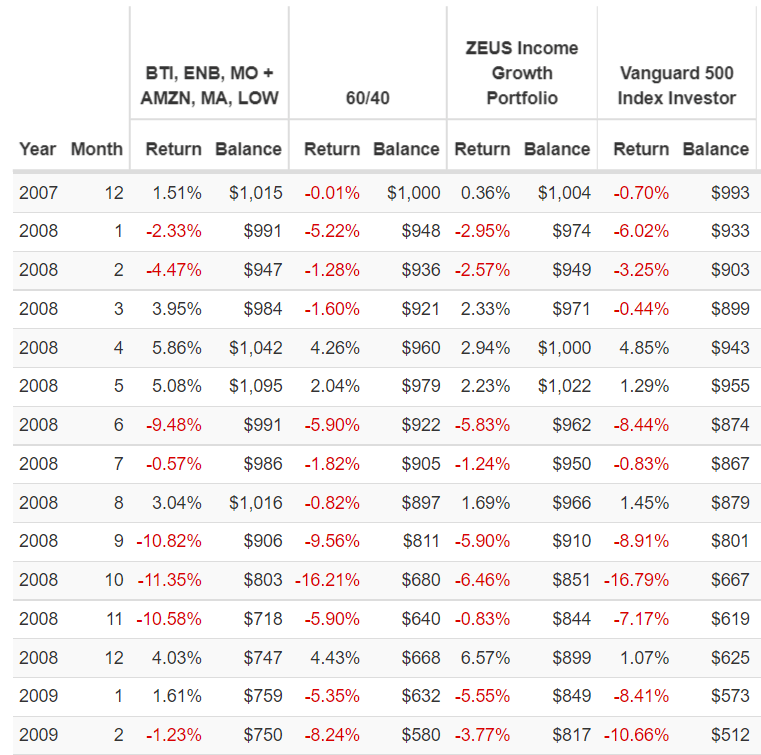
Portfolio Visualizer Premium
The peak intra-day decline for the S&P in the GFC was -58% and -44% for the 60/40.
ZEUS Income Growth fell a peak of 20% and shined during the worst months in market history:
- Fell just 4% when the market fell 11% in February 2009
- Fell just 6.5% when the market fell 17% in October 2008 and the 60/40 fell 16%
ZEUS Income Growth During The 2011 Bear Market
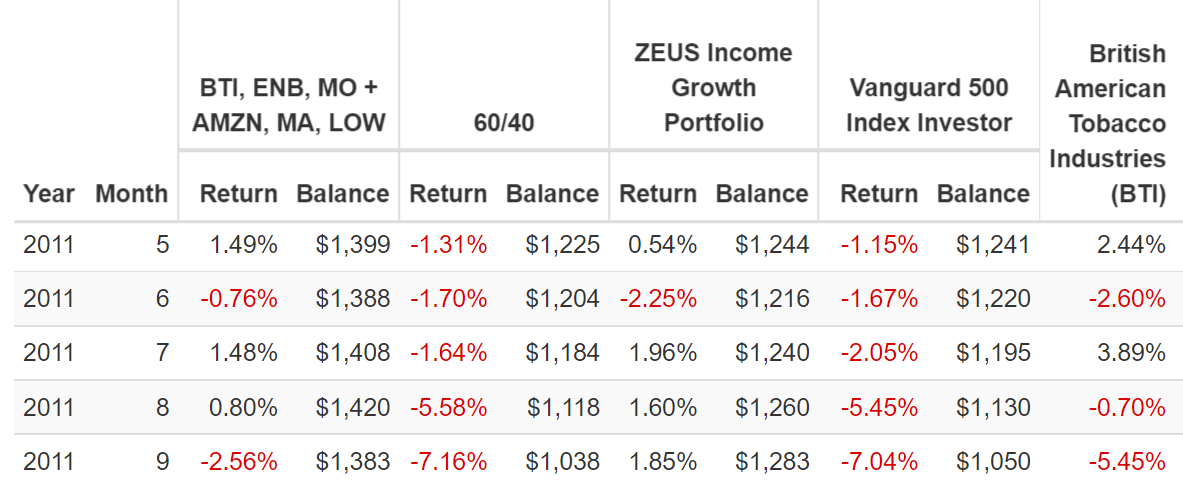
Portfolio Visualizer Premium
ZEUS actually went up 3.3% during the 2011 bear market when the S&P hit -22% intraday.
- up 2% in September 2011 when the S&P fell 7% and a 60/40 the same
- going up during a bear market is something almost no hedge fund can accomplish but ZEUS can in the right circumstances
- like riding over market potholes in a hovercraft
ZEUS Income Growth During The 2018 Bear Market
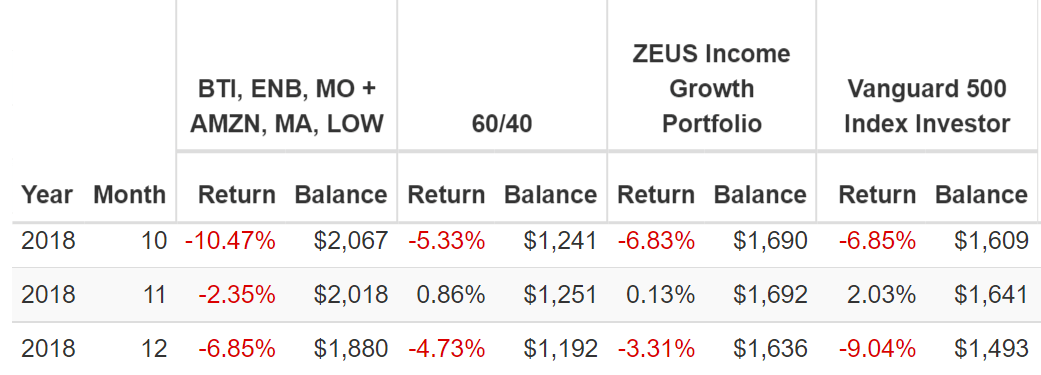
Portfolio Visualizer Premium
In late 2018 the S&P hit a peak decline of -21% while ZEUS fell just 10%.
- including a 3.3% decline in December when the market fell 9%
ZEUS Income Growth During The Pandemic Crash
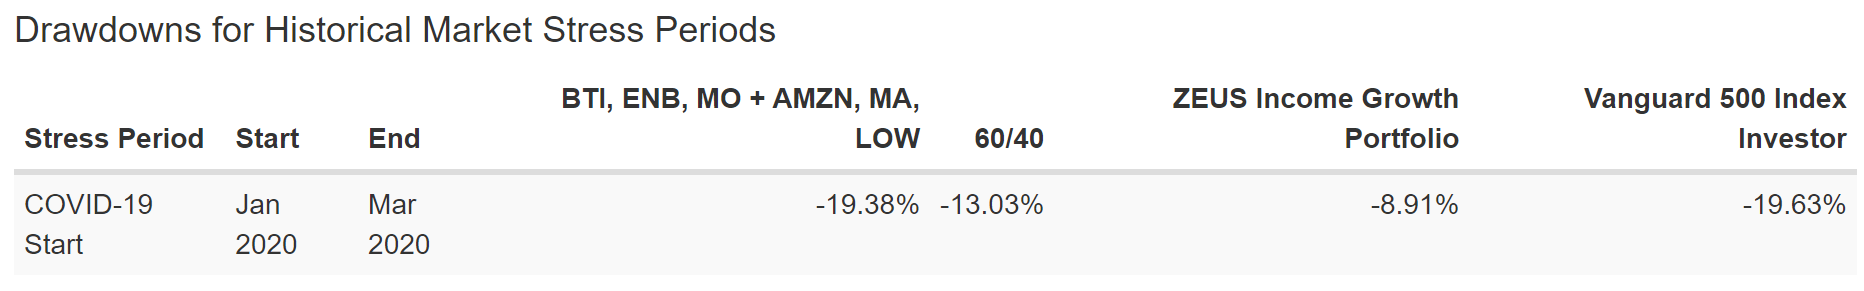
Portfolio Visualizer Premium
During the Pandemic crash (-34% peak intra-day decline on March 23rd), ZEUS didn’t even suffer a correction.
ZEUS Income Growth During The 2022 Bear Market
Portfolio Visualizer Premium
In the 2022 bear market, so far the peak decline has been 14%.
Nasdaq -35%
When the market fell 9% in September ZEUS fell 6% even though 17% of the portfolio (EDV) fell 11%.
Why? Because DMBF was hedging our hedges, and went up 6%.
- DBMF went up 11% in April 2022 when the market fell 9%, and EDV fell 13%
The ZEUS strategy is a true “forever” strategy that works in all economic and market conditions:
- recession
- stagflation
- the fastest bear market in US history
- the best market rally in US history
- economic catastrophe
- a booming economy
The Ultimate Low Volatility Ultra SWAN Growth Portfolio
| Bear Market | ZEUS Income Growth | 60/40 | S&P | Nasdaq |
| 2022 Stagflation | -14% | -21% | -28% | -35% |
| Pandemic Crash | -9% | -13% | -34% | -13% |
| 2018 | -10% | -9% | -21% | -17% |
| 2011 | 4% | -16% | -22% | -11% |
| Great Recession | -20% | -44% | -58% | -59% |
| Average | -10% | -21% | -33% | -27% |
| Average Decline vs. Benchmark | NA | 48% | 30% | 36% |
(Source: Portfolio Visualizer, Charlie Bilello, YCharts)
Truly this is a Zen Extraordinary Ultra Sleep well-at-night portfolio.
Stress Testing The Future
Every registered investment advisor, including Ritholtz Wealth Management, uses some version of Monte Carlo simulations when doing retirement planning.” – Ben Carlson
Monte Carlo Simulations are how economists also forecast their base-case economic and market forecasts.
- long-term Monte Carlo simulation use statistics and past historical returns and volatility data to run thousands of simulations about what’s likely to happen in the future
- as long as the future isn’t more extreme than the last 15 years, this is the best way to estimate the probability of likely return ranges, volatility, and the probability of achieving your investment goals.
The last 15 years have seen:
- the 2 worst Recessions since the Great Depression
- the 2nd worst market crash in history
- the fastest bear market in history
- the strongest 12-month rally-month history (70%)
- inflation ranging from -3% to 9%
- 10-year treasury bond yields ranging from 0.5% to 6%
- Fed funds rate from 0% to 4.25%
Unless you think the future will be more extreme than this, a 10,000 75-year Monte Carlo simulation is statistically the best way to forecast the likely future.
- a 75-year time horizon provides more extreme ranges of potential outcomes
- the ultimate stress test for a “forever portfolio.”
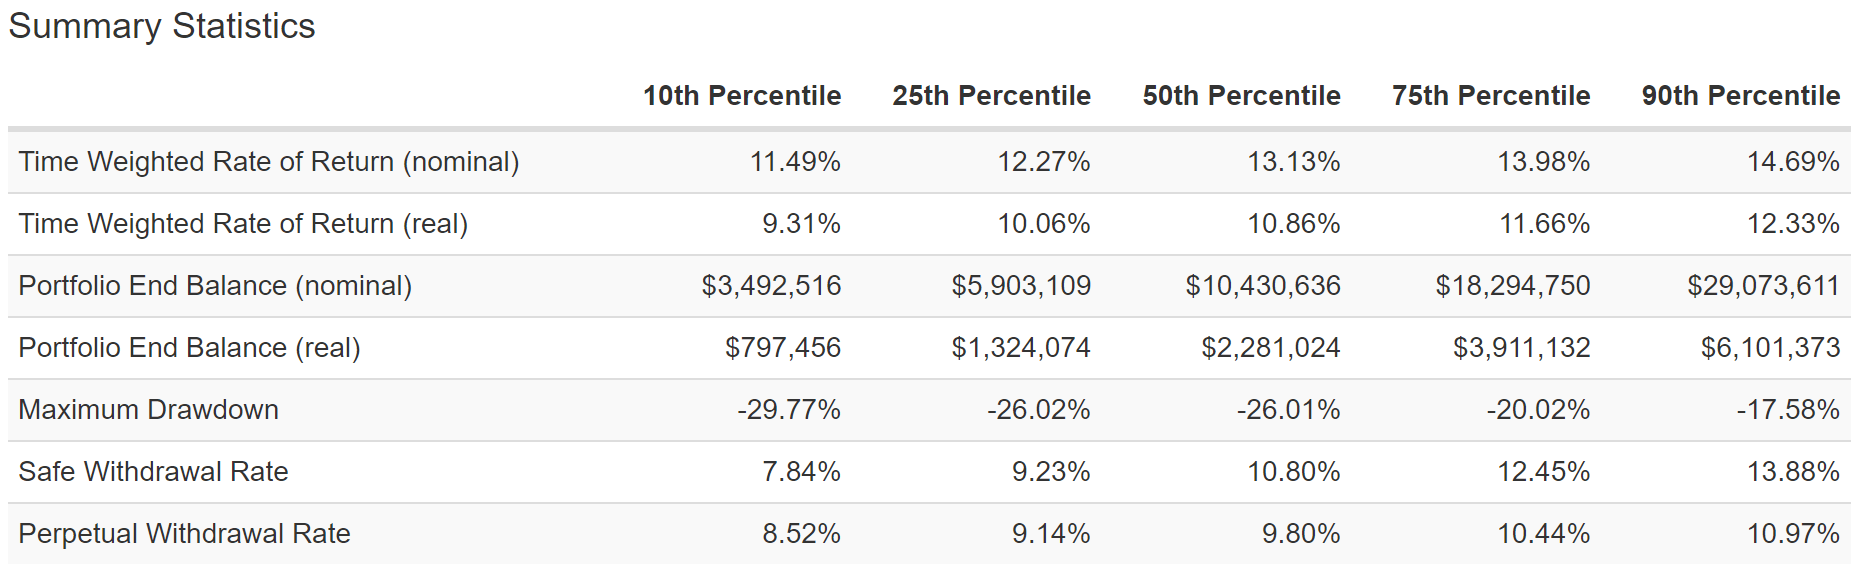
Portfolio Visualizer Premium
A 90% statistical probability of:
- 11.5+% nominal returns (12.2% consensus)
- 9.3+% inflation-adjusted returns (8.9% consensus)
- a 797X inflation-adjusted return ($1K becoming $797K over 75 years)
- a 7.8+% safe withdrawal rate (6.3% consensus)
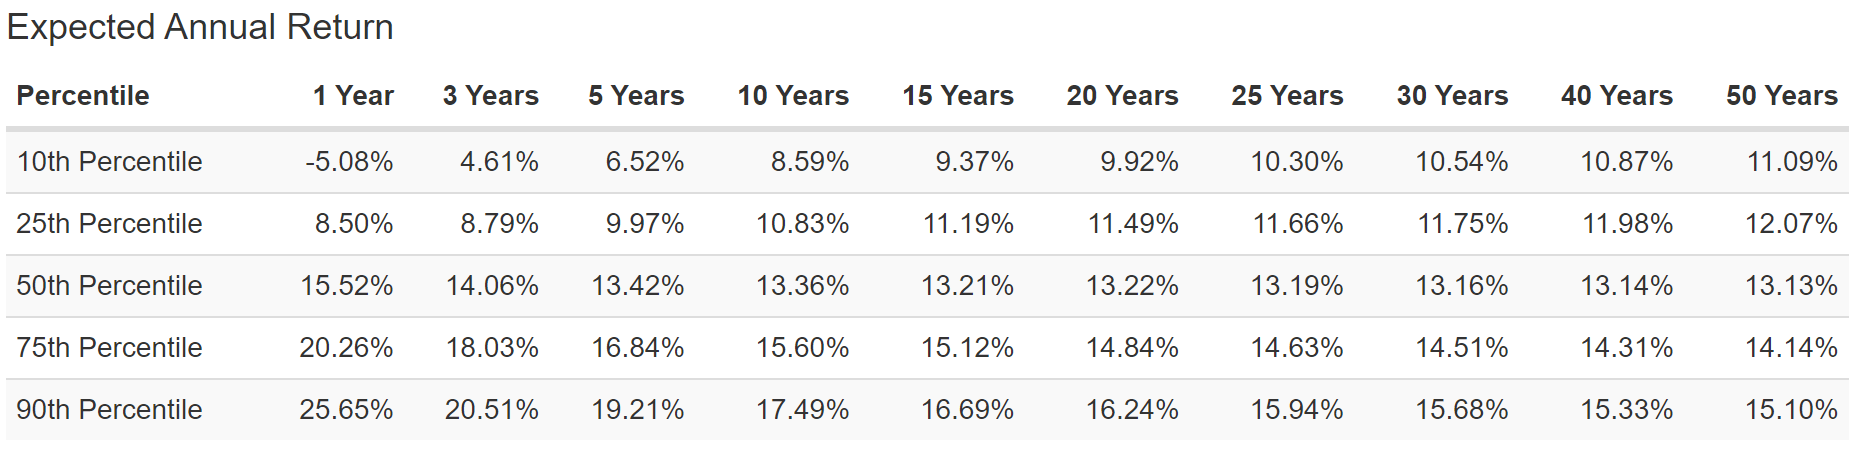
Portfolio Visualizer Premium
A 90% statistical probability of 11.1+% returns over the next 50 years vs. 10.2% S&P and 7.4% 60/40 consensus.
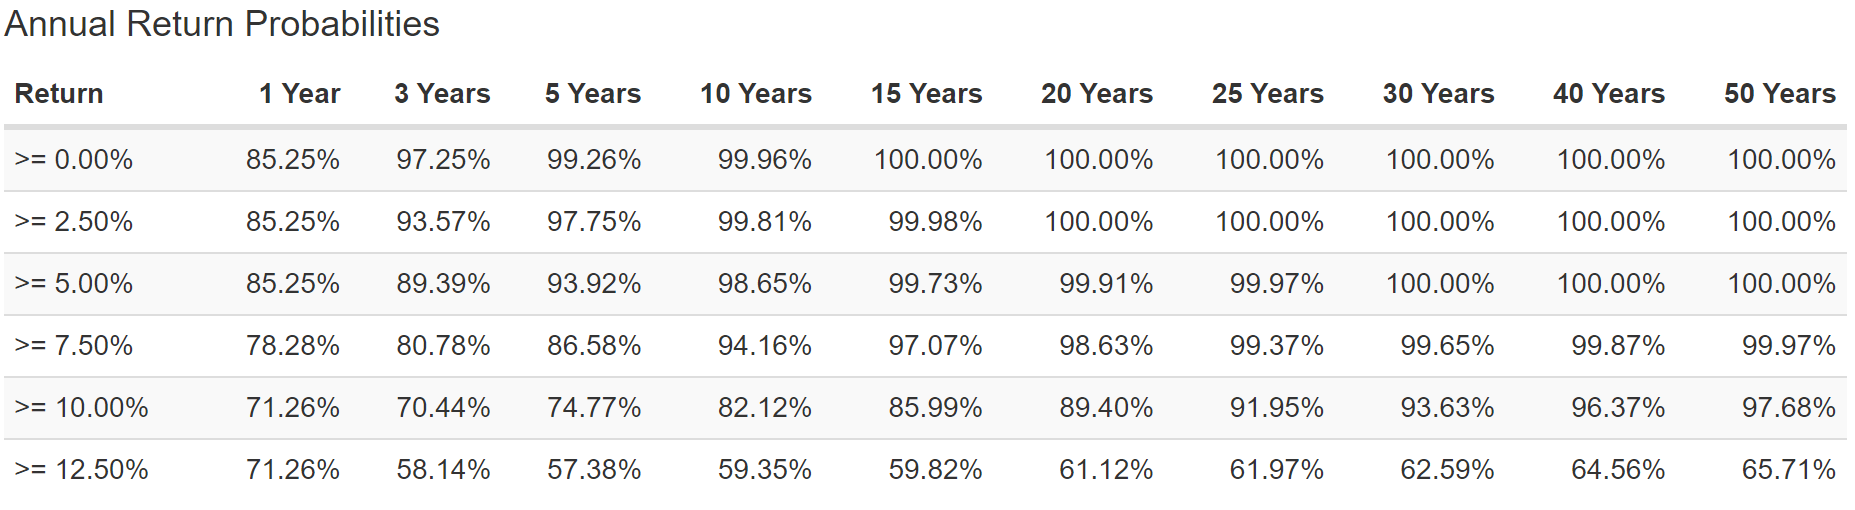
Portfolio Visualizer Premium
The chances of this portfolio beating the 60/40’s historical and consensus 7.4% returns over the next 50 years is approximately 99.97%.
The chances of it beating the S&P 500 over the next 50 years are approximately 97.68%.
- the reason the DK ZEUS Income Growth Portfolio is the ZEUS portfolio I would use if I were starting from scratch today
What about future bear markets?
| Bear Market Severity | Statistical Probability | 1 In X Probability | Expected Every X Years |
S&P 500 More Likely In Any Given Year To Suffer This Decline Than ZEUS Income Growth |
| 20+% | 3.16% | 32 | 2,373 | 396 |
| 25+% | 1.07% | 93 | 7,009 | |
| 30+% | 0.38% | 263 | 19,737 | |
| 35+% | 0.12% | 833 | 62,500 | |
| 40+% | 0.03% | 3333 | 250,000 | 5,000 |
(Source: Portfolio Visualizer Premium)
In any given year, ZEUS Income Growth is 396X less likely than the S&P to suffer a 20+% bear market.
It’s 5,000X less likely to suffer a 40+% crash than the S&P.
And the probability of a bear market in the next 75 years is just 3.2%.
Bottom Line: With Great Power Comes Great Responsibility, And Winning A $1.5 Billion Jackpot Is A Lot Of Power
Chance favors only the prepared mind.” -Louis Pasteur
Whether you have $400 to invest or $400 million, it doesn’t matter. The principles of smart long-term investing are always the same. In fact, this exact portfolio can absorb a $21.4 billion investment within 12 months.
The largest ZEUS portfolio that can be built within 12 months is approximately $1 trillion in scale (it requires several bonds ETFs and several more blue-chip ETFs and has 20 individual blue-chip holdings).
All that matters to you, no matter how much or how little money you have, is the six fundamentals that drive 97% of long-term returns.
- the right asset allocation for your risk profile
- the right blue-chip assets for your risk profile
- sufficient yield for your goals
- sufficient growth for your goals
- reasonable to attractive valuation
- periodic rebalancing (annually is the most tax efficient and works best for most people)
ZEUS Income Growth Can Help Anyone Retire A Millionaire
| Monthly Savings | Inflation-Adjusted Portfolio After 20 Years | Inflation-Adjusted Portfolio After 30 Years | Inflation-Adjusted Portfolio After 40 Years | Inflation-Adjusted Portfolio After 50 Years |
| $100 | $77,936 | $235,923 | $672,169 | $1,876,759 |
| $250 | $194,840 | $589,809 | $1,680,423 | $4,691,899 |
| $500 | $389,682 | $1,179,620 | $3,360,849 | $9,383,804 |
| $1,000 | $779,363 | $2,359,239 | $6,721,695 | $18,767,598 |
| $2,000 | $1,558,727 | $4,718,477 | $13,443,387 | $37,535,189 |
| $3,000 | $2,338,091 | $7,077,716 | $20,165,083 | $56,302,791 |
(Sources: DK Research Terminal, FactSet, Dave Ramsey Investment Calculator)
Do you see why I love this portfolio so much?
- 4.1% yield
- 60/40, S&P and Nasdaq beating long-term return potential
- 70% smaller peak declines than the market during the average bear market of the last 15 years
- as close to a bear-market-proof portfolio as you can realistically build
With ZEUS Income Growth, you truly can have it all.
And this is just my favorite ZEUS portfolio. You can build one that suits your personal needs.
- ZEUS High-Yield
- ZEUS Value
- ZEUS Low Volatility
- ZEUS REIT
- ZEUS aristocrats
- ZEUS high-yield aristocrats
- ZEUS foreign blue-chips
- ZEUS monthly income
- ZEUS high-yield, low-volatility aristocrats
Whatever your goals, time horizon, or risk profile, you can build a ZEUS portfolio using this proven ratio of assets.
The key is asset allocation; you can plug and play around with the individual holdings to your heart’s content.
- 33% blue-chip ETFs
- 33% hedging assets (cash, bonds, managed futures, alternatives)
- 33% individual blue-chips (what the DK Zen Research Terminal screening tool is for)
ZEUS Income Growth is just one of an infinite number of ZEUS portfolios you can build, but one that’s perfectly balanced for whatever is coming next for the market and economy.
- 33% value
- 33% growth
- 33% core
And this is why I’m confident that my family won’t suffer the lottery curse if I win that jackpot. Everyone and everything I care about will be better off because I will put that incredible power to use responsibly.
And rest assured, if I win the jackpot, you’ll never know it because I will remain diligent at my station, tirelessly continuing my mission to help everyone I can retire rich with blue-chip dividends.
Because world-beater blue-chips can help virtually anyone retire an inflation-adjusted millionaire.
This is why I love my job. My life’s mission is to help people like you realize your financial dreams, even if you have suffered catastrophic setbacks just like I, my uncle, father, and best friend have.
When the world’s best companies are working hard for you, one day, you won’t have to.
And this, my friends, is how you can make your own luck on Wall Street, whether or not you ever win a multi-million jackpot.
Be the first to comment