

peterschreiber.media/iStock via Getty Images
Now that I’ve got your attention let me share with you that in my 50+ years of investing I have never, ever found a way to predict what the market will do next. I have however found that I can observe which way the market is trending. What I’m still looking for is that Holy Grail of what time frame is the ideal length for determining a trend.
I personally prefer charts using price, the proprietary Barchart TrendSpotter and a moving average that correlates well to the TrendSpotter.
First you need to know what the TrendSpotter is:
TrendSpotter is a computerized trend analysis system, developed by Barchart.com. The system uses a combination of wave theory, market momentum and volatility in an attempt to find a general trend for a specific market. TrendSpotter attempts to cut losers early and let winners run.
A graphical interpretation of TrendSpotter can be viewed using either Interactive or Snapshot Charts.
- When there is a single dot above the price, this is a resistance point and represents a bearish trend.
- When there is a single dot below the price, this is a support point and represents a bullish trend.
- When there are 2 dots, one above and one below the price, this represents a neutral or hold trend (these are the entry prices to make a new buy or sell trade).
- When a trend EXITS either a bullish or bearish trend, the trend is forced as a neutral trend for at least one day.
I have found that the shorter time frame you choose the more apt you are to get whiplash and trade excessively.
For illustrative purposes I’m going to use Vanguard’s Total Market EFT (VTI) as my market proxy: VTI employs an indexing investment approach designed to track the performance of the index, which represents approximately 100% of the investable U.S. stock market and includes large-, mid-, small-, and micro-cap stocks. It invests by sampling the index, meaning that it holds a broadly diversified collection of securities that, in the aggregate, approximates the full index in terms of key characteristics. Presently the fund holds 4,081 so it is pretty representative of the US Stock Market as a whole.
When I use a daily chart of VTI it looks like this:
VTI Price, 50 Day Moving Average and TrendSpotter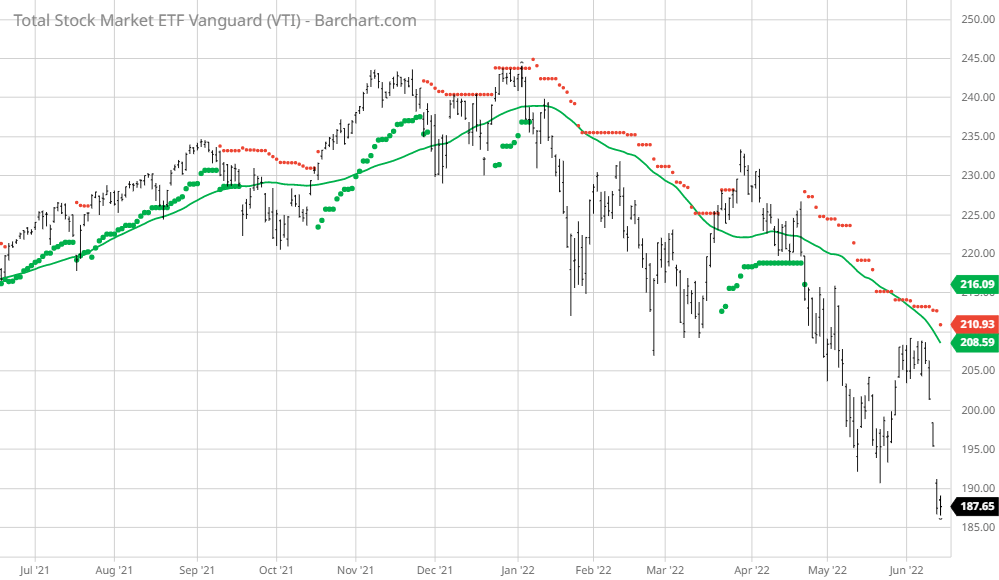
You can see that if you bought long and sold short every time the TrendSpotter changed signals you would be trading excessively. In fact, if you had bought long and sold short 100 shares of the ETF every time the signals changed since 6/14/17 you would have made 44 trades and you would have a net loss of $387. Even if you only bought long 100 shares and sold on the next sell signal and stayed in cash till the next buy signal you still would have made 24 trades and had a net profit of $2,990 for a 23.58% profit.
However, look what happens when I lengthen my time frame to weekly instead of daily:
VTI Price, TrendSpotter, 50 Week Moving average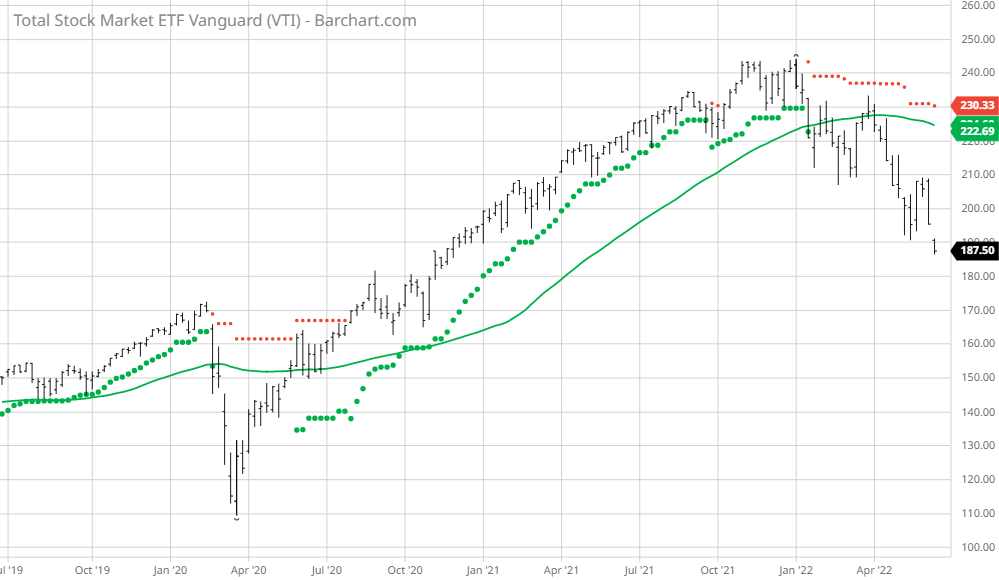
If I would have bought 100 shares of VTI @ 152.84 when the sell signal dropped on 5/25/20 and sold when the next sell signal @224.43 on 1/17/22 I would have made $7,159 for an 46.83% gain.
Clearly, the longer timeframe gave a superior performance. Is the weekly timeframe the Holy Grail? I’m not sure but I’ll use it until I find something better.
Be the first to comment