

anyaberkut
This article was published on Dividend Kings on Tuesday, December 19th.
———————————————————————————-
2023 is coming… prepare for glory! Glorious blue-chip bargains that could change your life.
Investors are likely to be tested in the first half of 2023, with a potentially sharp sell-off as earnings finally catch up to the reality of the recession.
S&P Potential Bear Market Bottom
| Earnings Decline In 2023 | 2023 S&P Earnings | X 25-Year Average PE Of 16.7 | Decline From Current Level |
| 0% | $218.45 | $3,648.12 | 5.3% |
| 5% | $207.53 | $3,465.71 | 10.0% |
| 10% | $196.61 | $3,283.30 | 14.8% |
| 13% | $190.05 | $3,173.86 | 17.6% |
| 15% | $185.68 | $3,100.90 | 19.5% |
| 20% | $174.76 | $2,918.49 | 24.2% |
(Source: DK S&P Valuation Tool, FactSet, Bloomberg)
But while the first half of 2023 might prove terrifying for some, it will be a walk in the park for Justin, a 70-year-old family friend who lives in Seattle, Washington.
Let me show you why Justin isn’t worried about the coming potential market crash and will sleep like a baby as he grows steadily richer in retirement.
More importantly, I’ll show you how you, too, can build the ultimate high-yield sleep-well-at-night retirement portfolio that can make your rich retirement dreams come true.
How I Helped Justin Build His Ultimate $5 Million High-Yield Sleep Well At Night Retirement Portfolio
Even the smartest people can make bone-headed mistakes. My best friend got sucked into the speculative tech mania of the Pandemic and lost 80% of his 401K. I helped him rescue his final $40K, and he’s now on track to retire at 70 as he planned.
My father blew up his 401K by going 65% into Alibaba (BABA), and with just 10 years until retirement, he thought his retirement dreams were dead. He had to grow $80,000 into $500,000 to rescue those dreams. I helped him rescue those dreams with the world’s best hyper-growth ultra-swans.
My uncle graduated top of his class from Caltech, has a Ph.D. from Princeton and is a chief computer programmer for Alphabet (GOOG) working on deep-learning machine algorithms. He’s the smartest man I know and lost $1 million, half his life savings, in the 2022 crypto collapse.
I helped him rescue his last $1 million by building a high-yield income growth portfolio so good that it’s what I’ll be using for my entire net worth in the future.
Rose is a family friend who cashed in on the Pandemic housing boom in Florida at the right time and was terrified about what to do with $3 million in after-tax cash.
I helped her build an ultra-low volatility high-yield portfolio that fell just 18% in the Great Recession and just 10% in this bear market.
So when Justin asked me to help him, and told me his story, I just knew that helping him rescue his portfolio was something that could help not just him, but all my readers as well.
A Smart Man Who Made A Stupid Mistake
Justin made his fortune in real estate (the #1 industry for minting millionaires). His father introduced him to the family business 50 years ago, and he never thought much about the stock market.
When he retired at age 70, he wasn’t very comfortable with stocks, so his financial advisor put $6.2 million, about half of his net worth, into a 60/40 portfolio.
Justin was worried about rising inflation in 2021 and wasn’t sure if being 40% bonds was a good idea. But his advisor assured him that this was the gold standard of retirement portfolios and could withstand anything the economy or stock market could ever throw at us.
Then the worst inflation in 42 years struck, and we experienced the worst bond bear market in US history and the 5th worst bond bear market in human history.
Like so many retirees, Justin rode the ups and downs of 2022’s wild market, praying the pain would end. Well, on October 13th, he had finally had enough and couldn’t stomach the 6th worst volatility in US market history.
He cashed out his 60/40…at a 21% loss. That’s $1.2 million or about 10% of his life savings up in smoke. In a matter of 10 months, Justin lost more money than most people will ever see.
This happened to be the worst market timing you can imagine, literally the bottom of this bear market…so far.
As the market took off and bonds rallied too, Justin was tempted to get back into the market now that the “dust had settled.” But then he heard on the radio an interview with Wells Fargo’s head economist predicting that 10-year yields could rise to 4.75% in 2023 and that bonds would be slaughtered even worse.
He asked me about this, and I told him it was true, but that HSBC and Nomura think that some bonds could rally 30% in the next seven months. Confused and frightened by a likely market crash in 2023, Justin was considering just sitting in cash, terrified that he might lose another million dollars or more.
Then I showed him this table and that after bear markets like this one, the stock market’s average 10-year gain is over 3X.
Ben Carlson 
Even though the average bear market falls 17% more after the market falls 25%, anyone who buys and holds the market in such a bear market averages a 22% gain within a year.
Charlie Bilello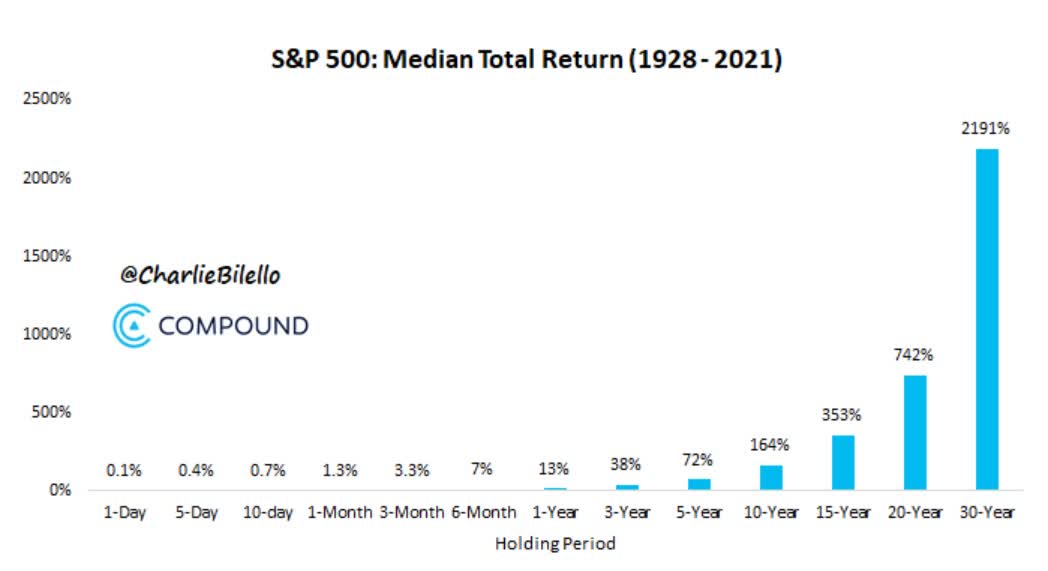
And over the long-term, the stock market always goes up. In fact, not even during the Great Depression did the market fail to generate positive returns over 20 years, even if you had the worst luck in history and bought at 1929 high.
And what if you try to time the market, sit in cash, and wait for the “dust to settle”?
Charlie Bilello 
That’s what most investors do, and guess what? It costs them, on average, 1.73% annual returns.
- 67% less inflation-adjusted wealth over a 30 year retirement
Well, guess what? Justin is smart and knows he has to plan for a 30-year retirement, even at age 70. That’s because, according to the Social Security Administration, either he or his wife has a 10% chance of living to 100.
So Justin and his wife need to be invested for the next 30 years, especially since they want to leave their five kids and seven grandkids a nice inheritance. For Justin sitting in cash for three decades and earning nothing after inflation is not an option.
But remember that Justin spent his adult life in real estate. We were all scarred by the Great Recession, but anyone working in real estate especially so. My fellow Dividend King Brad Thomas lost $2 million during the GFC, and Justin lost $3 million, though he was able to make it back and then some.
But those were some sleepless nights, to say the least. And given that this is the most anticipated recession in history, and the last recession was the worst since the Great Depression, Justin can’t help worrying that the 2023 recession could be far worse than what economists currently expect.
So here’s what Justin asked me to help him build, using the Dividend Kings tools and ZEUS recession-optimized strategy.
- a high-yield portfolio with at least 2x the yield of a 60/40
- the main goal is maximum SAFE and GROWING income
- nothing speculative (that could blow up in a recession)
- K1 tax forms are OK (his CPA handles them with ease)
- must beat the 60/40 over time (so he can recoup his $1.2 million loss)
And this last request is what really sealed the deal when deciding whether or not to spend an entire weekend on Zoom with Justin, helping him build his dream portfolio.
I know myself Adam. I just can’t stomach a bear market. As soon as my portfolio is down 20% I panic and think it’s going to drop another 20%. If I see -20% I’m going to panic sell just like I did in October.”
I knew I could help Justin, and everyone out there like him, so I donated a weekend of my time to help guide him through the process, using DK tools, to construct the ultra-yield sleep-well-at-night retirement portfolio of his dreams.
Justin’s $5 Million ZEUS Ultra-Yield Retirement Portfolio
ZEUS stands for ZEN Extraordinary Ultra SWAN (Sleep well at night), and it’s based on Nick Maggiulli’s research at Ritholtz Wealth Management.
- Nick Maggiulli is the Chief Data Scientist for Ritholtz
- he found that historically 67% stocks and 33% hedging assets are the long-term recession-optimized retirement portfolio
- good returns and minimum downside in even the most extreme bear markets
So here’s Justin’s $5 million ZEUS Ultra-Yield portfolio.
(Source: DK Research Terminal, FactSet)
I’ve linked to articles about each company’s investment thesis, growth outlook, and risk profile.
ETF Buffett: 33% In SCHD
SCHD is hands down the best high-yield blue-chip ETF I’ve ever found, and I’ve literally spent months making video reports about my hunt for a better one.
- The bottom line on SCHD: it’s the 100 best high-yield world-beater blue-chips you can buy
Hedging Bucket: 16.7% EDV and 16.7% DBMF
According to Duke University, long-duration US treasuries are the best historical hedge for recessions.
Duke University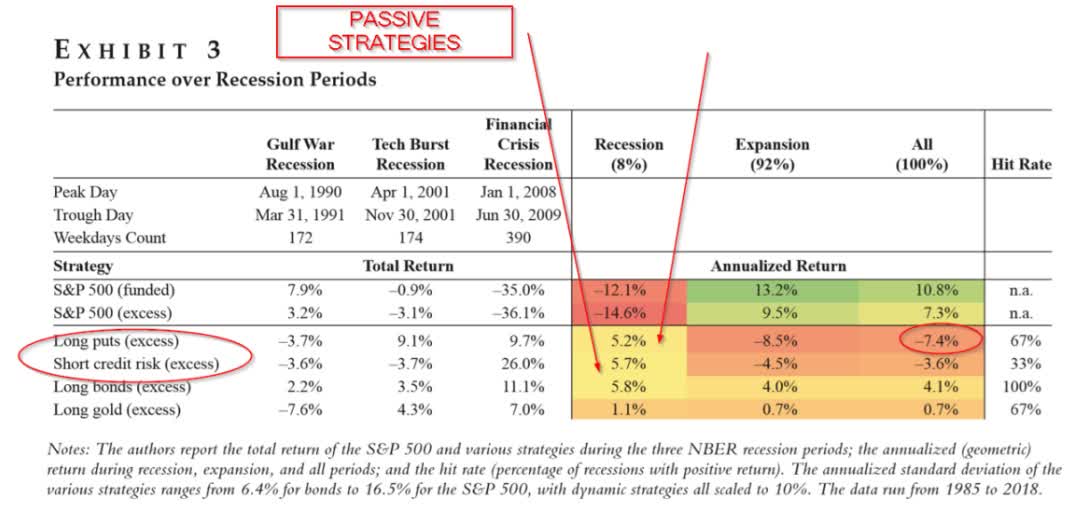
Nothing goes up as much as long bonds during the recession but generates positive long-term inflation-adjusted returns.
Nomura and HSBC think that long bonds like EDV and ZROZ could rally 30% in the first half of 2023, as the recession sends earnings and stocks crashing and investors into the ultimate flight to safety.
- The bottom line on EDV: the lowest cost, highest yielding, and longest duration long bond ETF there is
Morgan Stanley’s #1 recommendation for clients in the first half of 2023? Long-duration US treasury bonds.
What about when bonds fail and fall along with stocks?
- As happened 8% of the time since WWII?
When Bonds Fail Managed Futures Don’t
Managed futures are the 2nd most effective hedging strategy in history. They use futures to go long or short stocks, bonds, currencies, and commodities.
They perform best during market crashes and work especially well during stagflation.
| Bear Market | Managed Futures | S&P |
| 2022 Stagflation | 10% | -16% |
| Pandemic Crash | 0% | -34% |
| 2018 | 6% | -21% |
| 2011 | -7% | -22% |
| Great Recession | 14% | -58% |
| Tech Crash | 29% | -50% |
| 1990 Recession | 21% | -20% |
| 1987 Flash Crash | 57% | -30% |
| 1980 to 1983 Stagflation Period | 195% | 51% |
| Average | 36% | -22% |
(Sources: DBMF, Soc Gen, Barclays, Ycharts)
In how many recessions since 1980 have managed futures gone down? None.
In how many bear markets have they fallen? Just 2011.
Managed futures + bonds have increased in every bear market in the last 42 years. High inflation, low inflation, financial panics, pandemics, invasions, it doesn’t matter; this combination of assets never failed.
What’s the probability that managed futures + long bonds will work in future bear markets? According to Fidelity, it’s about 97% likely.
- As close to a guarantee as you’ll find on Wall Street
Why DBMF?
DBMF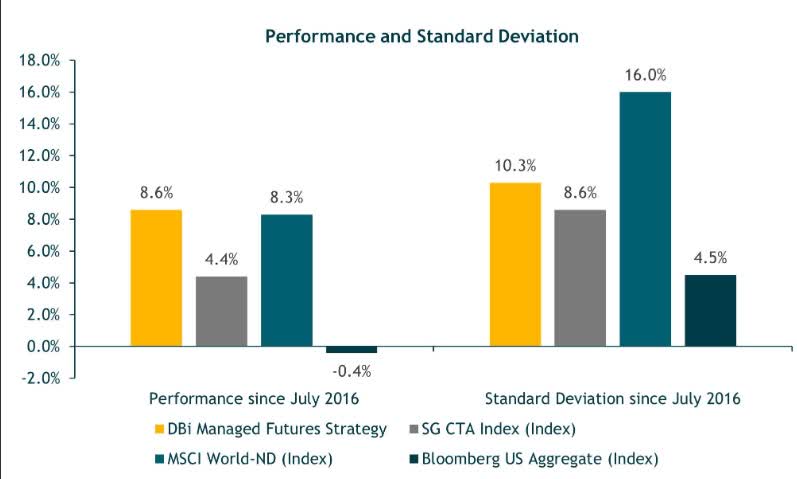
Because this is the Vanguard of hedge funds, tracking the 20 largest managed futures funds in the world. Every Monday, its algorithms look back over the last two months and determine what positions would most closely replicate the 20 best-managed futures funds in the world.
And then, by charging 80% lower fees, it’s designed to beat its index by 4% per year over time. Guess what it’s done since its inception? Beaten its index, after fees, by 4%.
- The bottom line on DBMF: the Vanguard of hedge funds is the lowest cost and simplest option to get the 20 best funds working for you
Blue-Chip Bucket: 33% (5.6% Each Into The 6 Highest Yielding Non-Speculative Blue-Chips)
Why did we select MMP, EPD, MPLX, MO, LGGNY, and MAIN for Justin’s ultra-yield bucket?
(Source: Dividend Kings Zen Research Terminal)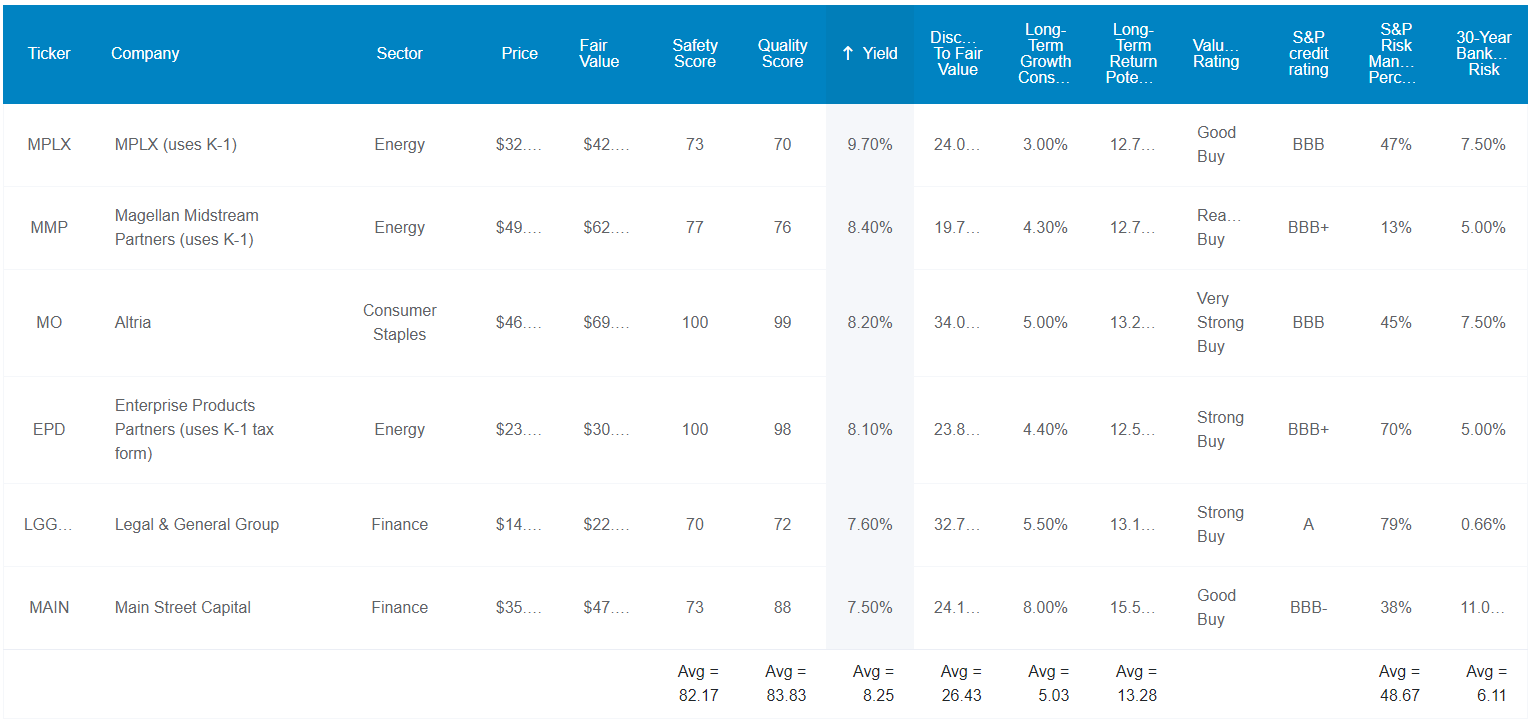
These six blue-chips generate one of the safest 8.3% yields on earth and the only one that’s growing at 5% over time.
- The average risk of a cut in a Severe Recession? 1.95%
- The average risk in a normal recession? 0.5%
- BBB+ stable credit rating
- 21-year average dividend growth streak (since 2001)
- average long-term total risk management rating by S&P? 49th percentile average, medium risk
Long-Term Consensus Total Return Potential
| Investment Strategy | Yield | LT Consensus Growth | LT Consensus Total Return Potential |
| 6 Ultra-Yield Blue-Chips | 8.3% | 5.0% | 13.3% |
| Safe Midstream | 5.9% | 6.4% | 12.3% |
| REITs | 3.9% | 6.1% | 10.0% |
| Schwab US Dividend Equity ETF | 3.4% | 7.6% | 11.0% |
| 60/40 Retirement Portfolio | 2.1% | 5.1% | 7.2% |
| Dividend Aristocrats | 1.9% | 8.5% | 10.4% |
| S&P 500 | 1.7% | 8.5% | 10.2% |
(Source: DK Research Terminal, FactSet, Morningstar, Ycharts)
How would you like to earn a safe and growing 8.3% yield while also beating the S&P, aristocrats, and Nasdaq?
That’s what these six ultra-yield blue-chips are expected to do.
How do we know that’s a realistic forecast by analysts?
Historical Returns Since 2007 (Annual Rebalancing)
The future doesn’t repeat, but it often rhymes. – Mark Twain
Past performance is no guarantee of future results.
Still, studies show that over time, blue-chips with relatively stable fundamentals offer predictable returns based on yield, growth, and valuation mean reversion.
Bank of America
Over 15 years, total returns are 90% fundamentals and 10% luck.
Portfolio Visualizer Premium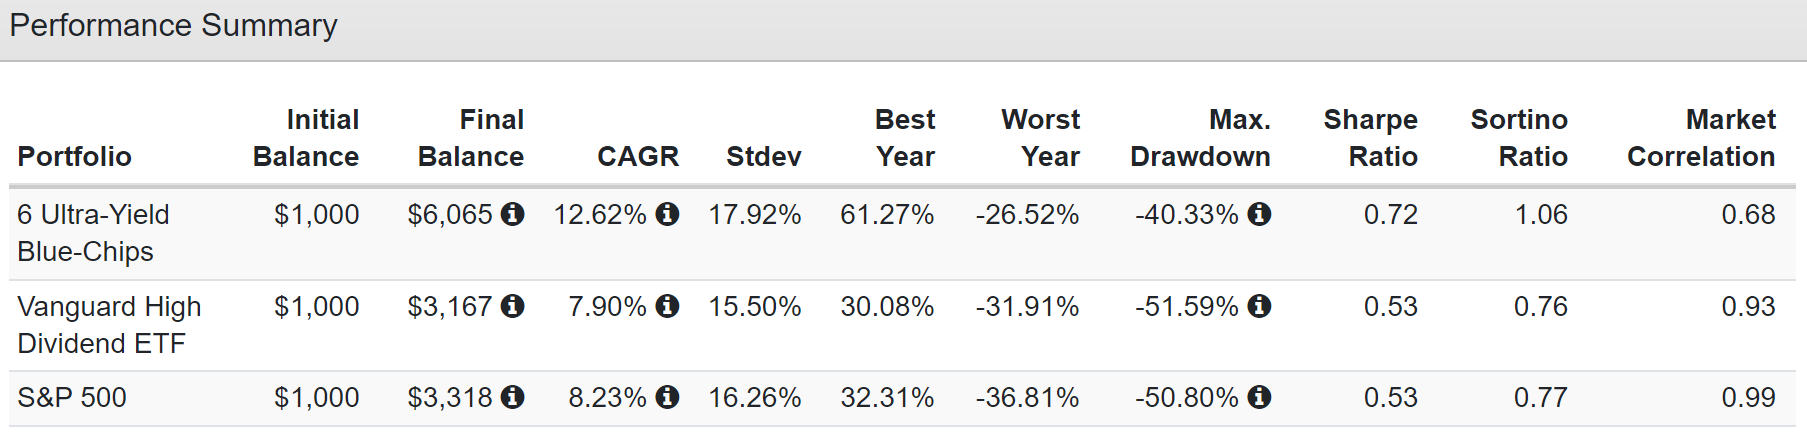
15 years of about 13% annual total returns, just as analysts expect in the future from these mature blue-chips. And much better returns and smaller peak declines in the Great Recession than VYM or the S&P.
Portfolio Visualizer Premium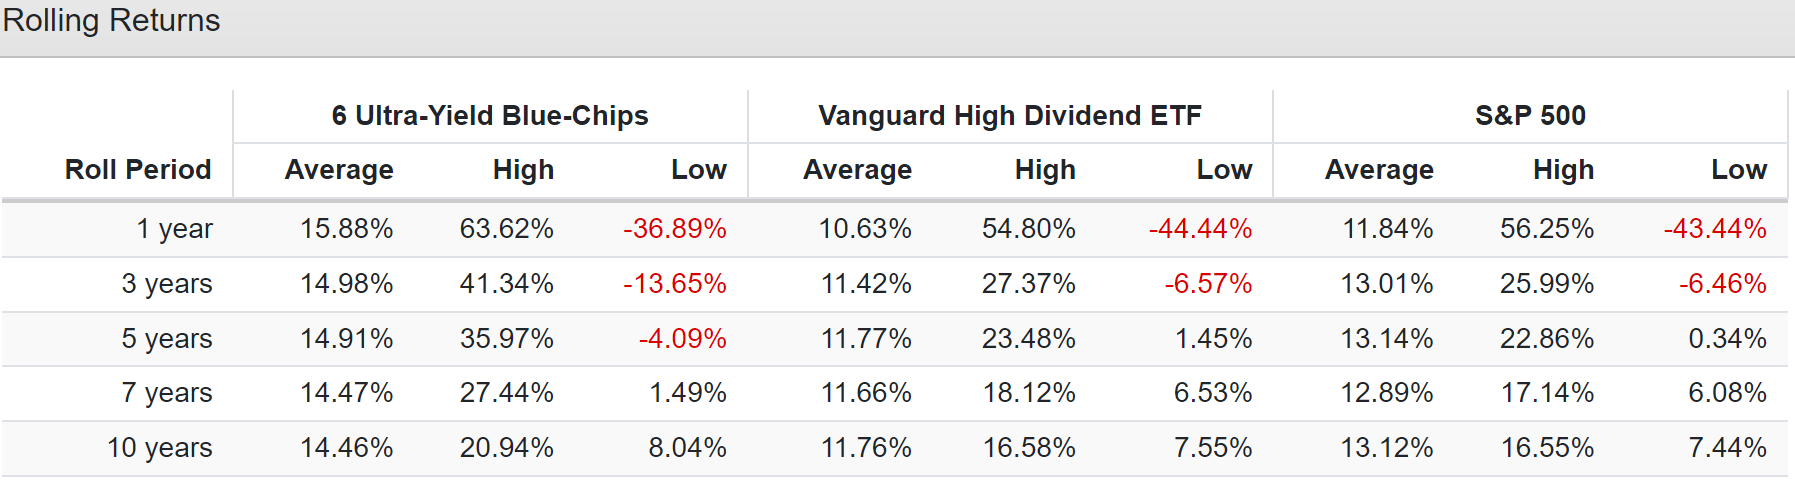
Consistently better average rolling returns than VYM or the S&P for 15 years.
Income Growth You Can Trust In Any Economy
2008 was 2 MO spin-offs ((Source: Portfolio Visualizer Premium))
Cumulative Dividends Since 2008 Per $1,000 Investment
| Metric | S&P | VYM | 6 Ultra-Yield Blue-Chips |
| Total Dividends | $484 | $783 | $3,660 |
| Total Inflation-Adjusted Dividends | $343.26 | $555.32 | $2,595.74 |
| Annualized Income Growth Rate | 8.2% | 9.4% | 13.7% |
| Total Income/Initial Investment % | 0.48 | 0.78 | 3.66 |
| Inflation-Adjusted Income/Initial Investment % | 0.34 | 0.56 | 2.60 |
| More Inflation-Adjusted Income Than S&P 500 | NA | 1.62 | 7.56 |
| Starting Yield | 1.8% | 2.7% | 8.3% |
| Today’s Annual Dividend Return On Your Starting Investment (Yield On Cost) | 5.4% | 9.5% | 44.3% |
| 2022 Inflation-Adjusted Annual Dividend Return On Your Starting Investment (Inflation-Adjusted Yield On Cost) | 3.8% | 6.7% | 31.4% |
(Source: Portfolio Visualizer Premium)
Just like today in 2008, these blue-chips yielded 8.3%. And they grew their dividends almost 15% annually, nearly 2X faster than the S&P 500 and 40% faster than VYM.
They paid out 8X more inflation-adjusted dividends than the S&P and 5X more than VYM.
Their inflation-adjusted yield on cost is now 31%, almost 5X more than VYM and 8X more than the S&P.
Putting It All Together
A ZEUS portfolio lets you ride over the most extreme market potholes in a Rolls Royce Portfolio.
ZEUS Ultra-Yield Vs. 60/40
| Metric | 60/40 | ZEUS Ultra-Yield Portfolio | X Better Than 60/40 |
| Yield | 2.1% | 6.1% | 2.90 |
| Growth Consensus | 5.1% | 4.2% | 0.82 |
| LT Consensus Total Return Potential | 7.2% | 10.3% | 1.43 |
| Risk-Adjusted Expected Return | 5.0% | 7.2% | 1.43 |
| Safe Withdrawal Rate (Risk And Inflation-Adjusted Expected Returns) | 2.8% | 4.9% | 1.78 |
| Conservative Time To Double (Years) | 26.0 | 14.6 | 1.78 |
(Source: DK Research Terminal, FactSet)
3X the yield of a 60/40, 43% better return potential, and doubles your inflation-adjusted wealth almost twice as fast.
ZEUS Ultra-Yield Vs. S&P 500
| Metric | S&P | ZEUS Ultra-Yield Portfolio | X Better Than S&P 500 |
| Yield | 1.7% | 6.1% | 3.59 |
| Growth Consensus | 8.5% | 4.2% | 0.49 |
| LT Consensus Total Return Potential | 10.2% | 10.3% | 1.01 |
| Risk-Adjusted Expected Return | 7.1% | 7.2% | 1.01 |
| Safe Withdrawal Rate (Risk And Inflation-Adjusted Expected Returns) | 4.9% | 4.9% | 1.01 |
| Conservative Time To Double (Years) | 14.8 | 14.6 | 1.01 |
(Source: DK Research Terminal, FactSet)
And ZEUS portfolios aren’t just for retirees. How about matching the market’s returns but with almost 4X the safe yield and 50% smaller declines in even the most extreme market crashes?
Inflation-Adjusted Consensus Total Return Potential: $5 Million Starting Balance
| Time Frame (Years) | 4.8% CAGR Inflation-Adjusted 60/40 | 7.9% Inflation-Adjusted ZEUS Ultra-Yield | Difference Between ZEUS Ultra-Yield Ultra SWAN Consensus and 60/40 Consensus |
| 5 | $6,320,863.58 | $7,312,691.09 | $991,827.50 |
| 10 | $7,990,663.29 | $10,695,090.19 | $2,704,426.90 |
| 15 | $10,101,578.52 | $15,641,978.14 | $5,540,399.62 |
| 20 | $12,770,139.96 | $22,876,990.82 | $10,106,850.86 |
| 25 | $16,143,662.53 | $33,458,473.38 | $17,314,810.85 |
| 30 | $20,408,377.73 | $48,934,296.02 | $28,525,918.29 |
(Source: DK Research Terminal, FactSet)
Over Justin’s 30-year time horizon, ZEUS Ultra-Yield could potentially deliver $29 million in extra inflation-adjusted wealth.
- He can potentially recoup his $1.2 million loss in just 7 years
| Time Frame (Years) |
Ratio ZEUS Ultra-Yield Portfolio Vs. 60/40 Consensus |
| 5 | 1.2 |
| 10 | 1.3 |
| 15 | 1.5 |
| 20 | 1.8 |
| 25 | 2.1 |
| 30 | 2.4 |
(Source: DK Research Terminal, FactSet)
This is the power of the world’s best blue-chips and prudent risk management. This is the power of ZEUS.
- The king of sleep-well-at-night retirement portfolios
Sounds pretty extraordinary, doesn’t it? And here’s the Ultra SWAN proof.
ZEUS Ultra-Yield Fundamentals
Morningstar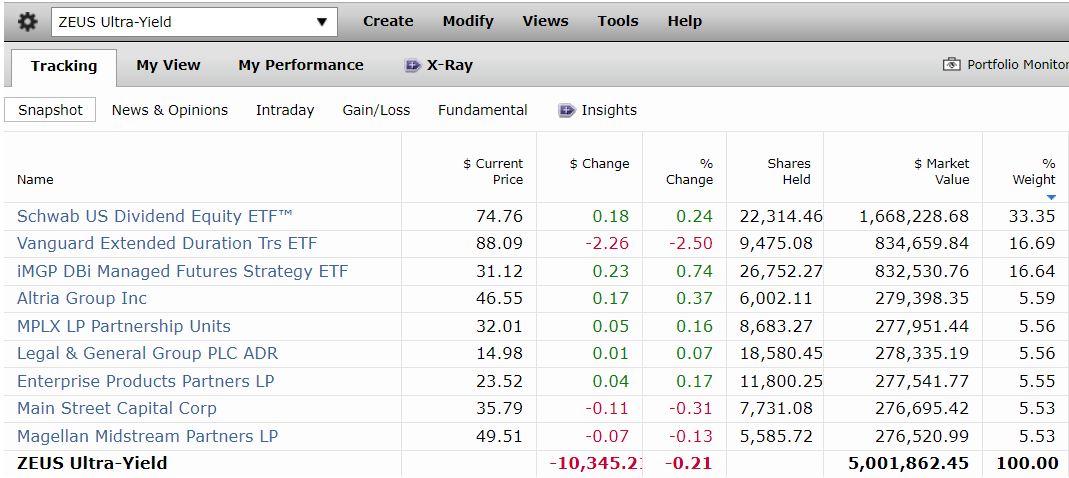
This is Justin’s ZEUS Ultra-Yield portfolio.
Morningstar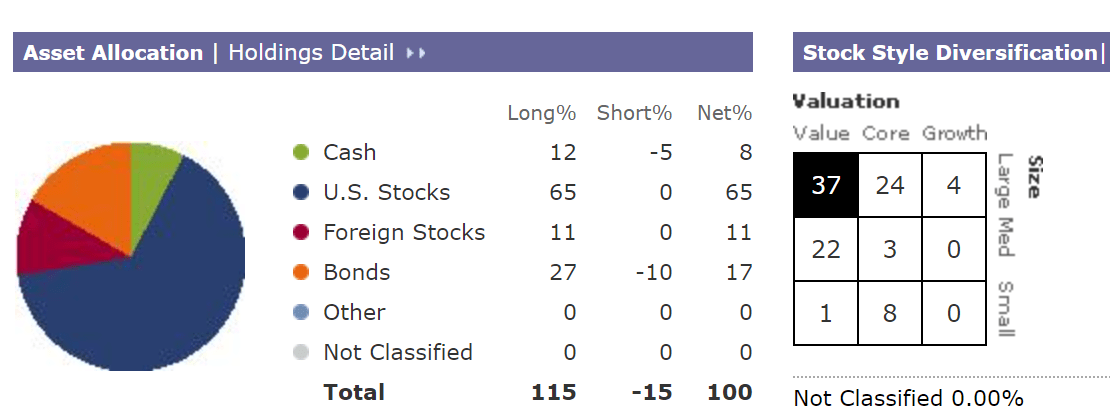
It’s diversified by assets:
- 65% US stocks
- 11% foreign stocks
- 17% bonds
- 8% cash (due to DBMF)
It’s 60% value, 36% core, and 4% growth.
Morningstar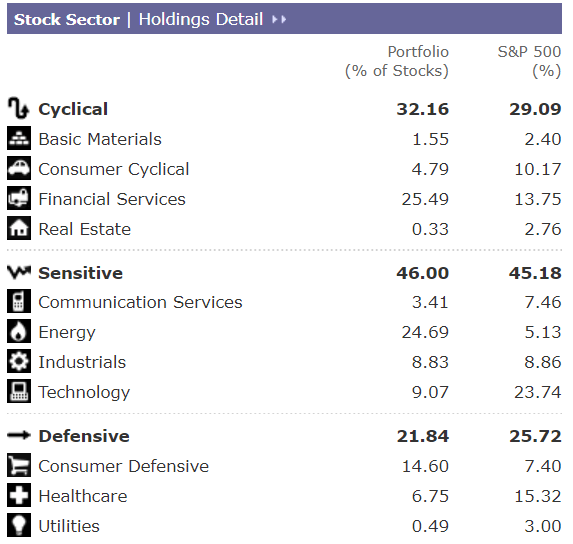
It’s heavily weighted towards financials and energy but follows the risk-management sector caps for concentrated portfolios.
- 33% max sector caps, according to Charlie Munger, Charles Schwab, and Fidelity
Morningstar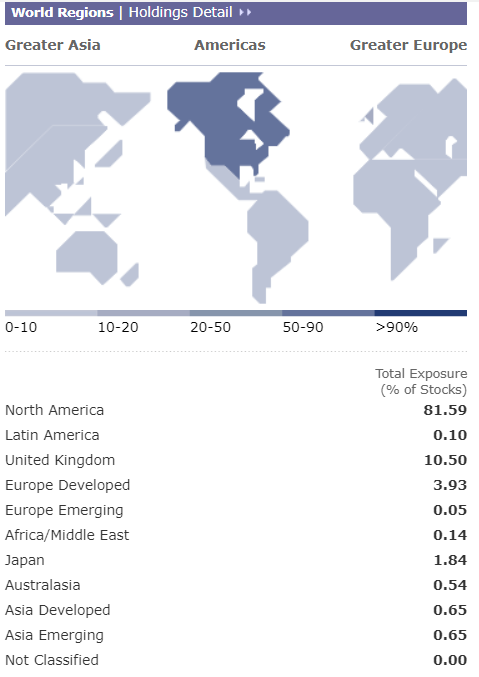
Exposure to every part of the world, but focused on North America.
Morningstar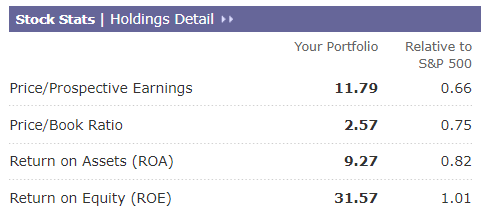
The last time the S&P traded at 11.8X earnings was in March 2009.
This portfolio literally is at Great Recession undervaluation.
Morningstar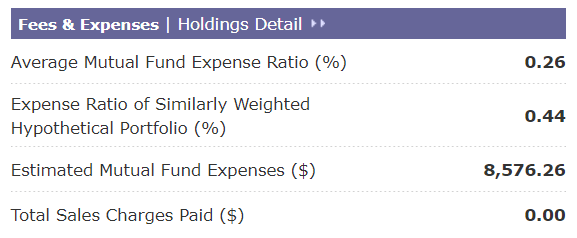
The average hedge fund charges 5% annual fees and has delivered 7.6% annual pre-fee returns for the last 20 years.
- 0.2% after fee-inflation-adjusted returns
- ZEUS Ultra-Yield delivered 10.7% annual returns and 8.3% after inflation
- 41.5X better returns and 20X lower fees
106 Of The World’s Most Dependable High-Yield Blue-Chips
Morningstar Morningstar Morningstar Morningstar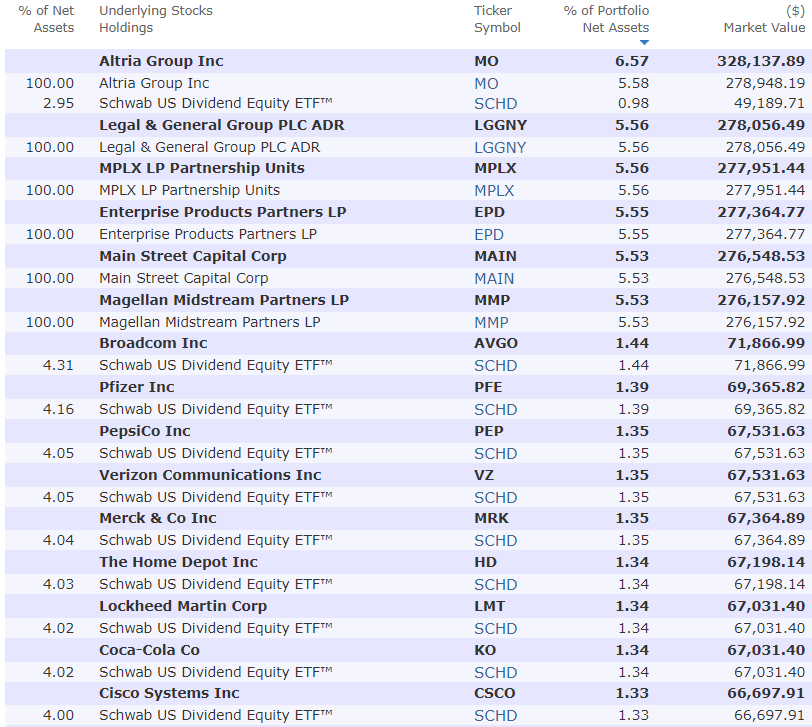

This is what a diversified and prudently risk-managed Ultra SWAN portfolio looks like, and here’s the proof.
Historical Returns Since December 2007 (Start Of The Great Recession)
(Source: Portfolio Visualizer Premium)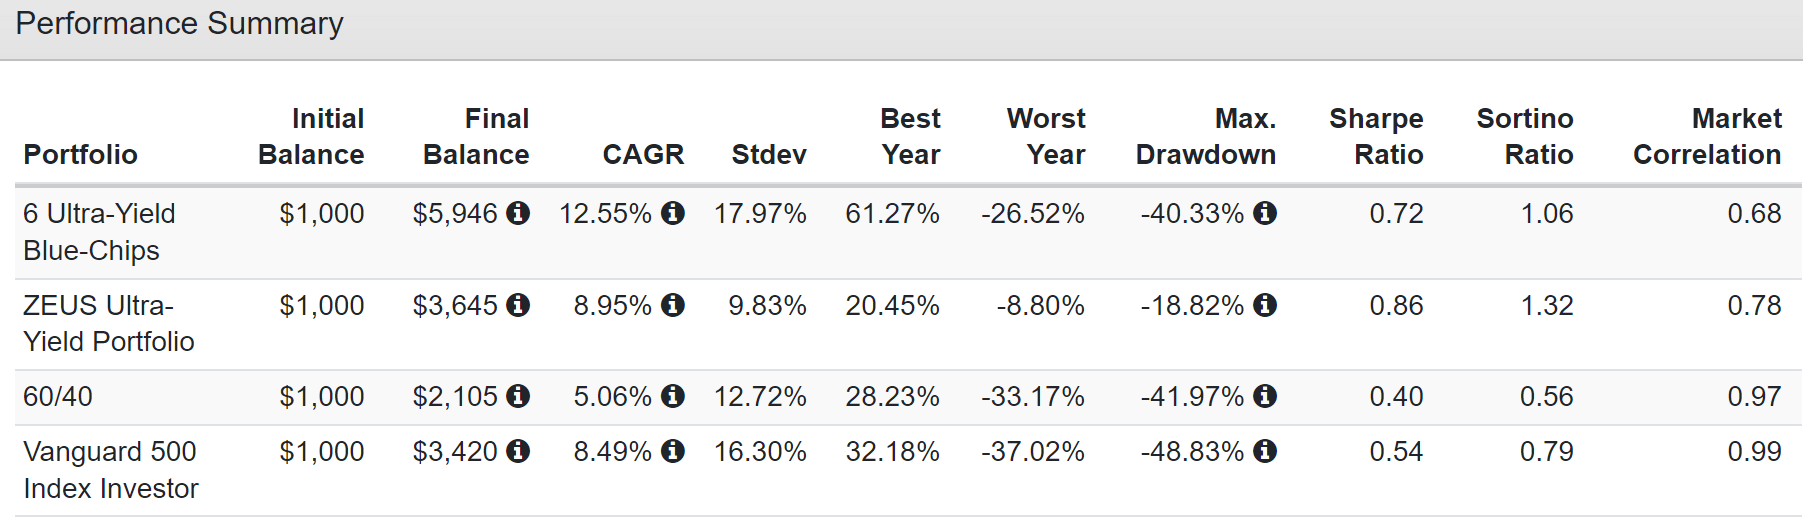
In the average year since 2007, the S&P fell 16.3% at some point each year, and the 60/40 almost 13%. ZEUS? Not even a correction, just 9.8% annual volatility.
- 40% less annual volatility than the S&P but with slightly better returns
- 4% better annual returns than the 60/40
A peak decline of 19% during the Great Recession. Justin can’t emotionally stand bear markets, and with ZEUS, he doesn’t have to.
(Source: Portfolio Visualizer Premium)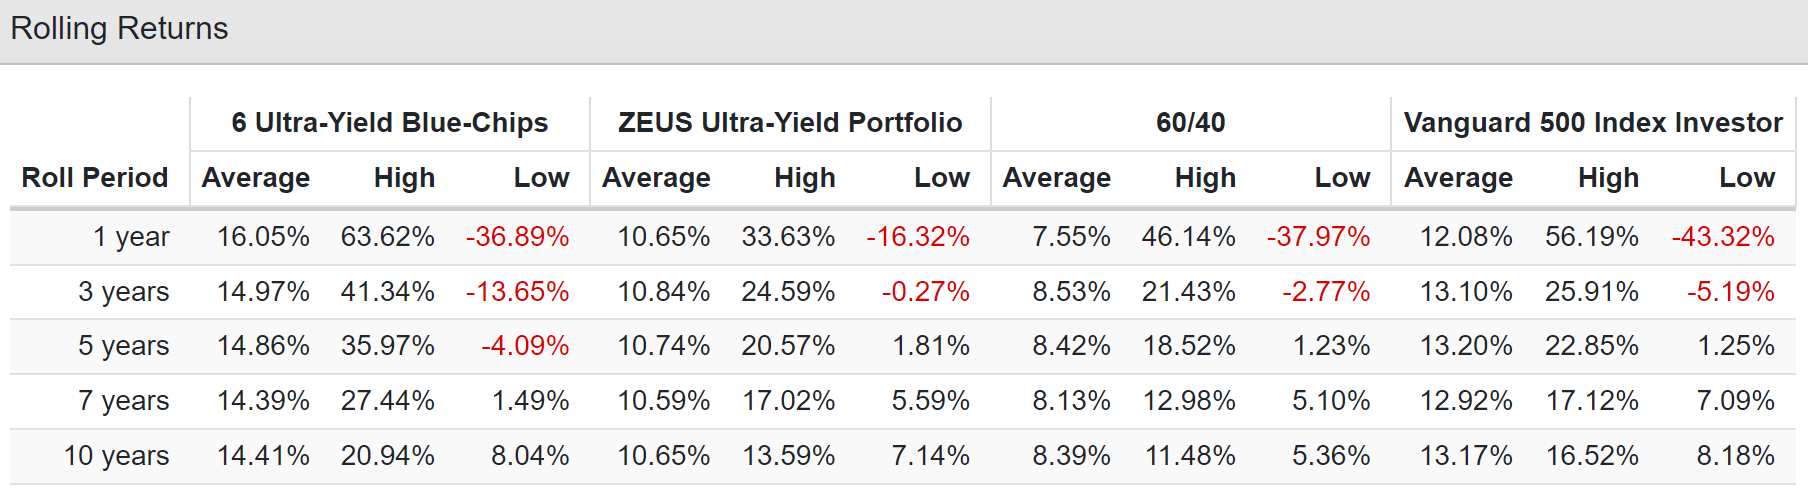
10.3% long-term consensus return potential vs. 10.7% average annual rolling returns. Which is also the average 3 to 10-year rolling return.
ZEUS = better returns, smooth as silk.
(Source: Portfolio Visualizer Premium)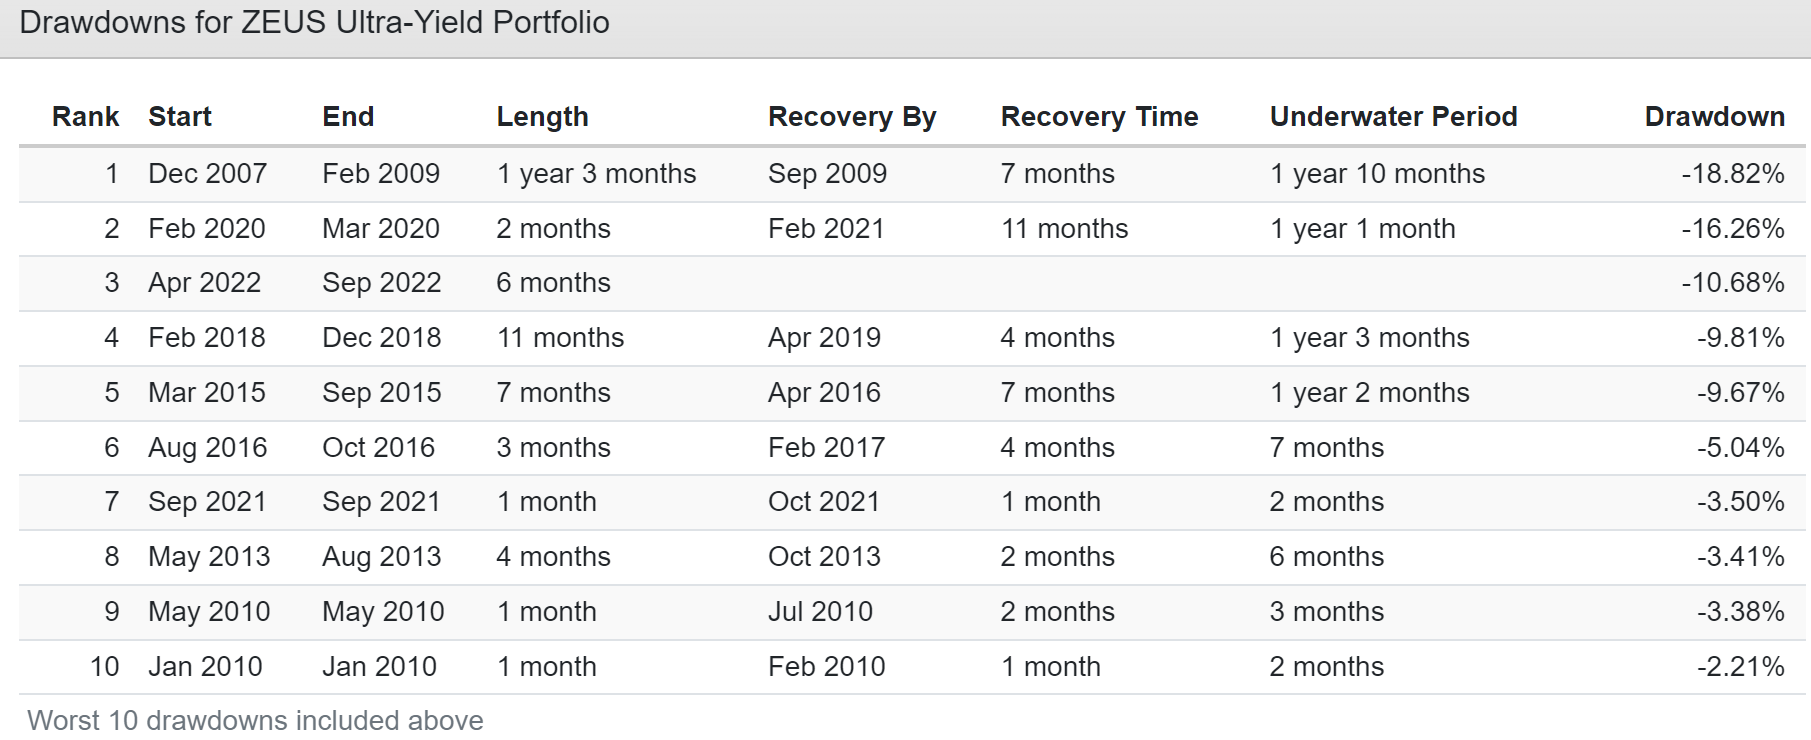
In the last 15 years, the S&P has had four bear markets and 60/40 two. ZEUS? None, and just three corrections.
Three recessions, and two market crashes, including the 2nd worst in US history, weren’t enough to cause ZEUS to fall into a bear market. It took less than two years to recover to new highs after the Great Recession, while it took the 60/40 3.25 years and the S&P 4.25 years.
ZEUS Ultra-Yield During The Great Recession
(Source: Portfolio Visualizer Premium)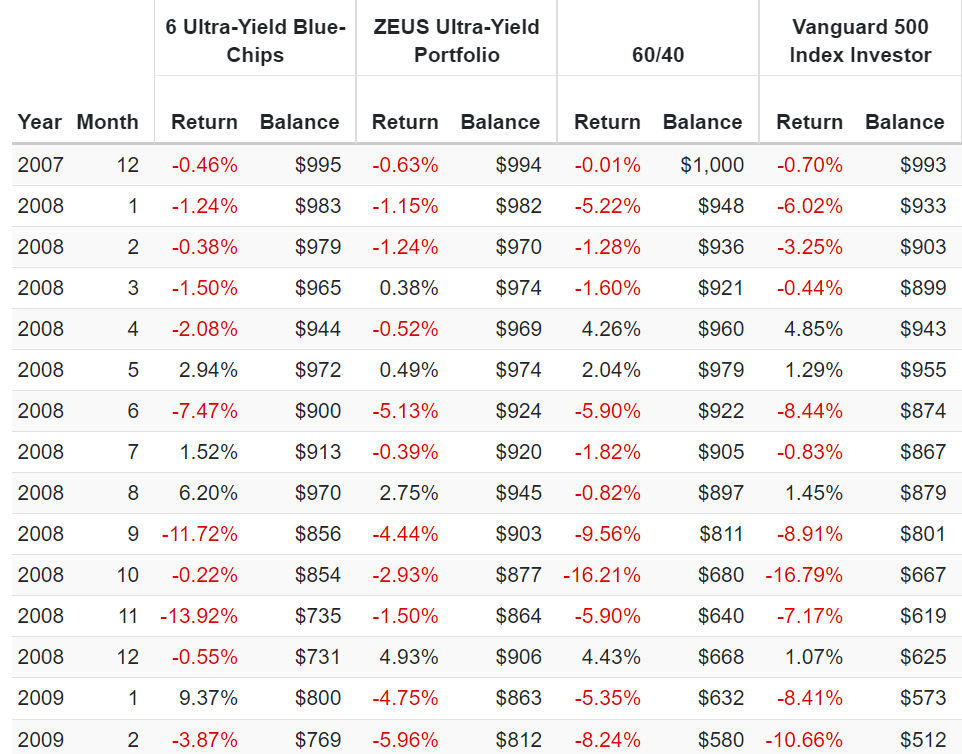
During the Great Recession, the S&P hit a peak intra-day decline of -58% and the 60/40 -44%. ZEUS fell 19%, including:
- Falling 3% in October 2008 when the S&P fell 17% and a 60/40 16%
- 4% in September 2008, when the S&P fell 9%, and the 60/40 fell 10%
The ultimate trial by fire for any sleep-well-at-night retirement portfolio, and ZEUS passed with flying colors.
ZEUS Ultra-Yield During The 2011 Bear Market
(Source: Portfolio Visualizer Premium)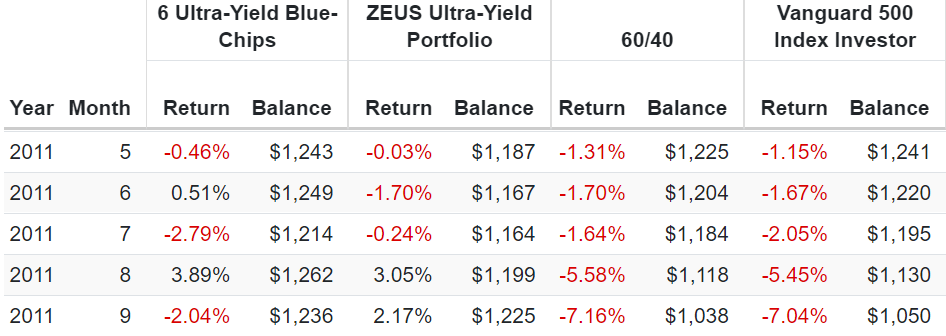
During the 2011 bear market, the S&P hit a peak-intraday low of -22%. ZEUS went up 3%, including a 5.3% rally in August and September when the S&P fell 12% and a 60/40 11%.
- Rising in a bear market? Like riding over a market pothole in a hovercraft
ZEUS Ultra-Yield During The 2018 Bear Market
(Source: Portfolio Visualizer Premium)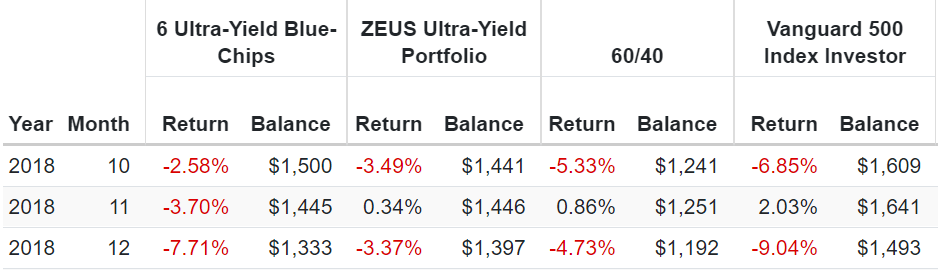
During the 2018 bear market, the S&P’s peak intraday decline was -21%. ZEUS fell a peak of 8%, including falling just 3% during December, when the market fell 9%.
ZEUS Ultra-Yield During The Pandemic
(Source: Portfolio Visualizer Premium)
During the Pandemic, we had the worst oil crash in human history.
Market Insider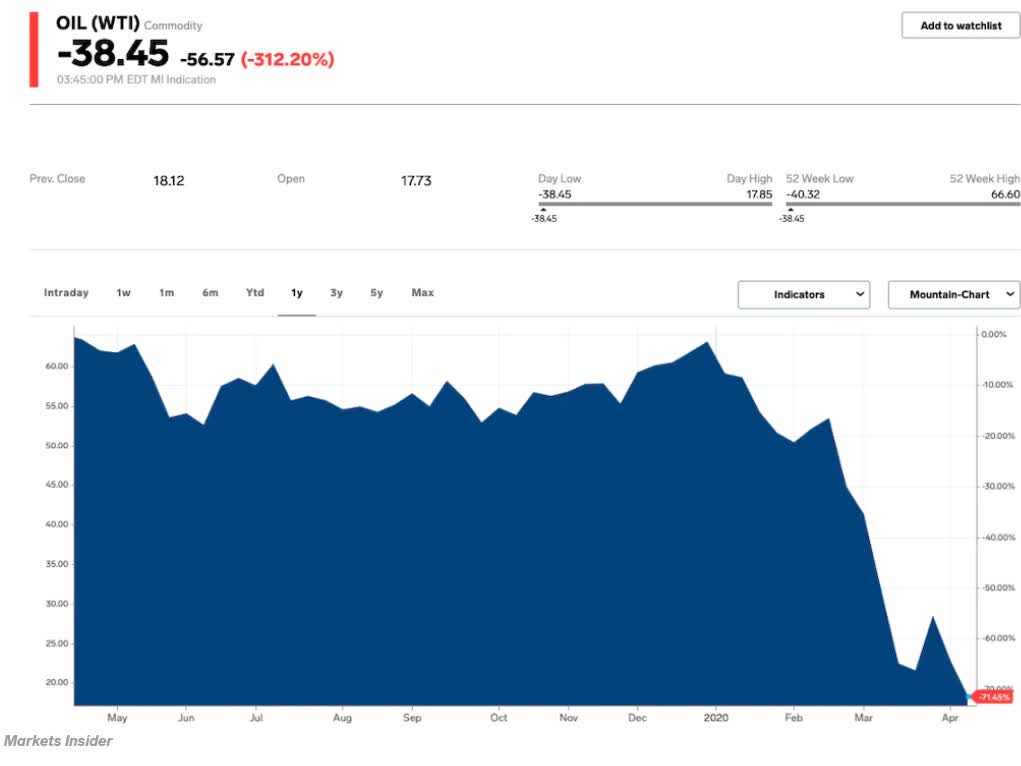
-$38 crude helped cause the ultra-yielding blue-chips to fall 40% in a month. ZEUS fell just 15%, basically the same as a 60/40.
- The most extreme scenario imaginable, and ZEUS still didn’t experience a bear market
ZEUS Ultra-Yield During The 2022 Bear Market
(Source: Portfolio Visualizer Premium)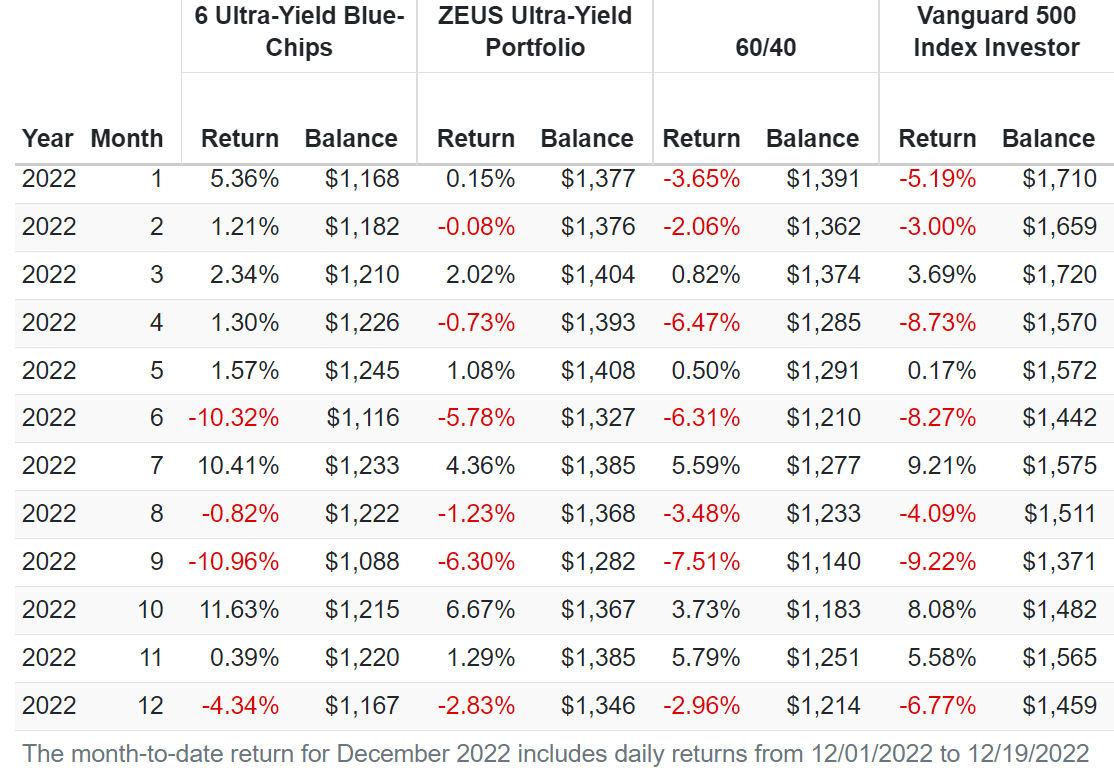
So far in the 2022 stagflation bear market, the peak declines are:
- Nasdaq -35%
- S&P -28%
- 60/40 -21%
- ZEUS Ultra-Yield -9%
That includes falling 6% in September when the S&P fell 9%, 1% in April when the S&P fell 9%, and 3% in December when the S&P is down 7%.
ZEUS Ultra-Yield Vs. 60/40 And S&P During All Bear Markets
| Bear Market | ZEUS Ultra-Yield | 60/40 | S&P |
| 2022 Stagflation | -9% | -21% | -28% |
| Pandemic Crash | -16% | -13% | -34% |
| 2018 | -8% | -9% | -21% |
| 2011 | 3% | -16% | -22% |
| Great Recession | -19% | -44% | -58% |
| Average | -10% | -21% | -33% |
| Average Decline vs. Benchmark | NA | 48% | 30% |
(Sources: Portfolio Visualizer, Charlie Bilello, Ycharts)
An average bear market peak decline of 10%, half that of a 60/40 and 70% less than the S&P 500.
If you want great yield, great returns, and volatility so low it makes grown men weep with joy, then it’s time to harness the power of ZEUS.
Stress Testing The Future
Every registered investment advisor, including Ritholtz Wealth Management, uses some version of Monte Carlo simulations when doing retirement planning.” – Ben Carlson
- long-term Monte Carlo simulation use statistics and past historical returns, and volatility data to run thousands of simulations about what’s likely to happen in the future
- as long as the future isn’t more extreme than the last 15 years, this is the best way to estimate the probability of likely return ranges, volatility, and the probability of achieving your investment goals.
The last 15 years have seen:
- the 2 worst Recessions since the Great Depression
- the 2nd worst market crash in history
- the fastest bear market in history
- the strongest 12-month rally-month history (70%)
- inflation ranging from -3% to 9%
- 10-year treasury bond yields ranging from 0.5% to 6%
- Fed funds rate from 0% to 4.25%
Unless you think the future will be more extreme than this, a 10,000 75-year Monte Carlo simulation is statistically the best way to forecast the likely future.
- a 75-year time horizon provides more extreme ranges of potential outcomes
- the ultimate stress test for a “forever portfolio.”
- If your portfolio does well in a 75-year Monte Carlo simulation, it will likely do even better over shorter time frames
Why?
Is a 50% market crash more likely to happen in the next 10 years? Or the next 75 years?
- The longer the time frame, the more likely we’ll see extreme market conditions
(Source: Portfolio Visualizer Premium)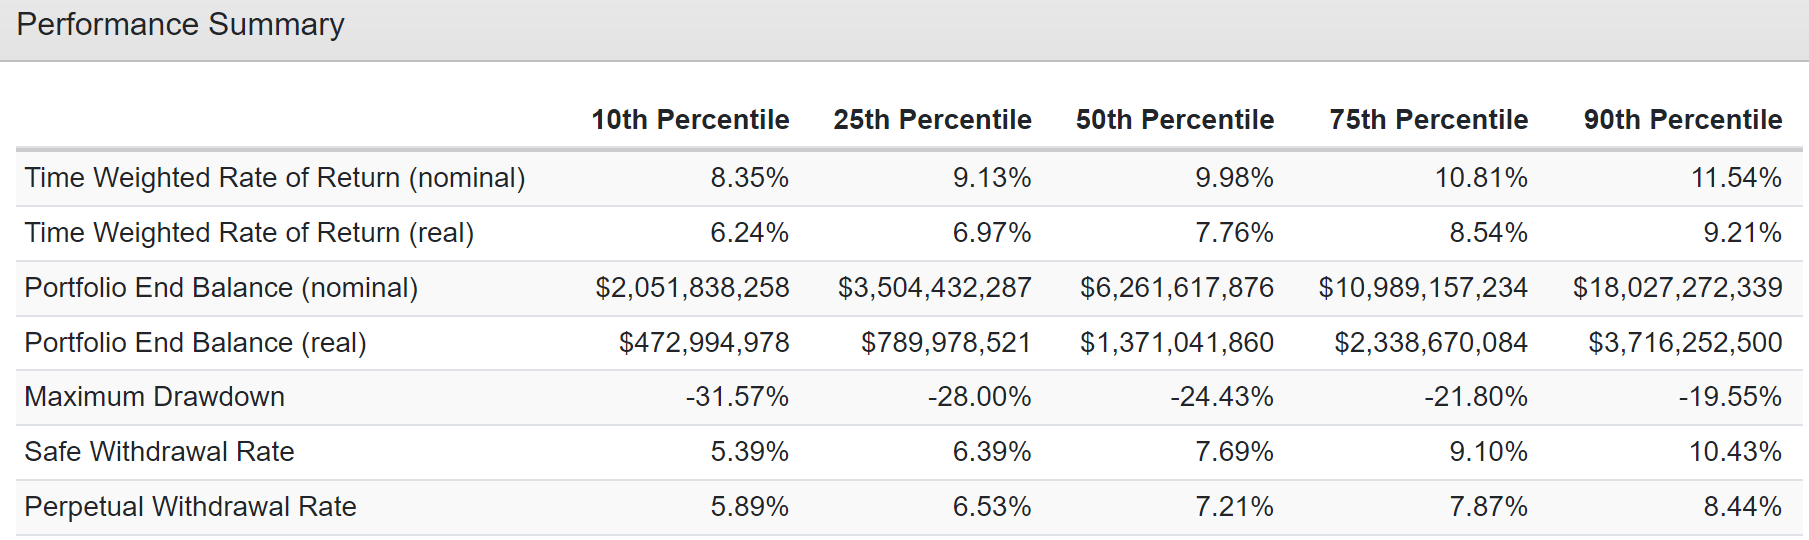
ZEUS Ultra-Yield is 90% statistically like to deliver:
- 8.4% to 11.5% annual returns vs. 10.3% consensus and 7.2% 60/40
- 6.2% to 9.2% inflation-adjusted returns vs. 7.9% consensus and 4.9% 60/40
- a safe withdrawal rate of 5.4% vs. 4.9% consensus and 2.8% 60/40
(Source: Portfolio Visualizer Premium)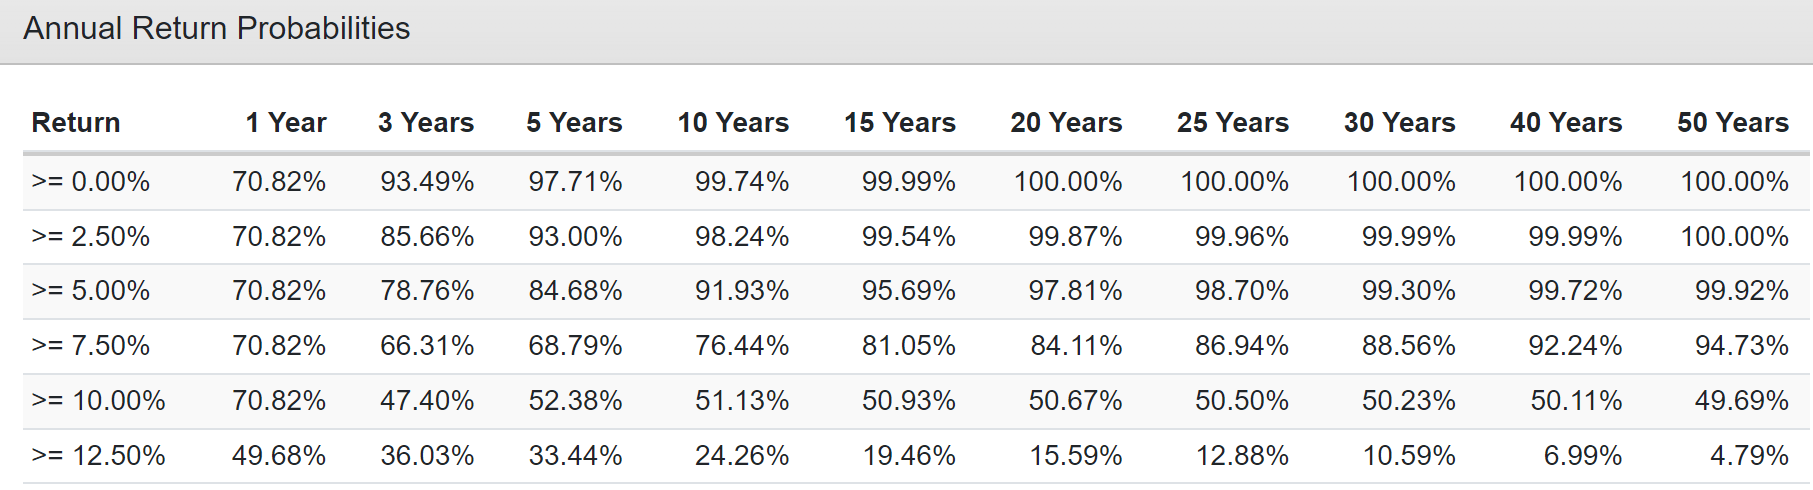
Justin defines success as beating the 60/40 over the long-term to recoup that $1.2 million loss from 2022.
- Which should take approximately 7 years
With ZEUS Ultra-Yield, his chance of success over the next 50 years is 94.73%.
ZEUS Ultra-Yield Bear Market Probability
| Bear Market Severity | Statistical Probability Over 75 Years | 1 In X Probability | Expected Every X Years |
S&P More Likely To Suffer X% Decline In Any Given Year |
| 20+% | 3.43% | 29 | 2,187 | 364 |
| 25+% | 0.93% | 108 | 8,065 | |
| 30+% | 0.27% | 370 | 27,778 | |
| 35+% | 0.02% | 5,000 | 375,000 | |
| 40+% | 0.01% | 10,000 | 750,000 | 15,000 |
(Source: Portfolio Visualizer Premium)
Justin can’t emotionally handle a bear market, and with ZEUS, he doesn’t have to. This portfolio’s probability of a bear market is 3.43% over the next 75 years.
In any given year, it’s 364X less likely to suffer a bear market than the S&P and 15,000X less likely to suffer a 40+% crash.
Bottom Line: Building Your Dream Sleep-Well-At Night Portfolio Isn’t Hard If You Have The Right Tools
Do you want a blue-chip high-yield portfolio that falls half as much as a 60/40 and 70% less during bear markets? Well, here it is. And it’s not hypothetical; this is literally Justin’s $5 million ZEUS Ultra-Yield portfolio.
ZEUS Ultra-Yield Vs. 60/40 And S&P During All Bear Markets
| Bear Market | ZEUS Ultra-Yield | 60/40 | S&P |
| 2022 Stagflation | -9% | -21% | -28% |
| Pandemic Crash | -16% | -13% | -34% |
| 2018 | -8% | -9% | -21% |
| 2011 | 3% | -16% | -22% |
| Great Recession | -19% | -44% | -58% |
| Average | -10% | -21% | -33% |
| Average Decline vs. Benchmark | NA | 48% | 30% |
(Sources: Portfolio Visualizer, Charlie Bilello, Ycharts)
This is what I mean by Zen Extraordinary Ultra SWAN, a portfolio consisting of 100% blue-chip assets, the best of the best and the safest of the safe.
This is what combining SCHD, EDV, DBMF, MO, EPD, MPLX, MMP, LGGNY, and MAIN gets you.
- a safe 6.1% yield = 3X that of a 60/40
- a historical and expected future 10.3% long-term return matching the S&P 500
- but with 40% lower annual volatility
- and 70% smaller declines than the S&P in bear markets
- 50% smaller decline than a 60/40 during bear markets
- can recoup a 21% loss in a 60/40 in approximately 7 years
- and deliver 140% higher inflation-adjusted returns over a 30-year retirement
If the 2022 bear market has hammered you, you’re not alone. Justin is one of the best businessmen I know, and he lost $1.2 million because he panic sold at the wrong time.
But just as I’ve helped Justin build the ultimate $5 million ultra-yield sleep-well-at-night retirement portfolio for his needs, you can do the exact same thing.
It’s not magic; it’s pure blue-chip math and prudent risk management.
CNBC
35% of millionaires, and 45% of all Americans, think it will “take a miracle” for them ever to retire. Justin is one of these people.
It doesn’t take a miracle, sorcery, or any form of black magic.
You don’t have to pray for luck on Wall Street or beg for salvation from the fickle market gods.
All it takes is the right blue-chips, and ETFs and you can take charge of your financial destiny, retire in safety and splendor, and laugh at all future bear markets.
From everyone at Dividend Kings and iREIT, I want to wish you and yours a safe, healthy, and joyous holiday season:)
Editor’s Note: This article discusses one or more securities that do not trade on a major U.S. exchange. Please be aware of the risks associated with these stocks.
Be the first to comment