

Oko_SwanOmurphy/iStock via Getty Images
This is part three of my series responding to the most common bear cases against SoFi (NASDAQ:SOFI). Nobody can truly build a true bull case understanding risks and arguments against investing in a company. I think it is imperative to address bear arguments and acknowledge the downside to any investment.
There are four species of SoFi bear: dilutionist, loaner, profiteer, and moater. The dilutionist argues that SoFi heavily dilutes their shareholders and will lead to minimal returns. In part one I took a deep dive into dilution and stock-based compensation. The loaner bear is focused on the government’s continued interventions into student loans, which used to be SoFi’s most important product. Part two handled most everything you want to know about student loans. Profiteers are hyper-focused on EPS positivity and free cash flow, and abhor any type of debt. They look at those numbers and immediately conclude that SoFi is uninvestable. The moaters believe that everything that SoFi does can be easily replicated and they have no competitive advantage. I’ll speak to SoFi’s moat in a future article. Today we are going to put SoFi’s profitability and balance sheet under the microscope.
A typical profiteer argument usually looks something like this: How can you possibly invest in an unprofitable company in the current environment? Cash is king. Have you looked at their balance sheet? They have almost $5B in debt, which is almost as much as their entire market cap, and they are losing over $100M per quarter. That’s totally unsustainable and they are going to have to do offering after offering to keep it afloat. Not to mention all that debt is going to have to be refinanced at higher interest rates in the current environment. Have fun riding this stock to bankruptcy, it’s like you can’t even read a balance sheet!
All of these arguments distort the truth and show a fundamental misunderstanding of the way SoFi operates. I will cover the balance sheet in detail, discussing each of the items mentioned above to figure out how stable SoFi’s financial footing is.
A Word About Profitability
To start, I completely understand if anybody is unwilling to invest in a company that is not profitable as measured by Generally Accepted Accounting Principles (GAAP) Net Income. If that is not something you feel comfortable with then that is totally fine with me. Simultaneously, I hope those people acknowledge that just because a young company is not currently profitable, that does not mean that it is uninvestable. There are a lot of companies that took years to get to profitability that ended up being excellent investments. Amazon (AMZN) is the most famous, as they only turned a profit in 2004, a full decade after they were founded, and 7 years after they went public. There are plenty of other examples including FedEx (FDX) and Tesla (TSLA) that took over 5 years before turning a profit that have ended up being excellent investments. There are also thousands of companies that went bankrupt or were acquired before getting to profitability, so there is plenty of risk involved.
I am also well aware that in order for a company to be worth anything in the long term that profitability is absolutely necessary. In theory, the share price of a company should be equal to all future cash flows of that company discounted to today’s value. A company that never makes money truly is uninvestable.
Is SoFi on Stable Financial Footing?
Let’s start with the most obvious question. If SoFi isn’t making money, are they at risk of going out of business? To answer this (spoiler alert: no, they aren’t), let’s see how long SoFi has until it will become profitable and then we’ll look at their balance sheet, free cash flow, burn rate, and cash reserves to see if they can last that long without having to raise more cash.
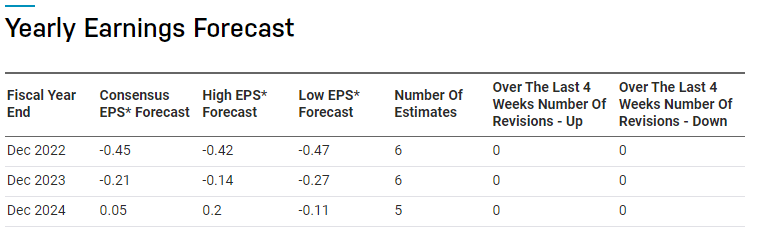
Yearly Earnings Forecast for SoFi (nasdaq.com)
If we assume that the analysts are correct, the consensus is that they will start turning a profit in 2024. Let’s be ultra conservative and say that it might take them 10 quarters to get there (so they wouldn’t break even until 1Q25). Can they make it that long with current cash reserves?
Debt
One important thing to remember is that SoFi is a bank. If you are used to looking at balance sheets from software and technology companies you need to recalibrate the way you analyze the data. Banks operate with a different paradigm, and everything about their assets, liabilities, and cash flows needs to be understood with proper context.
Peter Lynch is one of my investing role models. He once said “It is very hard to go bankrupt if you don’t have any debt.” The first step to assessing SoFi’s financial runway is to determine how much debt they have and when it’s due. One of the things I look for in an investment is a company with low debt, so you might be surprised to see that SoFi has a lot of debt on their balance sheet.
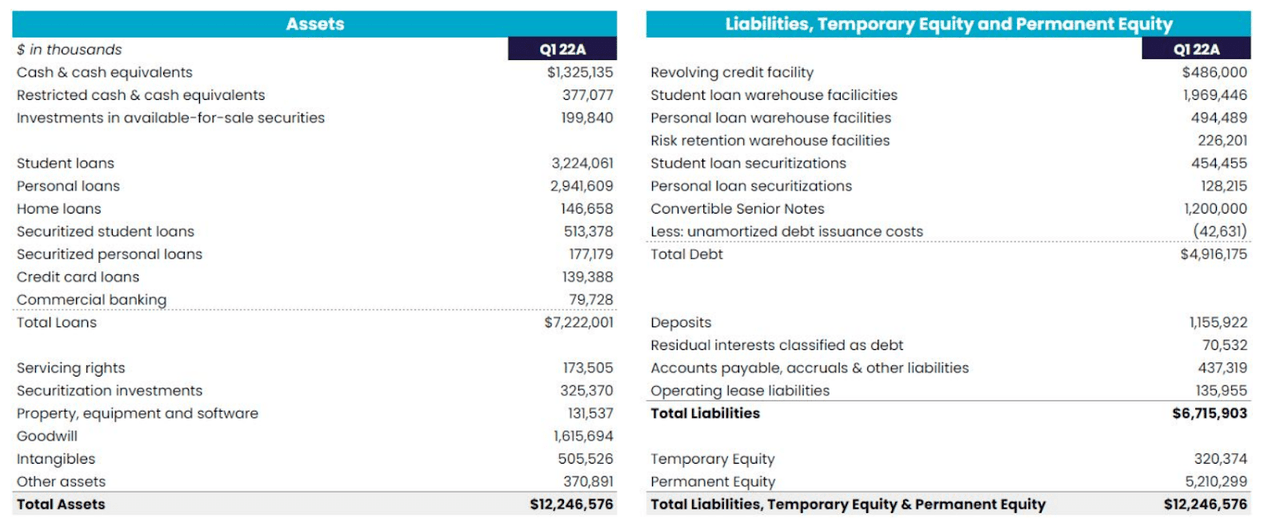
1Q22 Balance Sheet (SoFi)
$4.92B would seem to be a lot of debt for a company whose total yearly revenue is approximately $1.5B. Context is very important here. SoFi’s bread and butter is lending, which accounts for roughly 75% of their revenue right now. They lend money, collect interest on those loans for a while, and then package the loans up as a security and sell them on the debt market at a profit. Lending is very capital intensive and until January, SoFi did not have its bank charter and could not use deposits as collateral for loans. So before 2022, some of the money they loaned out came from SoFi’s own cash reserves, but most of it came from warehouse facilities.
A warehouse facility is just a line of credit SoFi can use to fund originations. SoFi pays about 2-6% (the recent average is somewhere around 3.75%) in interest to borrow the money and then lend it out at a higher rate to fund student loans and personal loans. They do not draw upon these lines of credit for any other reason. It’s important, therefore, to realize that every dollar they have in debt on their balance sheet from warehouse facilities is actually making them money because it’s funding a loan that they are making interest on. Those loans are accounted for as assets and also appear on the balance sheet. All the debt for securitizations is similarly backed by loan securitizations.
It needs to be accounted for as debt because that is in fact what it is, they have borrowed that money and will need to pay it back. However, this is a very different kind of debt because it is backed by a tangible asset. Carrying that debt is just the cost of doing business and they pay off the debt as soon as they sell the loan. I call this “cost-of-business debt” and define it as debt backed 100% by funded loans they hold on their books that are making them money. In 1Q22, they made 4% net interest on their student loans and 11% net interest on their personal loans (net interest is the difference between what they are charging for their loans and what they are paying to borrow the money). So if we remove “cost-of-business debt” that leaves the $1.2B convertible senior notes and the $486M in revolving credit facilities.
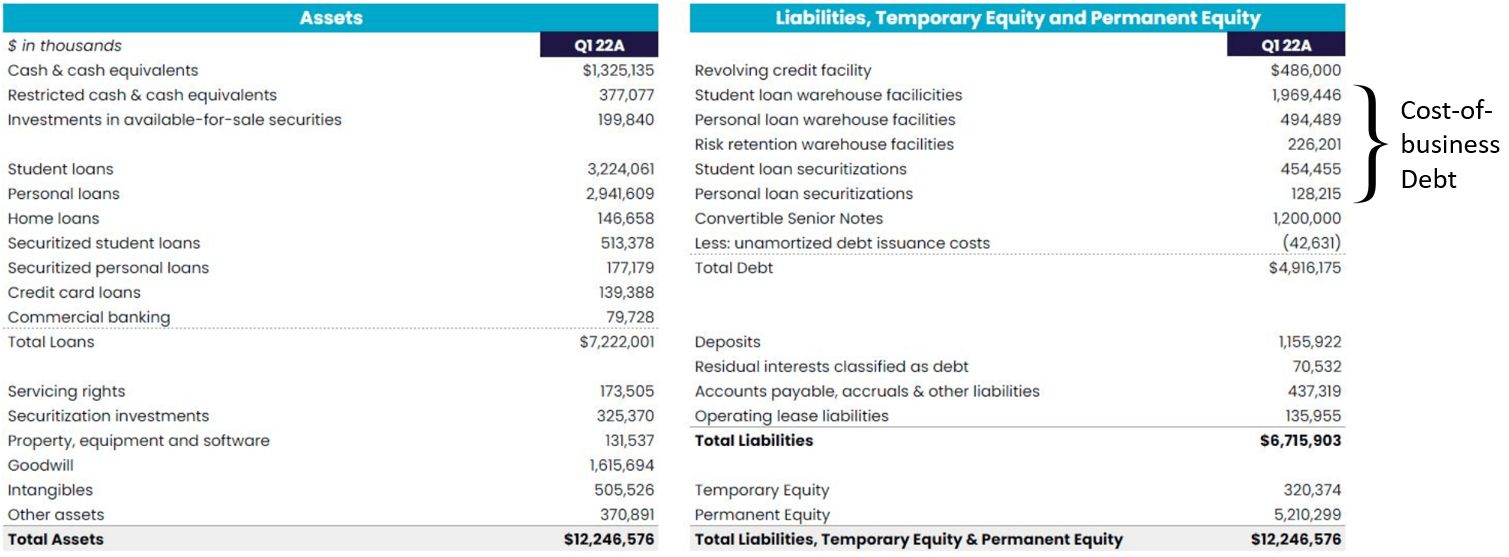
1Q22 Balance Sheet (SoFi)
The $1.2B in senior convertible notes have 0% interest and aren’t due until October 2026. That should be well into their 3rd year as a profitable company. Also, paying 0% interest for 5 years (the notes were issued in October 2021) with current inflation seems like a pretty good piece of business. For a deep dive into those notes, might I suggest reading this excellent article.
That leaves the $486M revolving credit facility which comes due in September of 2023 as their only debt that is due before they become profitable. A cash-to-debt ratio of 2.7 before profitability is more than large enough to cover that debt as long as they do not have too high of a cash burn. So what is their current cash burn?
How To Understand SoFi’s Cash Flows
This might be elementary for people who are used to looking at cash flows and balance sheets, but I want to break this down because it is often very misunderstood, especially for lenders. The first point to understand is that net income, free cash flow, and cash burn rate are all separate things.
Net Income
First of all, SoFi’s GAAP net income for 1Q22 was -$110M. So that means their cash position dropped by $110M between 4Q21 and 1Q22, right? Not at all. There are non-cash expenses that get accounted for in GAAP income but don’t actually take the company’s cash. Stock-based compensation (SBC) is one example. In 1Q22, SBC was $77M. They gave away $77M in stock, which is accounted for as a loss in net income, but doesn’t actually change their cash reserves. If SBC were the only adjustment, they would have burned $110M – $77M = $33M in 1Q22. There are other non-cash items they have to account for too (amortization, depreciation, gains and losses on investments, etc.), but the point is that net income does not mean that’s how much cash they spent.
Free Cash Flow
Finannceclap.com
I must be looking for free cash flow (FCF). FCF is calculated as the Net Operating Profit after Taxes – Capital Investments. Net Operating Profit after Taxes excludes all those non-cash items we just discussed so that must be the right way to measure SoFi’s burn rate. So I calculated Sofi’s FCF and came up with -$1.04B in 1Q22.
Your immediate response is (and should be) that that is inconceivably high for a company whose total market cap has been hovering between $5-6B. If SoFi burns through $1B of cash every quarter they will be bankrupt in no time flat, especially since they started 2022 with only $495M in cash and cash equivalents, right? Wrong again. Looking at the 1Q22 balance sheet, you’ll see that they had $1.325B in cash and cash equivalents. SoFi didn’t raise a single dollar through any type of equity or debt offerings those three months, so how in the world can they have a FCF of -$1.04B and simultaneously bolster their cash reserves by $830M? It’s because while FCF is an excellent metric for measuring software companies, it’s a terrible metric to focus on for a bank. Take a look at JPMorgan Chase’s (JPM) quarterly free cash flow over the last 5 years:
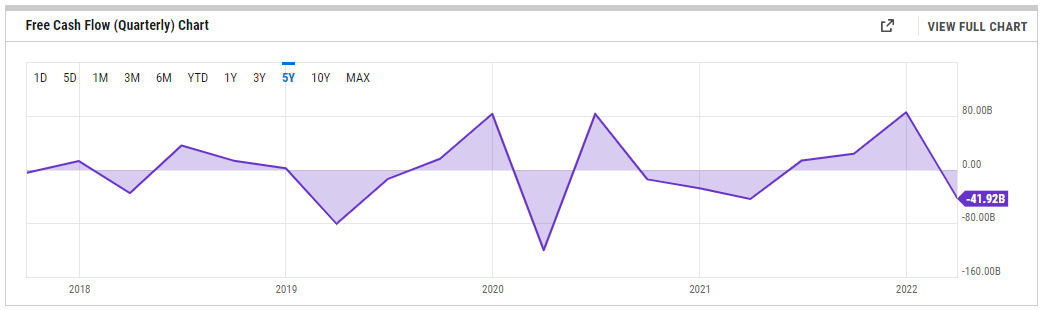
Quarterly Free Cash Flow for JPMorgan Chase (YCharts)
JPM’s FCF has fluctuated between -$120B and +$83B and shows no trend at all. Now let’s compare that graph to JPM’s book value over that same time period. Remember that banks are often evaluated based on their Price:Book ratio.
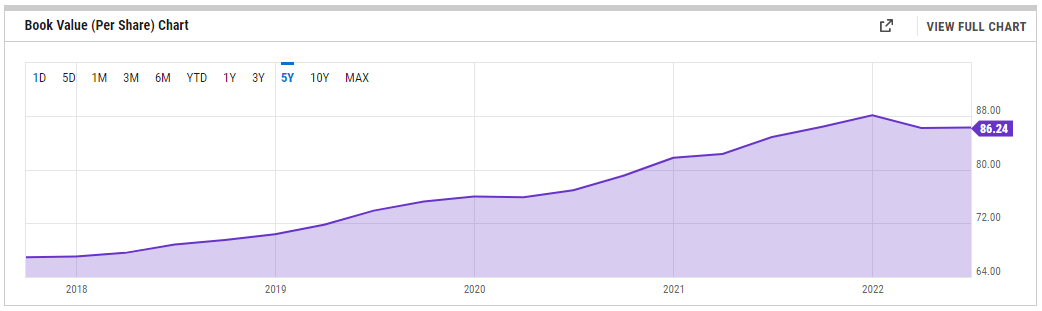
Quarterly Book Value for JPMorgan Chase (YCharts)
Free cash flow in any one quarter tells you absolutely nothing about a bank because loans are like inventory, and they don’t get put on the books and taken off the books at a constant rate. Those fluctuations are part of operating cash, so they make the FCF highly volatile and not very instructive.
It’s easiest to understand this with an analogy in retail sales. Let’s say I run a department store. To make the math easy, let’s say I do $11M in sales in Q1, Q2, and Q3 and $33M in sales in Q4 because of Christmas and my margins are always 10%. Every quarter I need to refresh my inventory and purchase $10M of stuff to get $11M in sales. For this example, just assume inventory is my only expense.
|
Revenue |
Purchased Inventory |
FCF |
|
|
1Q |
$11M |
$10M |
$1M |
|
2Q |
$11M |
$10M |
$1M |
|
3Q |
$11M |
$30M |
-$19M |
|
4Q |
$33M |
$10M |
$23M |
In Q1, I sell $11M in inventory and buy $10M of stuff for Q2, I do this again in Q2. In Q3, I sell $11M of stuff but I have to buy $30M of inventory for Q4. In Q4 I sell my inventory for $33M and buy $10M for the next Q1. My free cash flow for each quarter is $1M, $1M, -$19M, and $23M. If you look at that -$19M quarter out of context, it looks bad. But the business is actually working the way it is supposed to and having negative FCF in Q3 makes sense.
Loans work the same way. If SoFi originates more loans in a quarter than they sell on the debt market, the FCF for that quarter looks terrible even though it’s actually a good thing. Originating more loans is what makes them more money. This is often the case right now because they are growing and hopefully they will be originating more loans in each new quarter than the quarter before.
The discrepancy between originations and loan sales is exacerbated right now because they are increasing the length of time they are holding their loans before selling them from 3 months to 6 months. They are doing this as a result of acquiring the bank charter, which allows them to use their deposits as collateral to originate loans. They originated over $2B in personal loans in 1Q22 but sold less than $1B because they are extending their holding times. So it makes even more sense for them to have such negative FCF right now. This is by design and it’s good for the company. Extending their holding periods makes them more interest revenue before they sell the loans, increasing the revenue and profit margins on each dollar of loans they originate.
SoFi’s War Chest
That still doesn’t explain how they conjured $830M from the ether between 4Q21 and 1Q22. This happened during a quarter where they had -$110M in net income and didn’t raise any external cash through convertible notes or dilution or any other method. Let’s return to the last two quarters’ balance sheets to learn an important lesson about SoFi.
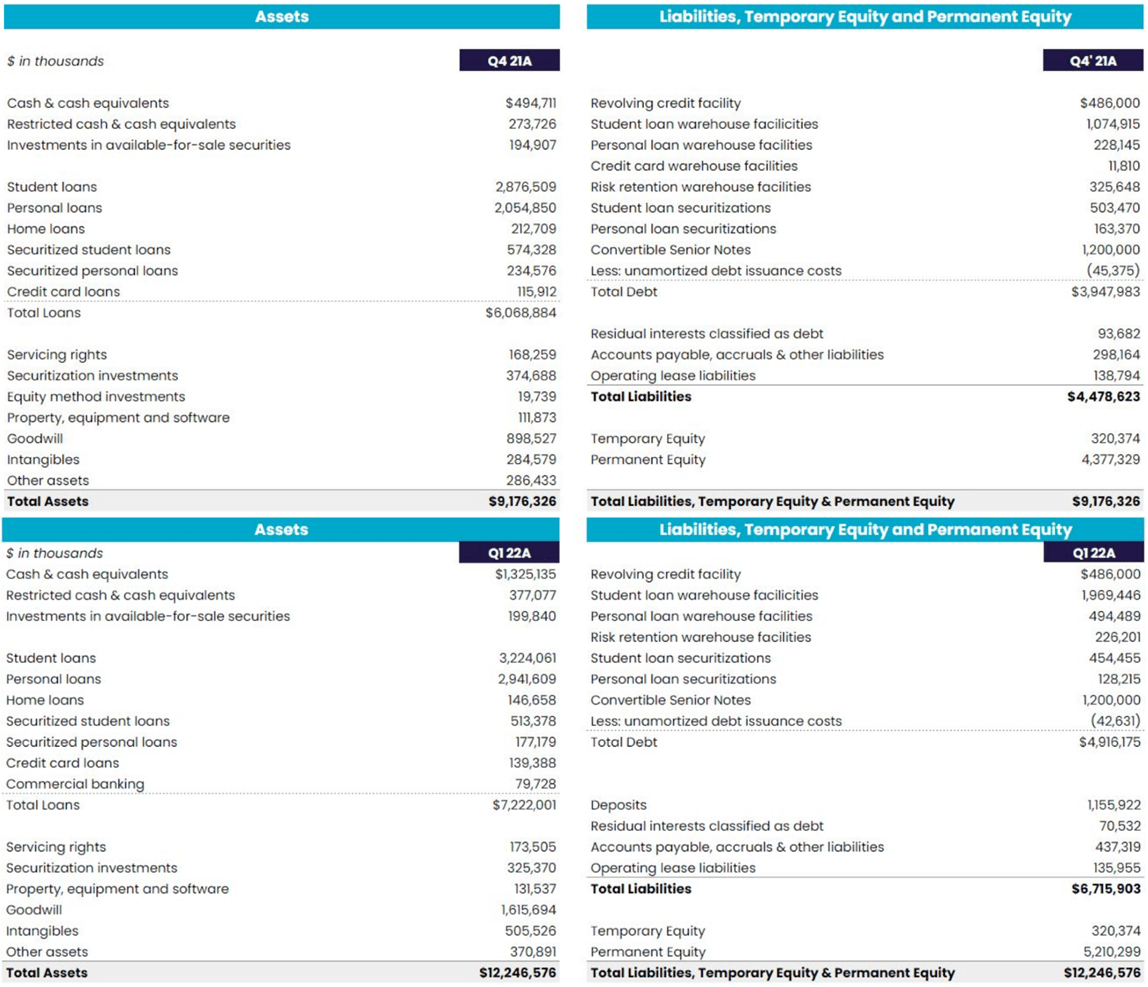
Comparison of 4Q21 and 1Q22 Balance Sheets (SoFi)
In 4Q21, SoFi only had two buckets that they could use to fund originations, their warehouse facilities (what I referred to above as cost-of-business debt) and their own capital. In 1Q22, they received their bank charter, which adds a new bucket for them to originate loans from: their deposits. In 4Q21 they had $6.07B of loans as assets and in 1Q22 they had $7.22B of loans. The breakdown for how they funded those loans is as follows (the table is in $1000s):
|
4Q21 |
1Q22 |
Difference |
|
|
Total Loans |
$6,068,884 |
$7,222,001 |
$1,153,117 |
|
Cost-of-business Debt |
$2,307,358 |
$3,272,806 |
$965,448 |
|
SoFi Capital |
$3,761,526 |
$2,793,273 |
($968,253) |
|
Deposits |
$0 |
$1,155,922 |
$1,155,922 |
So that $830M in extra cash and cash equivalents came from capital that used to be funding loans that was offset by deposits and some additional warehouse facilities. This highlights something else that the profiteers miss. SoFi’s war chest is actually much bigger than its current cash and cash equivalents, and they have $2.8B in capital that can be converted to cash in addition to the $1.3B in cash and cash equivalents they currently have. The total funds that they could convert to cash inside of 6 months if needed is $4.3B.
SoFi’s Burn Rate
So we’ve established that Net Income and Free Cash Flow are both poor approximations for SoFi’s burn rate and detailed the reasons why. Because they are a financial institution there really is not a perfect approximation for cash flow, but I think the one that comes closest is EBITDA – Capital Expenditures – Mandatory Debt Payments. This removes the non-cash expenses that skew net income and the loan inventory aspect that plagues FCF calculations for lenders while still accounting for capital expenditures. By this measure, SoFi’s cash flow for 1Q22 was an extremely manageable -$16.43M.
After removing the $486M from the revolving credit facility from their current cash position of $1.325B, SoFi has 51 quarters or more than 12 years of cash reserves at their current burn rate. That is not including the extra $2.8B in reserves that they are currently using to fund loans. In other words, they will easily last until they are profitable. Their balance sheet is much stronger than anyone gives them credit for. They have no need to raise cash via offerings or take on any further debt. Current projections actually mean that by this cash flow metric, they should begin generating positive cash flow by 3Q22.
Balance Sheet and Cash Flow Takeaways:
-
SoFi should reach GAAP profitability by 2024
-
The large total of debt on the balance sheet is misleading since the majority of it is used to fund loans
-
GAAP net income and especially Free Cash Flow do a poor job of estimating cash flow for SoFi
-
They have extra cash reserves used to originate loans that can be drawn upon if needed
-
The best proxy for a SoFi’s cash flow is EBITDA – Capital Expenditures – Mandatory Debt Payments
-
SoFi has about a decade of capital available at their current burn rate
-
Their cash flow will be positive starting this year
Reasons to Invest
The fact that they aren’t going out of business is not a reason by itself to invest in anything. I don’t want to invest in a business that just survives. I want one that thrives. SoFi’s business is thriving and you can purchase that entire business for next to nothing. At the time of writing, SoFi has a market cap of $5.66B and its book value is $5.21B (and book value has increased every quarter since going public). SoFi is priced barely over what it owns right now in assets not even accounting for any future cash flows. All SoFi has to do to maintain its value is not go out of business and not lose significant amounts of money. At these prices, if you discount the book value, it means the market believes that SoFi’s business, which will generate $1.5B in revenue (50% annual growth) and $100M of EBITDA (300% growth) in 2021 is only worth $450M. The risk reward ratio is very skewed toward high rewards right now.
Conclusion
SoFi’s balance sheet is often misunderstood or misinterpreted by those who are not familiar with analyzing banking financials. Their cash position is similarly mischaracterized by people who do not understand that they have intentionally used their liquidity to fund loans and that they can convert those positions to cash within a few months if needed. A deep dive into their financial situation reveals a company with billions in cash and liquid assets and extremely low long-term debt. SoFi is well positioned to withstand any financial storm. I have been dollar cost averaging into SoFi and other high-quality names as funds have become available and will continue to do so as long as the business fundamentals continue to strengthen. SoFi remains one of my highest conviction holdings and the more I research, the more convinced I am that the risks are shrinking and at the same time the potential for outsized returns keep growing.
Be the first to comment