


Deagreez
This article was published on Dividend Kings on Wednesday, Dec. 7.
Never being able to retire... ever. That’s one of the biggest fears of investors. In fact, according to a survey from Natixis Asset Managers, 45% of Americans think it would “take a miracle” for them ever to be able to retire. That’s horrifying, but you might be shocked to find that this fear is shared by 35% of millionaires.
CNBC
This week I showed you how you could easily and safely potentially grow your retirement income overnight with eight high-yield blue chips.
But what if that’s not enough to reach your retirement goals? What if your income and savings are small, and even with 10, 20, or 30 years, you fret about being able to retire in comfort and dignity, never mind safety and splendor?
Might 4X, 5X, or even 6X the retirement income help you achieve your retirement dreams? You bet it would!
But how on earth can you 6X your retirement income without taking on crazy risks?
What if I told you that there was a way to potentially 6X your retirement income using just Ultra SWAN (sleep well at night) quality world-beater blue chips?
It’s true, and it involves such legendary defensive high-yield aristocrats as British American (BTI), Altria (MO), and Enbridge (ENB).
High-yield aristocrats have been a staple of retirement portfolios for decades, so this isn’t surprising.
But let me show you why adding hyper-growth Ultra SWANs like Amazon (NASDAQ:AMZN), Lowe’s (NYSE:LOW), and Mastercard (NYSE:MA) is the best way to turbocharger your retirement income to truly spectacular levels.
Yield + Growth: A Combination Made In Rich Retirement Heaven
I’m using these six Ultra SWANs because we own them in the Dividend Kings ZEUS Income Growth portfolio.
DK ZEUS Income Growth Portfolio
| Stock | Yield | Growth | Total Return | Weighting | Weighted Yield | Weighted Growth | Weighted Return |
| QQQM | 0.7% | 11.9% | 12.6% | 16.67% | 0.1% | 2.0% | 2.09% |
| SCHD | 3.5% | 7.6% | 11.1% | 16.67% | 0.6% | 1.3% | 1.85% |
| EDV | 4.1% | 0% | 4.1% | 16.67% | 0.7% | 0.0% | 0.68% |
| DBMF | 9.5% | 0% | 9.5% | 16.67% | 1.6% | 0.0% | 1.58% |
| AMZN | 0.0% | 19.2% | 19.2% | 5.56% | 0.0% | 1.1% | 1.07% |
| LOW | 2.0% | 20.6% | 22.6% | 5.56% | 0.1% | 1.1% | 1.26% |
| MA | 0.6% | 23.2% | 23.8% | 5.56% | 0.0% | 1.3% | 1.32% |
| BTI | 7.0% | 10.4% | 17.4% | 5.56% | 0.4% | 0.6% | 0.97% |
| ENB | 6.1% | 5.1% | 11.2% | 5.56% | 0.3% | 0.3% | 0.62% |
| MO | 8.4% | 5.0% | 13.4% | 5.56% | 0.5% | 0.3% | 0.74% |
| Total | 4.2% | 10.3% | 14.5% | 100.00% | 4.3% | 7.9% | 12.2% |
(Source: DK Research Terminal) HASI will be added in a few weeks.
How impressive are these fundamentals?
ZEUS Income Growth Portfolio Vs. 60/40
| Metric | 60/40 | ZEUS Income Growth Portfolio | X Better Than 60/40 |
| Yield | 2.25% | 4.30% | 1.91 |
| Growth Consensus | 5.1% | 7.90% | 1.55 |
| LT Consensus Total Return Potential | 7.4% | 12.2% | 1.66 |
| Risk-Adjusted Expected Return | 5.1% | 8.5% | 1.66 |
| Safe Withdrawal Rate (Risk And Inflation-Adjusted Expected Returns) | 2.9% | 6.3% | 2.18 |
| Conservative Time To Double (Years) | 25.0 | 11.5 | 2.18 |
(Source: DK Research Terminal, FactSet)
Almost 2X the yield of a 60/40, 66% better long-term return potential, and more than double the safe withdrawal rate.
What about young investors who want low volatility but an alternative to the S&P 500?
ZEUS Income Growth Portfolio Vs. S&P 500
| Metric | S&P 500 | ZEUS Income Growth Portfolio | X Better Than S&P 500 |
| Yield | 1.70% | 4.3% | 2.53 |
| Growth Consensus | 8.5% | 7.9% | 0.93 |
| LT Consensus Total Return Potential | 10.2% | 12.2% | 1.20 |
| Risk-Adjusted Expected Return | 7.1% | 8.5% | 1.20 |
| Safe Withdrawal Rate (Risk And Inflation-Adjusted Expected Returns) | 4.9% | 6.3% | 1.29 |
| Conservative Time To Double (Years) | 14.8 | 11.5 | 1.29 |
(Source: DK Research Terminal, FactSet)
ZEUS Income growth is also superior to the S&P 500 in every fundamental metric.
Why bother owning growth stocks in a high-yield portfolio? Heck, Amazon doesn’t even pay a dividend (one day, it will if it grows as expected).
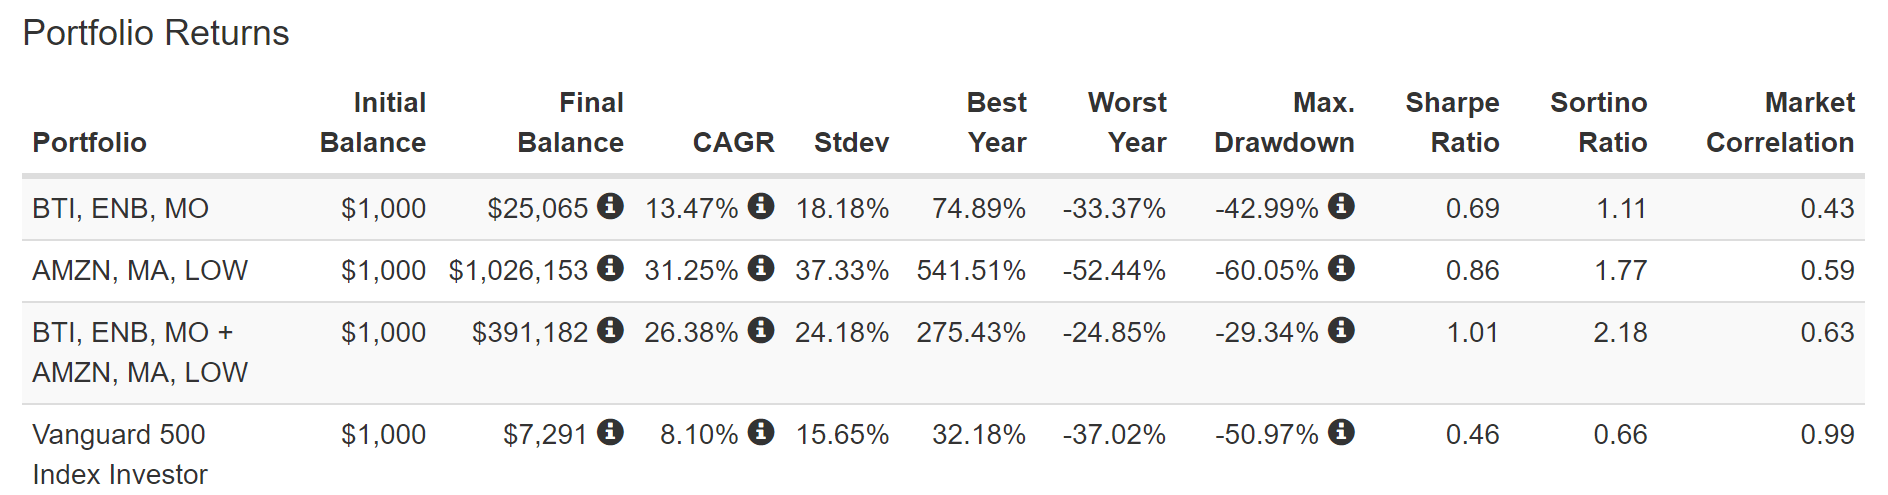
Historical Returns Since June 1997 (Annual Rebalancing)
Portfolio Visualizer Premium
High-yield Ultra SWAN aristocrats like BTI, ENB, and MO have delivered 13% to 14% returns over the last quarter century.
The hyper-growth Ultra SWANs delivered Buffett-like returns. But look at what happens if you combine high-yield aristocrats and Ultra-SWAN hyper-growth!
You double the already impressive returns of the aristocrats and achieve a 391X return.
- 54X better returns than the S&P 500
- and 16X better than the high-yield aristocrats
OK, but I promised you 6X more retirement income, so how does that work?
Income Growth Rich Retirement Dreams Are Made Of
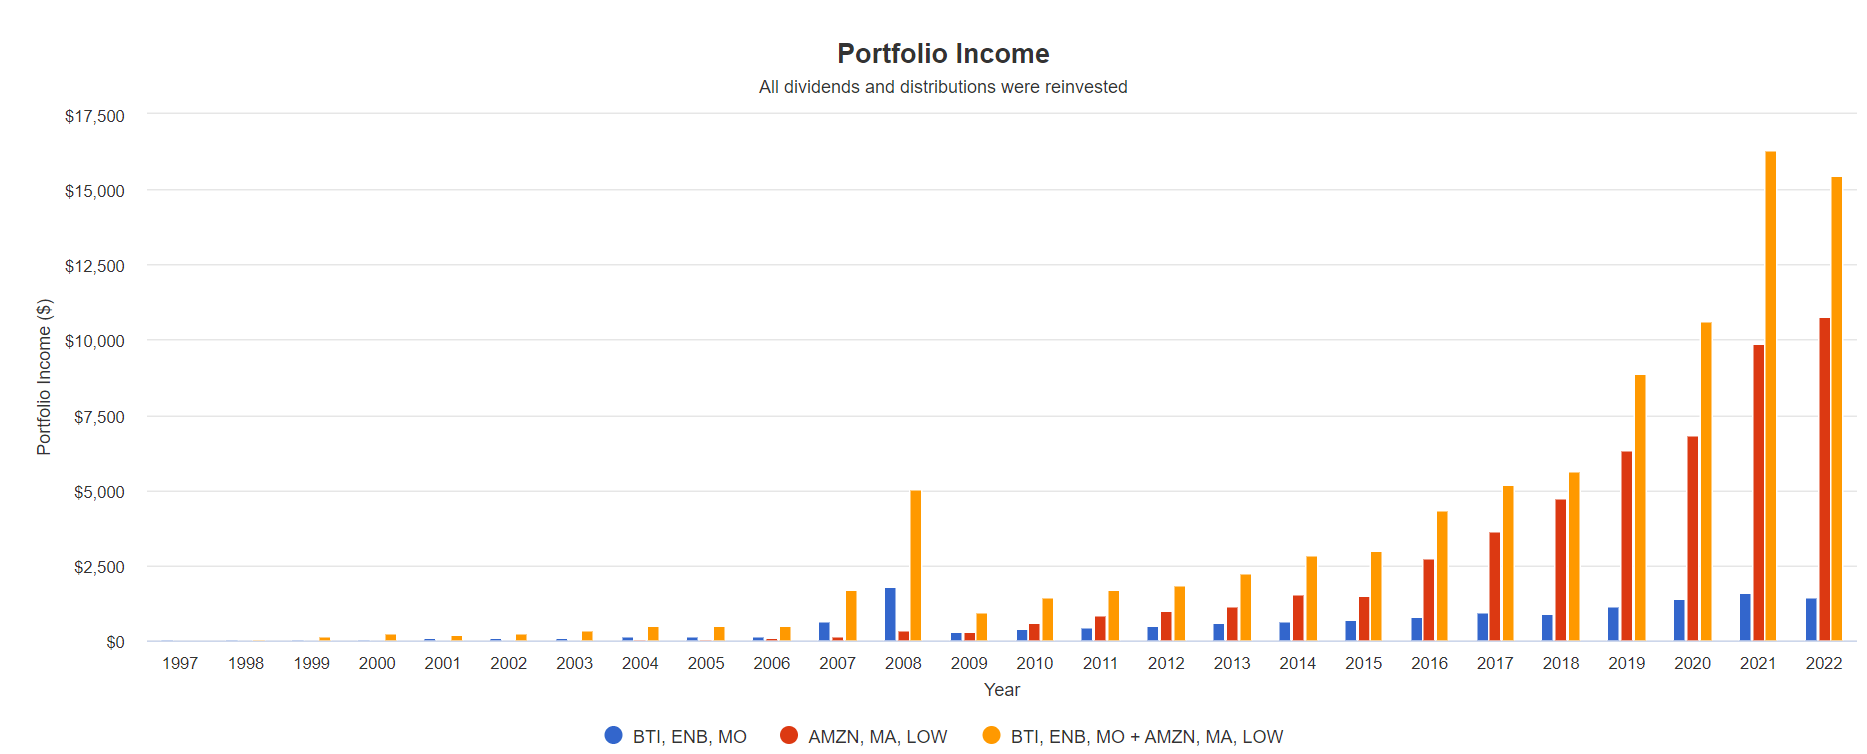
2007 and 2008 were 3 MO Spinoffs (Portfolio Visualizer Premium)
Cumulative Dividends Since 1997 Per $1,000 Initial Investment
| Metric | BTI, ENB, MO | AMZN, LOW, MA | BTI, ENB, MO, AMZN, LOW, MA |
| Total Dividends | $15,719 | $55,917 | $95,102 |
| Total Inflation-Adjusted Dividends | $8,405.88 | $29,902.14 | $50,856.68 |
| Annualized Income Growth Rate | 15.2% | 42.6% | 29.9% |
| Total Income/Initial Investment % | 15.72 | 55.92 | 95.10 |
| Inflation-Adjusted Income/Initial Investment % | 8.41 | 29.90 | 50.86 |
| More Inflation-Adjusted Income Than BTI, ENB, MO | NA | 3.56 | 6.05 |
| Starting Yield | 5.6% | 0.2% | 3.0% |
| Today’s Annual Dividend Return On Your Starting Investment (Yield On Cost) | 192.9% | 1436.9% | 2060.6% |
| 2022 Inflation-Adjusted Annual Dividend Return On Your Starting Investment (Inflation-Adjusted Yield On Cost) | 103.2% | 768.4% | 1101.9% |
(Source: Portfolio Visualizer Premium)
The high-yield aristocrats did a phenomenal job generating income, with a 5.6% starting yield and 15% annual income growth.
- the inflation-adjusted yield on cost is now over 100%
- more than double your inflation-adjusted investment in annual dividends
But the hyper-growth Ultra SWANs delivered 43% annual income growth, even with Amazon not paying a dividend.
- 768% inflation-adjusted yield on cost
- almost 4X more income from hyper-growth than from high-yield aristocrats
But look at what happens when you combine high-yield aristocrats and hyper-growth Ultra SWANs.
- 30% annual income growth for a quarter century.
- 51X your initial investment back in inflation-adjusted dividends
- 1101% inflation-adjusted yield on cost
- 6X more inflation-adjusted income than the high-yield aristocrats alone
Yield + Growth always results in maximum long-term income. Why?
- hyper-growth blue chips will always generate superior long-term wealth creation
- annual rebalancing will use this to buy a lot more high-yield blue chips than you could ever afford to buy on your own
- Amazon, Mastercard, and Lowe’s were funding massive high-yield aristocrat buys over the decades
- especially during bear markets when yields were highest
In other words, combining yield plus growth gives you triple income compounding.
- high-yield blue chips grow their dividends exponentially
- dividend reinvestment buys you exponentially more high-yield blue-chips
- growth stock outperformance buys you exponentially more high-yield blue-chips
Thus the optimal long-term retirement income strategy for maximizing safe income always combines yield plus growth.
Now you might be thinking, “I’m already retired, so what happens in 20 to 30 years doesn’t apply to me.”
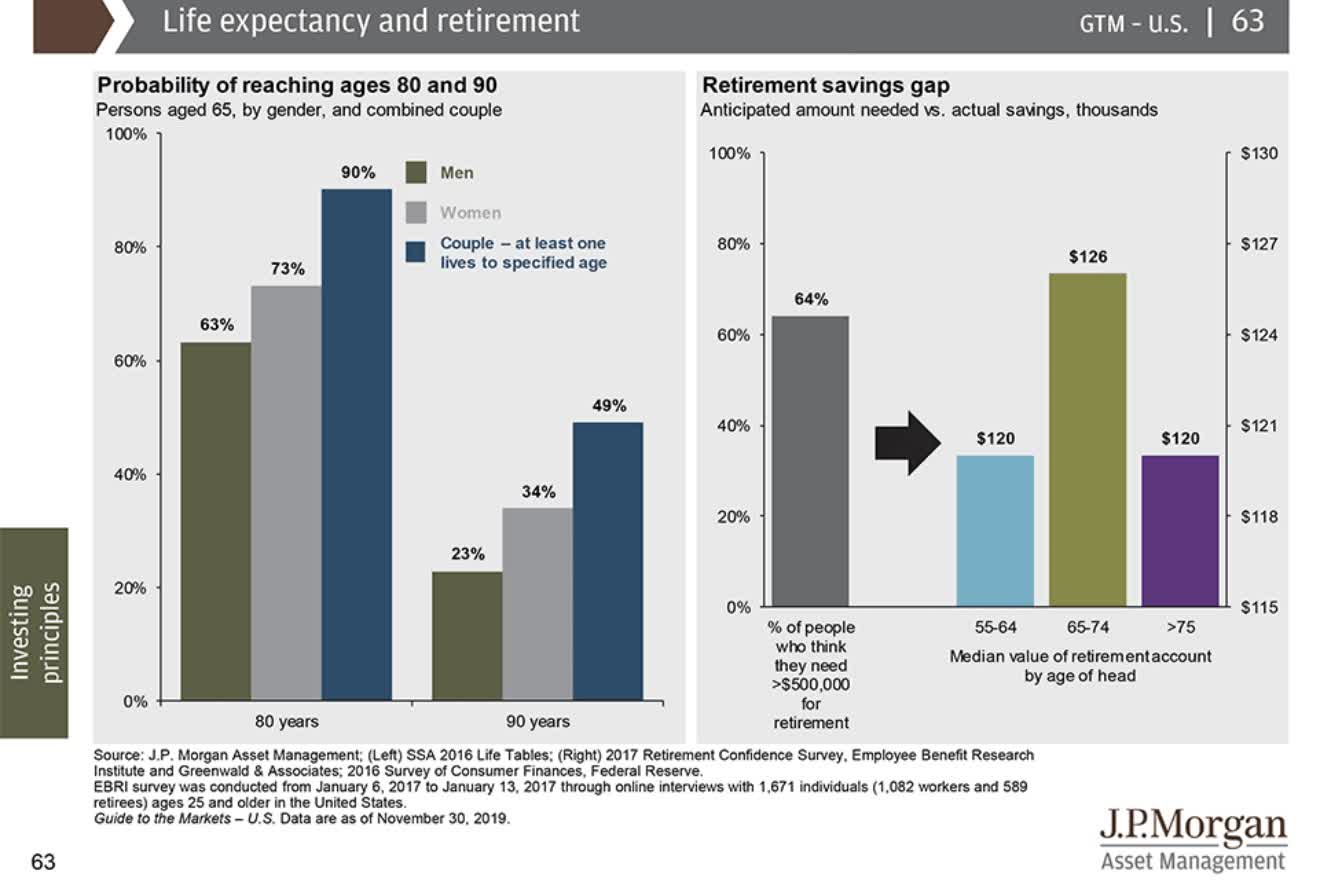
JPMorgan Asset Management
Unless you plan to keel over dead in the next few years, even retirees need to think in terms of 20- to 30-year time horizons.
And guess what? You don’t have to wait decades to benefit from combining yield and growth.
- 2X the income growth rate will raise your living standards in retirement within one year
Ok, so now that you see how Amazon, Lowe’s, and Mastercard have helped boost retirees’ income by as much as 6X in the last 25 years, here’s why you should consider buying them today.
Amazon: A Hyper-Growth Future Dividend Growth Powerhouse
Amazon is one of the greatest investments in history.
Returns Since June 1997

Portfolio Visualizer
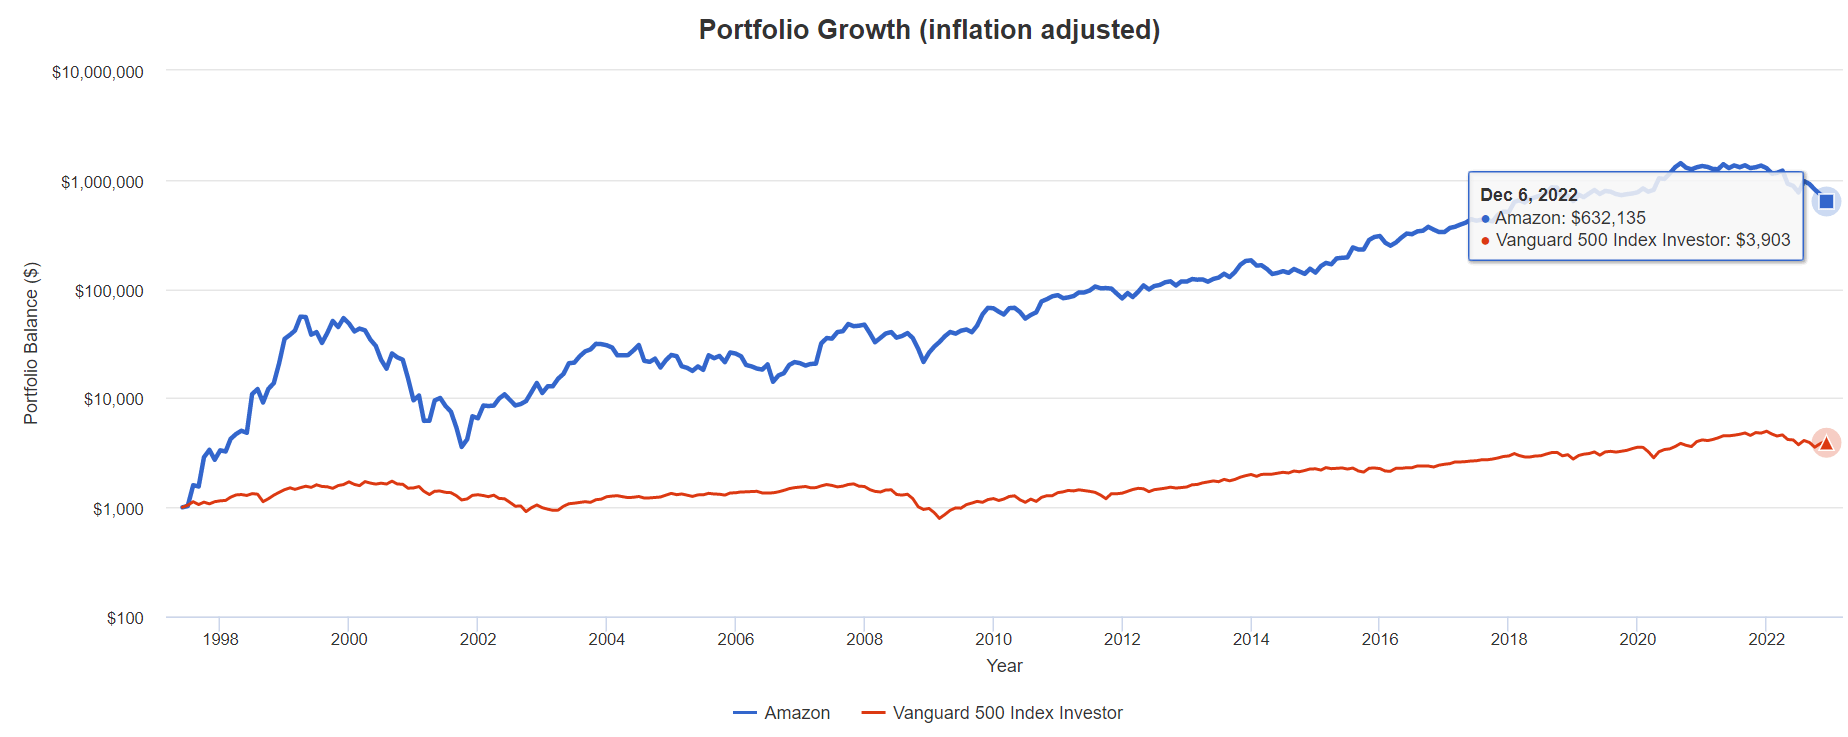
AMZN has delivered Peter Lynch-style 32% annual returns for a quarter century, turning $1 into $1,177.
Portfolio Visualizer
AMZN is a 632X bagger adjusted for inflation, even with its current bear market.
- 162X better inflation-adjusted returns than the S&P 500

Portfolio Visualizer
4X the market’s returns for a quarter century…if you could stomach the wild volatility.
Portfolio Visualizer
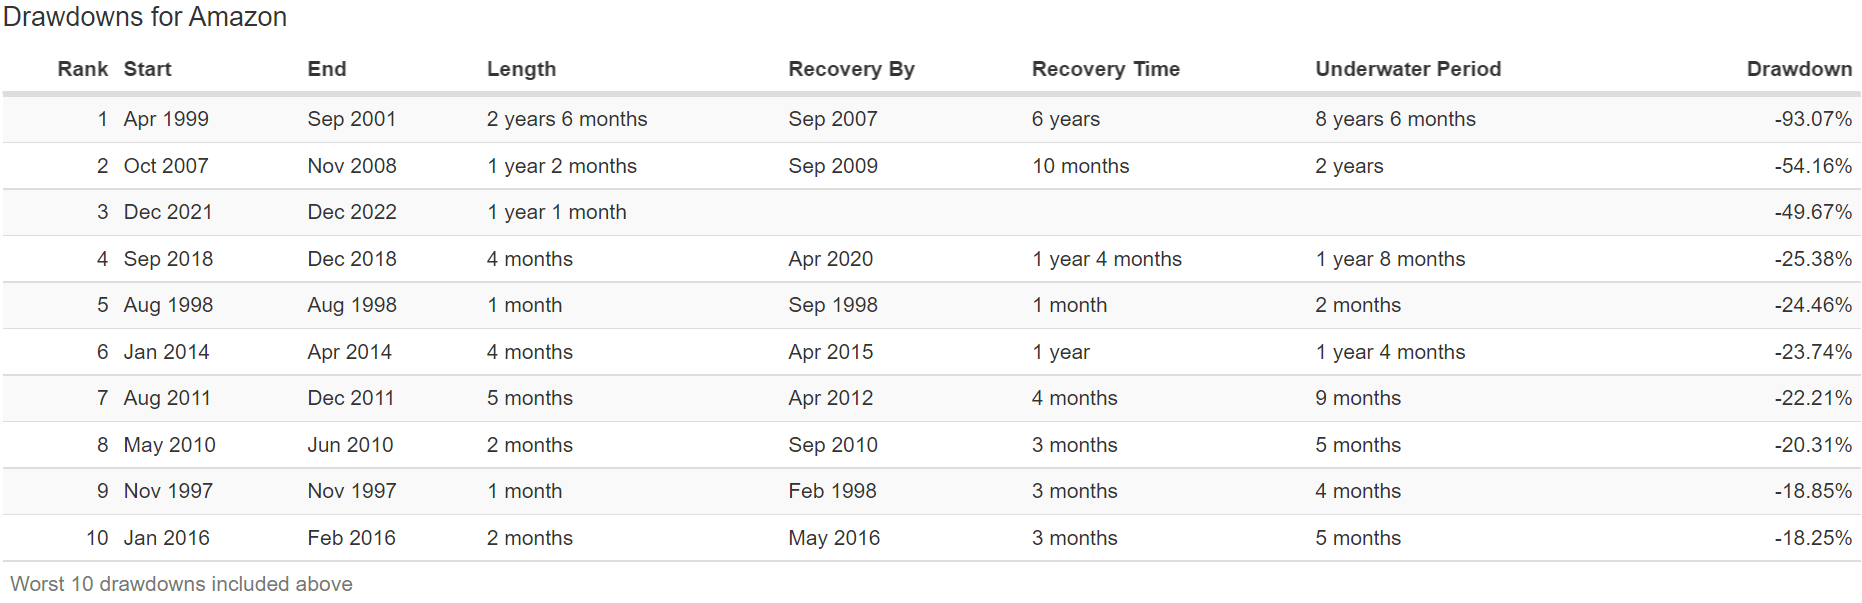
This is the third time in the last 25 years that AMZN has been cut in half. But while some see that as horrifying, it’s why it’s one of my highest conviction recommendations.
The Best Valuation In History
| Metric | Historical Fair Value Multiples (14-Years) | 2021 | 2022 | 2023 | 2024 | 2025 |
12-Month Forward Fair Value |
| Operating Cash Flow | 25.98 | $116.91 | $123.66 | $204.46 | $270.97 | $308.90 | |
| Average | $116.91 | $123.66 | $204.46 | $270.97 | $308.90 | $201.35 | |
| Current Price | $88.25 | ||||||
|
Discount To Fair Value |
24.51% | 28.64% | 56.84% | 67.43% | 71.43% | 56.17% | |
| Upside To Fair Value | 32.48% | 40.13% | 131.69% | 207.05% | 250.03% | 128.16% | |
| 2022 OCF | 2023 OCF | 2022 Weighted OCF | 2023 Weighted OCF | 12-Month Forward OCF | 12-Month Average Fair Value Forward P/OCF | Current Forward P/OCF |
Current Forward Cash-Adjusted PE |
| $4.76 | $7.87 | $0.18 | $7.57 | $7.75 | 26.0 | 11.4 | 12.0 |
Amazon historically trades at 25X to 27X cash flow, and today trades at just 11.4X.
Its cash-adjusted PE is just 12.0, literally private equity valuations.
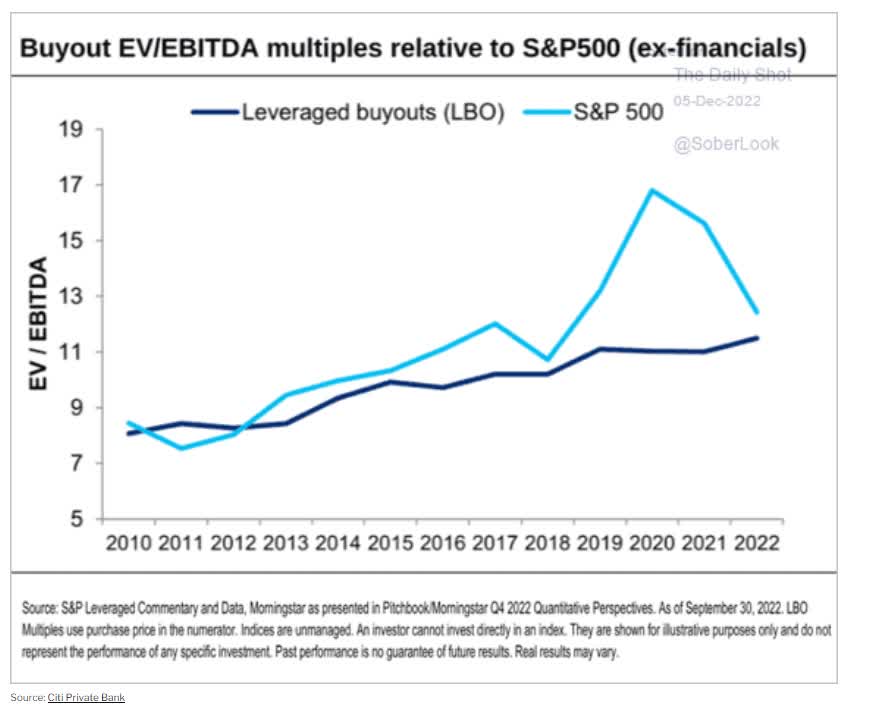
Daily Shot
You can buy Amazon at a similar multiple as private equity is gobbling up bargains in this bear market.
Except that rather than lock up your money for seven to 15 years, Amazon is one of the world’s best hyper-growth world-beaters. One that’s growing at 19.2%.
- 2.5X faster than the S&P 500
Daily Shot
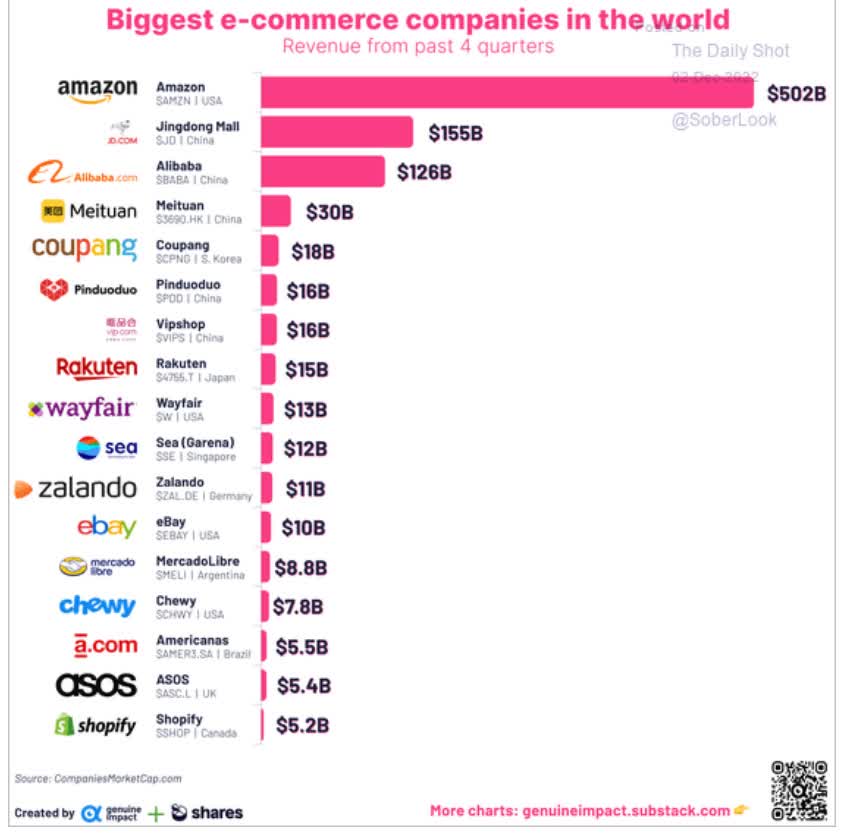
Amazon isn’t just the world’s most dominant online retailer – it’s practically the online retailer.
In the last year, Amazon’s $502 billion in sales dwarfed the next 16 largest rivals... combined.
- The next 16 largest online retailers had $454 billion in sales
And Amazon’s incredible sales today are nothing compared to what analysts expect in the future.

FactSet Research Terminal
By 2028 analysts expect AMZN to become the first $1 trillion sales company in history. Here are the annual consensus growth rates for each of Amazon’s businesses over the next five years.
- AWS growing at 27%
- advertising growing at 15%
- 3rd party sellers growing at 12%
- online stores growing at 11%
- Other (including movies) growing at 9%
- Whole Foods growing at 8%
- subscriptions (Prime) growing at 7%
- physical stores growing at 4%
- total sales growing at 12%
OK, Amazon’s sales are legendary and expected to become even more so. But 12% sales growth isn’t that impressive. So why am I excited about Amazon as a potential life-changing long-term income investment?
Forget Sales And Focus On Cash Flow
| Metric | 2022 Growth Consensus | 2023 Growth Consensus | 2024 Growth Consensus | 2025 Growth Consensus | 2026 Growth Consensus |
2027 Growth Consensus |
| Sales | 10% | 10% | 14% | 11% | 12% | 12% |
| EPS | -103% | 2100% | 71% | 36% | 43% | 31% |
| Operating Cash Flow | 6% | 65% | 37% | 14% | 48% | 37% |
| Free Cash Flow | -25% | 254% | 177% | 48% | 48% | 37% |
| EBITDA | 18% | 28% | 71% | 19% | 30% | 20% |
| EBIT (operating income) | -50% | 94% | 72% | 41% | 37% | 30% |
(Source: FAST Graphs, FactSet Research Terminal)
AMZN is expected to grow sales at a steady double-digit rate but convert that into explosive growth in profits and cash flows.
-
- 64% free cash flow per share growth from 2023 to 2027
| Year | Sales | Free Cash Flow | EBITDA | EBIT (Operating Income) | Net Income |
| 2021 | $469,822 | -$9,069 | $71,994 | $24,879 | $33,364 |
| 2022 | $511,345 | -$13,548 | $71,110 | $12,677 | -$625 |
| 2023 | $566,540 | $19,630 | $83,034 | $23,322 | $18,724 |
| 2024 | $647,809 | $47,964 | $105,981 | $41,527 | $31,852 |
| 2025 | $720,397 | $65,932 | $126,389 | $59,361 | $45,002 |
| 2026 | $810,639 | $98,087 | $163,532 | $80,573 | $64,725 |
| 2027 | $910,681 | $133,448 | $196,379 | $104,584 | $85,109 |
| Annualized Growth 2021-2027 | 12.10% | 61.47% | 18.20% | 27.04% | 16.89% |
| Cumulative 2022-2027 | $4,167,411 | $351,513 | $746,425 | $322,044 | $244,787 |
(Source: FAST Graphs, FactSet Research Terminal)
How on earth can Amazon accomplish such an incredible feat? Including generating $351 billion in cumulative free cash flow through 2027?
The answer lies in Amazon’s magic weapon, AWS, and advertising.
- 30% operating margins on AWS
- potentially 75% operating margins on advertising (according to Piper Jaffray)
You might know Amazon for its online store, but that’s not it’s the main business. Amazon’s true business is... data!
Why did Amazon start AWS? To make it easier to fulfill its online sales. The company had computer engineers program machine-learning algos, allowing it to take its mountains of consumer data and help it grow its business more efficiently. But then other companies asked to use AWS, and Amazon’s cash cow was born.
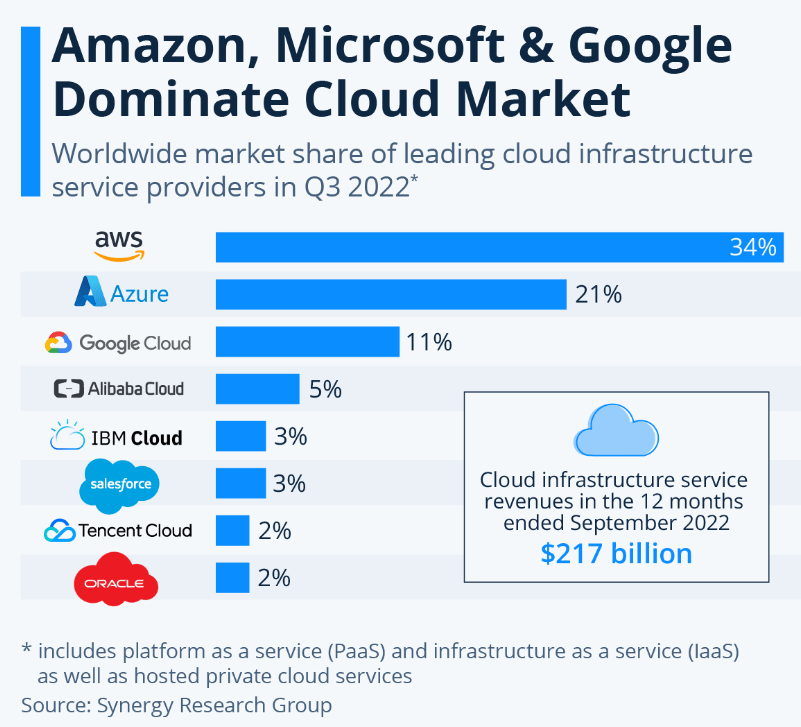
Statista
AMZN is among the top cloud computing companies and is expected to gain market share.
- 26% AWS growth through 2027 is more than the industry’s 21% annual growth rate forecast through 2027
Everything Amazon has been doing with Prime, including buying the rights to Thursday Night Football, spending $1 billion per season for Lord Of The Rings: The Rings Of Power, making 12 movies per year it plans to release in Theaters and then put on Prime Video, and even buying Whole Foods, is about one thing.
The more plugged in customers are to Amazon’s various empire of offerings, the more data it collects.
- which trains its machine-learning algos at AWS and advertising
The more data it has, the better its algos, and the more effective its marketing.
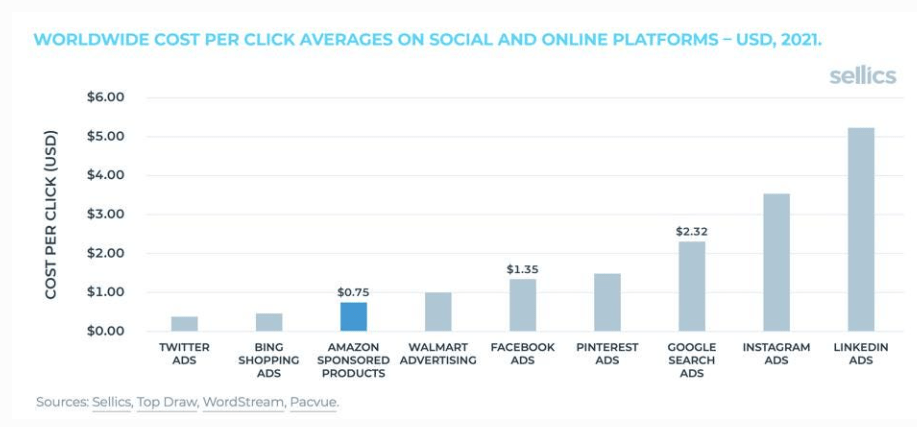
Forbes
Amazon’s ads are 66% cheaper than Google’s or Facebook’s, yet it still mints money, with operating margins potentially as high as 75%.
How? Because guess what advertising runs on? AWS. Amazon owns the infrastructure needed to run its 2nd fastest-growing and most profitable business.
And guess what? Cost per click for Amazon ads rose 22% in 2022, and companies are happy to pay it. Why? Because customers search Amazon looking to buy products. There is no more effective platform for selling stuff than Amazon ads because customers are on that site looking to buy something.
Meta’s business is struggling because it has been cut off from iOS data. Amazon? Doesn’t care because it’s data feed is unaffected. GOOG is less affected than META by the iOS privacy change because it has its more than a dozen services with over 1 billion users feeding it data.
But that data is general, not specific to shopping. Everything you do on Amazon is gold for optimizing advertising effectiveness, which some analysts estimate is 4X better than Google’s.
But there is one other benefit to Prime that many people don’t consider.
- The average Prime member spends $1400 per year vs $600 for the average non-prime member
Prime creates loyalty to Amazon because of its convenience and good value. And with over 200 million global Prime members, that’s a strong tailwind to sales growth.
And along with that sales growth comes ever more data for its machine learning algos to digest and exponentially improve themselves.
The better its algos get, the more valuable AWS is to companies.
- AWS can tell companies how to cut costs and maximize profits
- especially valuable in a recession
The better its algos get, the more effective its advertising becomes, thus allowing Amazon to command higher prices per click and win market share from Facebook, Google, and everyone else.
What does all this mean for Amazon’s bottom line:
Amazon’s Flywheel Of Rising Margins
| Year | FCF Margin | EBITDA Margin | EBIT (Operating) Margin | Net Margin |
| 2021 | -1.9% | 15.3% | 5.3% | 7.1% |
| 2022 | -2.6% | 13.9% | 2.5% | -0.1% |
| 2023 | 3.5% | 14.7% | 4.1% | 3.3% |
| 2024 | 7.4% | 16.4% | 6.4% | 4.9% |
| 2025 | 9.2% | 17.5% | 8.2% | 6.2% |
| 2026 | 12.1% | 20.2% | 9.9% | 8.0% |
| 2027 | 14.7% | 21.6% | 11.5% | 9.3% |
| Annualized Growth 2022-2027 | 43.40% | 5.86% | 13.77% | 4.68% |
(Source: FAST Graphs, FactSet Research Terminal)
Every part of Amazon’s empire feeds into AWS, machine learning, and advertising.
- Even Whole Foods was acquired because of its loyal and rich customer base and turned into a Prime marketing machine
Amazon’s free cash flow margins are expected to grow at 43% through 2027. That’s not the growth rate of its free cash flow but the growth rate of its FCF margins.
By 2027 analysts expect 1 in 6 dollars of sales to drop straight to the bottom line.
Jeff Bezos and Andy Jassy, the current CEO, have always said they intend to maximize long-term free cash flow, and that’s what they are succeeding at.
What’s even more impressive than growing free cash flow margins at 43% and free cash flow per share at 66%? Doing so while spending a spectacular amount on growth.
Amazon Spends More On Growth Than The US Government Does On Infrastructure
| Year | SG&A (Selling, General, Administrative) | R&D | Capex | Total Growth Spending | Sales |
| 2021 | $41,374 | $49,407 | $55,396 | $146,177 | $469,822 |
| 2022 | $50,779 | $67,648 | $60,841 | $179,268 | $511,345 |
| 2023 | $54,848 | $74,035 | $60,392 | $189,275 | $566,540 |
| 2024 | $61,448 | $83,552 | $62,326 | $207,326 | $647,809 |
| 2025 | $63,611 | $84,741 | $62,308 | $210,660 | $720,397 |
| 2026 | $70,392 | $95,306 | $62,767 | $228,465 | $810,639 |
| 2027 | $74,985 | $103,174 | $63,894 | $242,053 | $910,681 |
| Annualized Growth | 10.42% | 13.06% | 2.41% | 8.77% | 11.66% |
| Total Spending 2022-2027 | $376,063 | $508,456 | $372,528 | $1,257,047 | $4,167,411 |
(Source: FAST Graphs, FactSet Research Terminal)
For context, the US government spent $65 billion on R&D in 2020.
In the next 10 years, the US will spend $1.2 trillion on infrastructure.
Meanwhile, Amazon is expected to spend $1.3 trillion on growth in just the next five years.
And that growth spending is growing at 9% per year.
- Potentially growing from $242 billion in 2027 to $368 billion by 2032
- $1.525 trillion in potential growth spending from 2028 to 2023
Or, to put it another way, over the next 10 years, Amazon might spend $2.8 trillion on growth, approximately 2X more than the US government, the richest government in the history of the world.
And all while minting the most free cash flow of any company in history.
Why Amazon Will One Day Become The Ultimate Dividend Growth Stock
Amazon doesn’t pay a dividend today and likely won’t’ through at least 2027. But within 10 years, I’m confident it will, and here’s why.
| Year | Total Debt (Millions) | Cash | Net Debt (Millions) |
| 2021 | $48,744 | $36,220 | -$20,346 |
| 2022 | $55,743 | $53,276 | $14,418 |
| 2023 | $54,801 | $74,258 | $883 |
| 2024 | $54,150 | $113,766 | -$29,057 |
| 2025 | $55,742 | $172,944 | -$67,911 |
| 2026 | $55,742 | $282,605 | -$173,268 |
| 2027 | $54,267 | $404,100 | -$253,967 |
| Annualized Growth | 3.57% | 49.48% | 52.31% |
(Source: FAST Graphs, FactSet Research Terminal)
Amazon’s cash position is growing at 50% per year, and its net cash is growing at 52%.
Including all debt and lease obligations (for AWS), it’s expected to have $254 billion in net cash and $404 billion in total cash by 2027.
- and $134 billion in annual free cash flow, adding to that mountain of cash
- annual free cash flow growing at 37% in 2027
And that’s after spending over $240 billion on growth in 2027!
In other words, Amazon will one day have no choice but to start the largest and most epic capital return program in history.
Amazon has had a $5 billion buyback authorization since 2016 and doubled it to $10 billion this year.
But it’s not expected to actually buy back much stock, around $500 to $600 million per year, mostly offsetting stock options.
But at some point, even if Amazon finds brand new worlds to conquer (like healthcare or robots), it will simply have no choice but to buy back stock at a rate that puts even Apple (AAPL) to shame and pay some of the biggest dividends in the world.
Apple had $250 billion in cash when it started its capital return program in 2012.

Apple
Over the last decade, Apple, a company once led by a visionary who hated buybacks and dividends, has returned $715 billion to shareholders.
Amazon could generate nearly $300 billion per year in free cash flow by 2030 if it grows as expected.
Its net cash could be approaching $1 trillion. With $300 billion per year in FCF, it could return a minimum of $300 billion per year in buybacks and dividends to shareholders in 2030 and still have around $1 trillion to invest in the business.
Do you see why I consider Amazon’s future dividends a mathematical certainty?
The most any company has ever spent on buybacks in a year is Apple, at $86 billion in 2022.
It’s possible this is the limit a company can spend on buybacks.
This means that Amazon could, by 2030, be sending shareholders $100 to $200 billion in dividends, with a 1% to 2% yield.
- a $5 trillion to $10 trillion potential market cap
But guess what? You don’t have to wait until 2030 to profit from Amazon’s future dividends to make a boatload of money on this company.
Amazon’s Total Return Potential: The Power Of A 56% Undervalued Hyper-Growth Ultra SWAN
Amazon has never traded at a lower valuation than it does right now. Not in the Pandemic, not in the Great Recession, and not in the tech crash.
What does that mean for medium-term return potential?
Amazon 2024 Consensus Total Return Potential
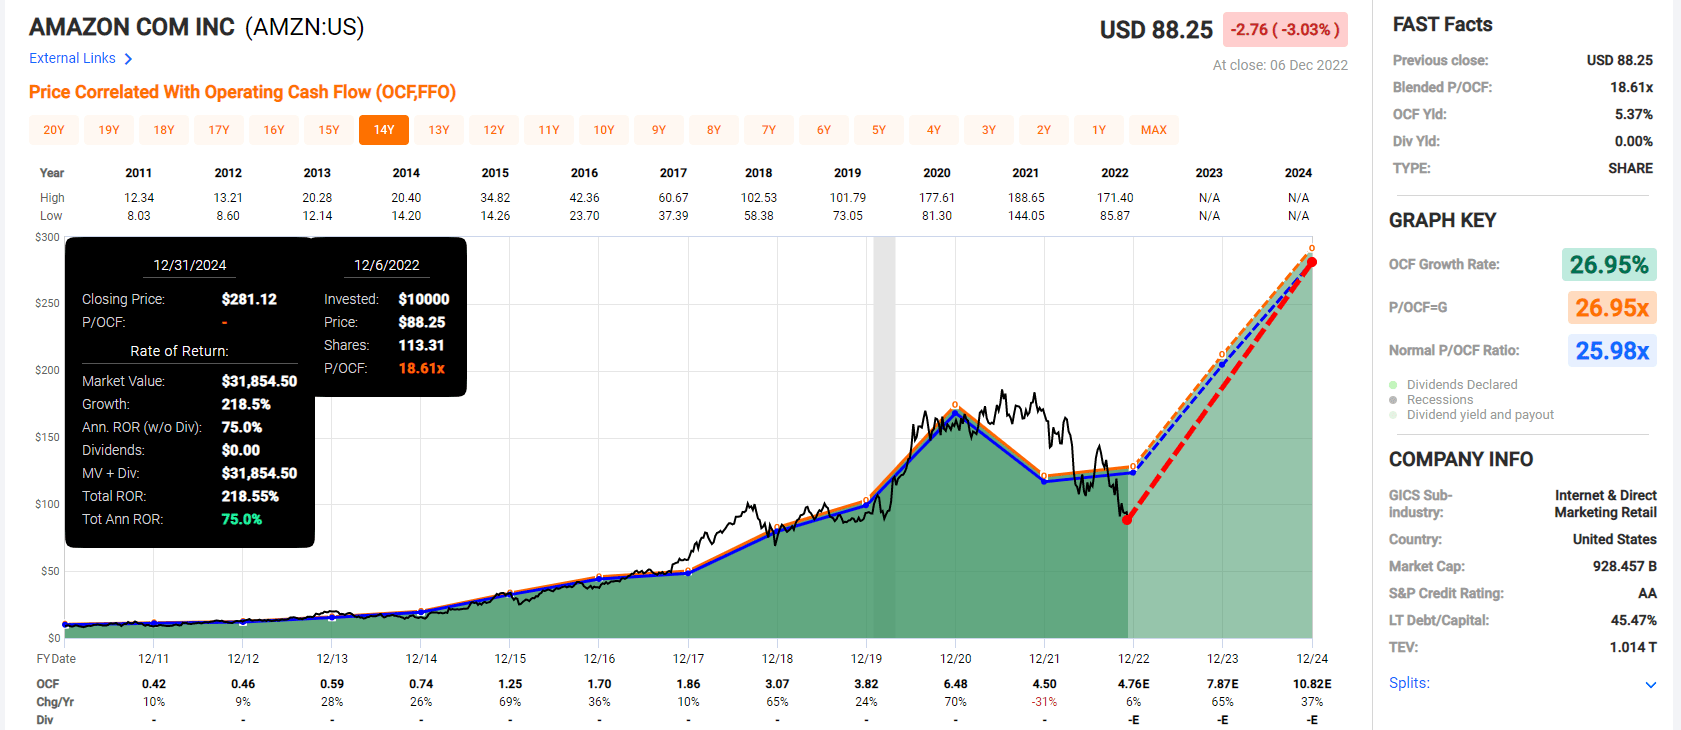
(Source: FAST Graphs, FactSet Research)
If Amazon grows as expected and returns to historical mid-range market-determined fair value by the end of 2024, it could more than triple.
- 75% annual return potential
- 9X more than the S&P 500
Amazon 2028 Consensus Total Return Potential
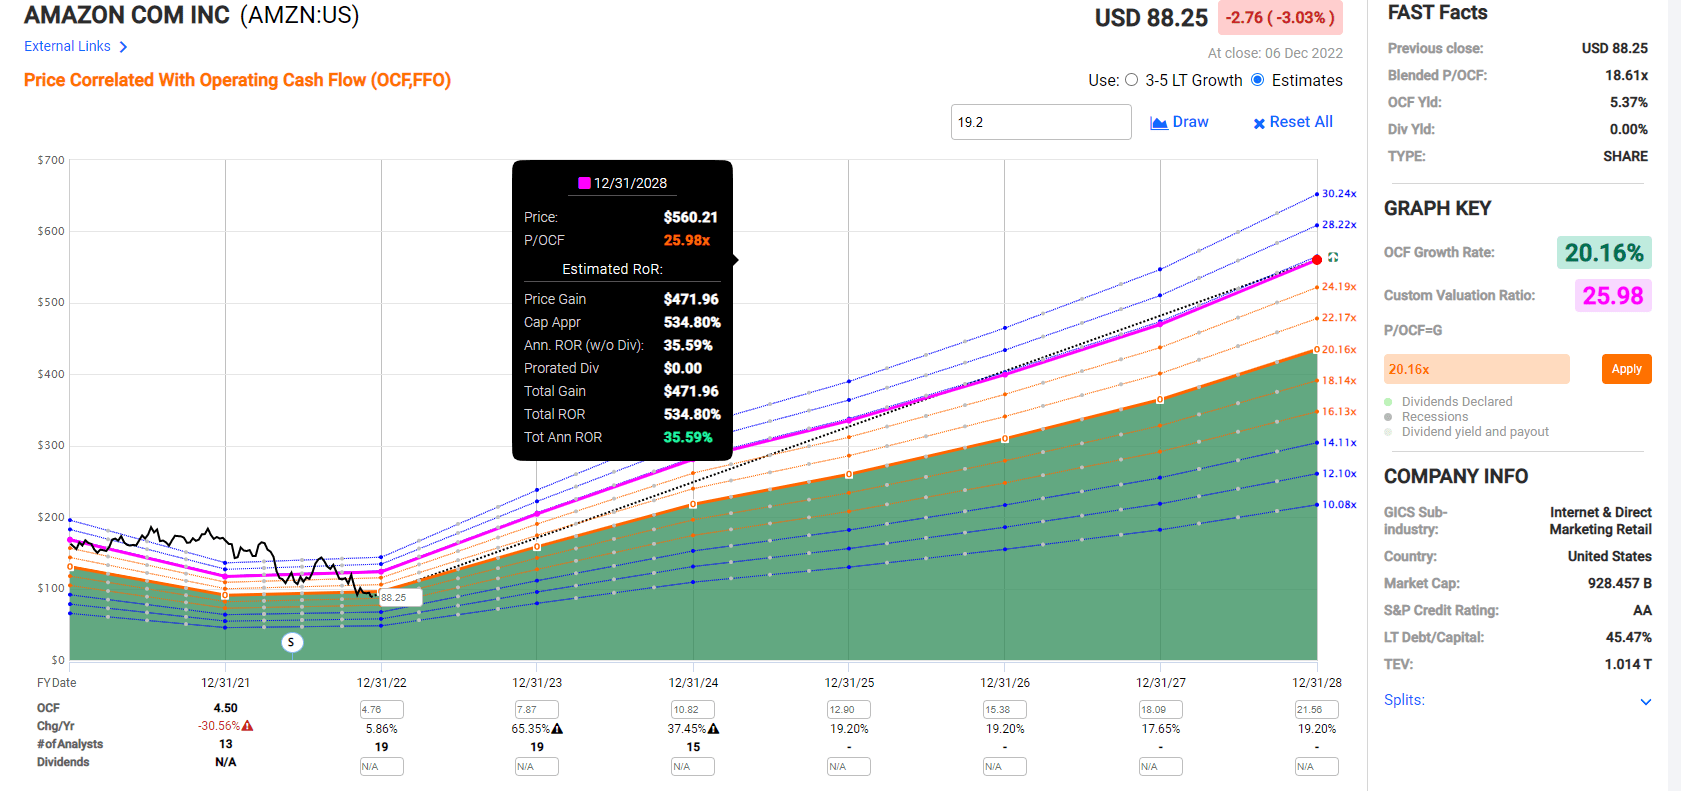
(Source: FAST Graphs, FactSet Research)
If Amazon grows as expected and returns to historical fair value, then it could increase more than 6X in the next five years.
- 36% annual returns over the next five years
- 12X the S&P consensus
Amazon Investment Decision Score
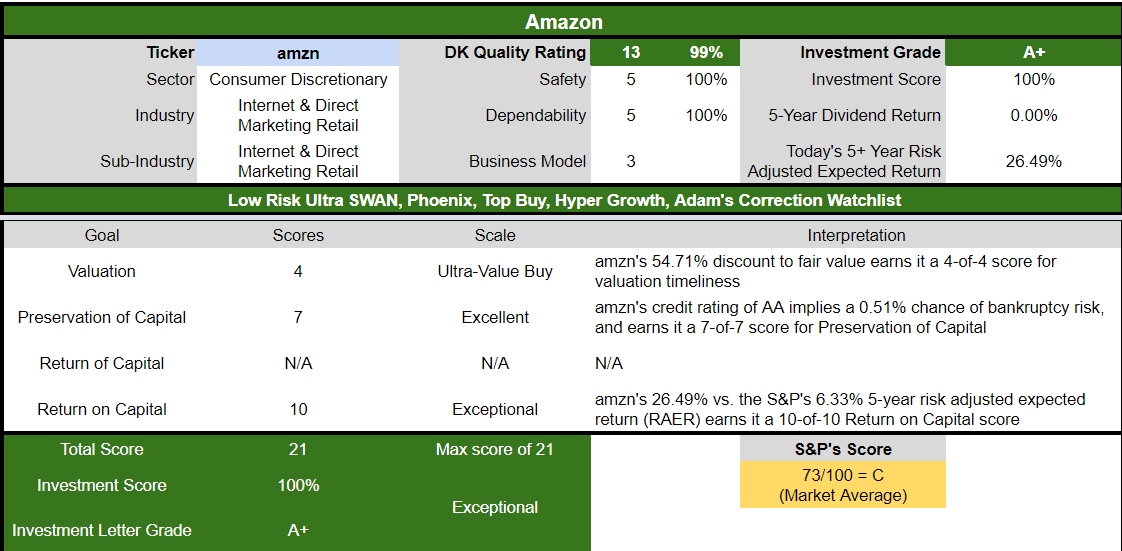
Dividend Kings Automated Investment Decision Score
AMZN is a potentially exceptional hyper-growth deep value Ultra SWAN opportunity for anyone comfortable with its risk profile. Look at how it compares to the S&P 500.
- 55% discount to fair value vs. 1% premium S&P = 56% better valuation
- approximately 19.2% long-term annual return potential vs. 10.2% CAGR S&P
- about 5X higher risk-adjusted expected returns
Lowe’s: A Hyper-Growth Dividend King You Can Trust In Any Recession
Lowe’s is a legendary dividend growth stock, and it’s not hard to see why.
Lowe’s 61-year dividend growth streak is only matched by 12 US companies.
That means that Lowe’s has been raising its dividend every year since 1961 through:
- 10 recessions
- two economic crises
- 15 bear markets
- 30 corrections
- 64 pullbacks
- inflation as high as 15%
- interest rates as high as 20%
- 10-year US treasury yields as high as 16%
- mortgage-rates as high as 16%
How worried am I that LOW is going to cut its dividend in this recession? Not very. In fact, the probability of it cutting its dividend even in a Pandemic or Great Recession level downturn is approximately 1.15%.
The odds of a historically average or mild recession? About 0.5% or 1 in 200.
How bad is the 2023 recession expected to be?

Daily Shot
Economists currently expect it to be the mildest recession in history and last about six months.
And do you know who else isn’t worried about this recession? Lowe’s brilliant management team, an all-star team of executives poached from all over Corporate America.
Since the beginning of 2018, Lowe’s hired a new CEO, a new chief digital officer (from Amazon), as well as heads of merchandising (Chevron), stores (J.C. Penney, Home Depot), and supply chain (Walmart), and a new CFO (internal succession). Marvin Ellison took the reins from longtime CEO Robert Niblock in July 2018. Ellison brought a tremendous amount of retail knowledge to the business, having previously held the role of CEO of J.C. Penney and acting as a longtime executive at wide-moat peer Home Depot.” – Morningstar
For FY22, Lowe’s (LOW) sees total sales of approximately $97B to $98B vs $95.0B consensus, including an extra 53rd week this year.
The presentations during the day will include updates on Lowe’s plans for growth across its five focus areas: deepening Pro penetration, accelerating its online business, expanding installation services, driving localization and elevating its product assortment.
As part of the event, the Lowe’s board of directors announced that it authorized a new $15B common stock repurchase program. The new repurchase program has no expiration date and adds to the previous program’s balance, which stood at $6.4B on December 6.” – Seeking Alpha
Lowe’s raised its guidance for this year and doubled its buy-back program. Does that sound like a company that’s worried about a recession?
Regarding buybacks, just look at what analysts expect from Lowe’s in the next few years.
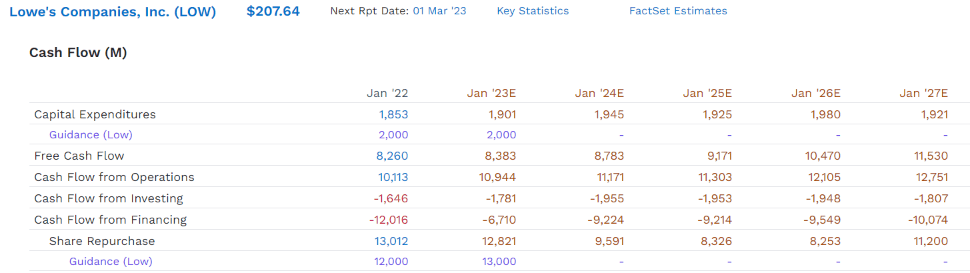
FactSet Research Terminal
This year management says it will buy back $12 billion, and next year $13 billion.
- 20% of shares at current valuations
Buying back 20% of shares in two years is impressive, but analysts expect that from 2024 to 2027, LOW will buy back an additional $37 billion in stock.
- $62 billion in total buybacks over six years
- enough to buyback up to 50% of shares at current valuations
That’s the equivalent of Apple buying back $1.5 trillion in stock, or $200 billion per year. How does Lowe’s plan to afford all those buybacks?
It’s taking out debt but planning to keep leverage at a safe 2.75X
Rating agencies say 3.0X or less is safe and will maintain its BBB+ stable credit rating
This means a 5% 30-year risk of bankruptcy, according to S&P.
Here’s why investors should be excited about Lowe’s buying back shares hand over fist.
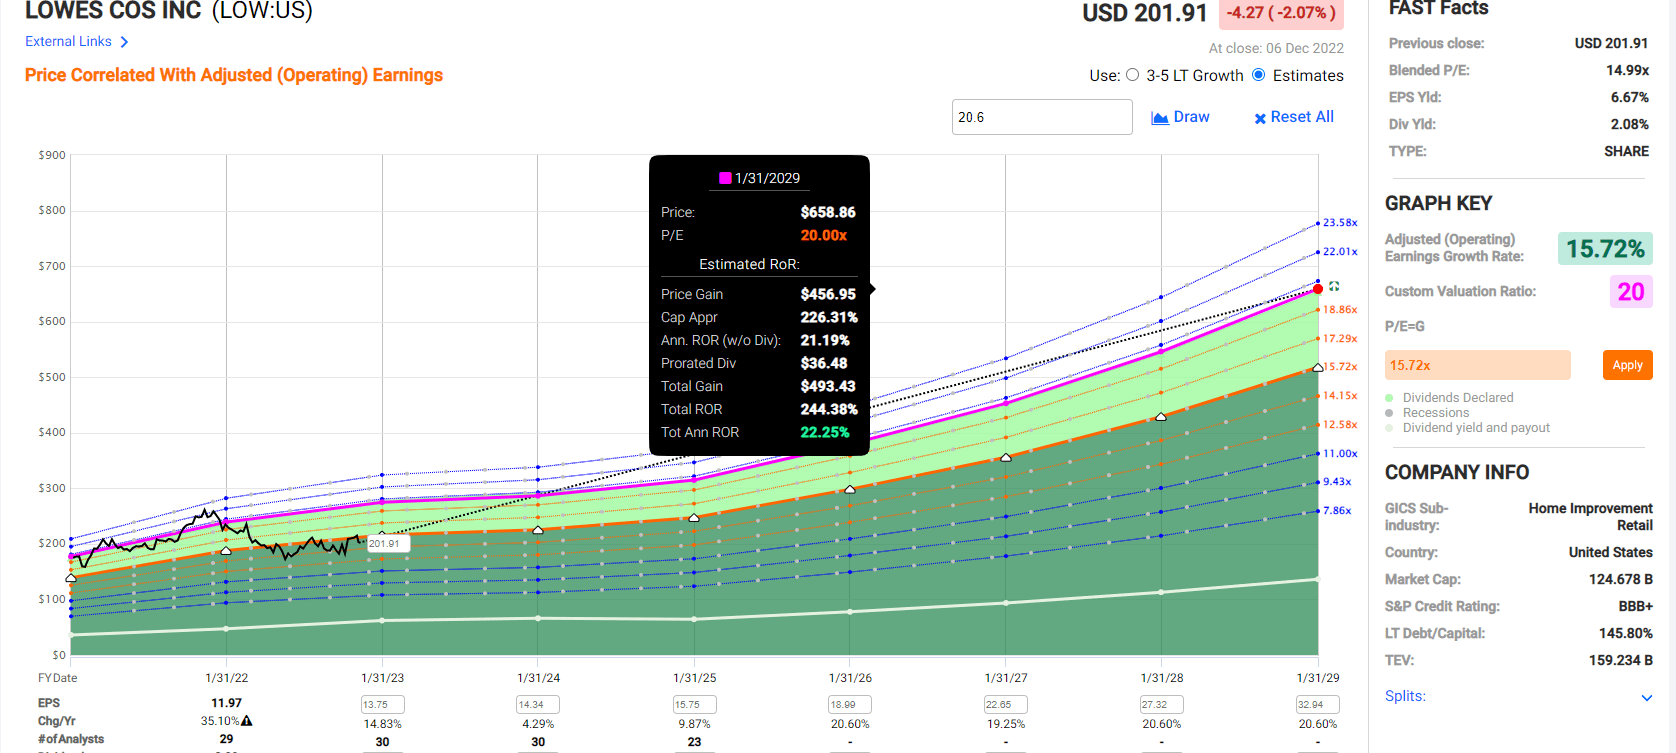
Lowe’s Is A Very Strong Buy: 26% Undervalued
| Metric | Historical Fair Value Multiples (15-year) | 2022 | 2023 | 2024 | 2025 | 2026 |
12-Month Forward Fair Value |
| Earnings | 20.00 | $272.00 | $283.00 | $337.60 | $432.60 | $504.40 | |
| Average | $272.00 | $283.00 | $337.60 | $432.60 | $504.40 | $282.58 | |
| Current Price | $207.83 | ||||||
|
Discount To Fair Value |
23.59% | 26.56% | 38.44% | 51.96% | 58.80% | 26.45% | |
|
Upside To Fair Value (Including Dividends) |
30.88% | 36.17% | 62.44% | 108.15% | 142.70% | 37.99% | |
| 2022 EPS | 2023 EPS | 2023 Weighted EPS | 12-Month Forward EPS | 12-Month Average Fair Value Forward PE | Current Forward PE |
Cash-Adjusted PE |
|
| $13.60 | $14.15 | $13.61 | $14.13 | 20.0 | 14.7 | 11.8 |
LOW has traded at 20X earnings for 20 years, and today trades at 14.7X earnings and just 11.8X cash-adjusted earnings.
- literally private equity valuations for one of the greatest companies in the world
LOW’s dividend growth streak, massive buyback plans, potential for even more buybacks, and 26% discount to fair value are enough to make it an attractive investment.
But here’s one more reason that makes Lowe’s one of my favorite companies on earth.
The Fastest Growing Dividend King
There are 13 US companies with 60-plus year dividend growth streaks.
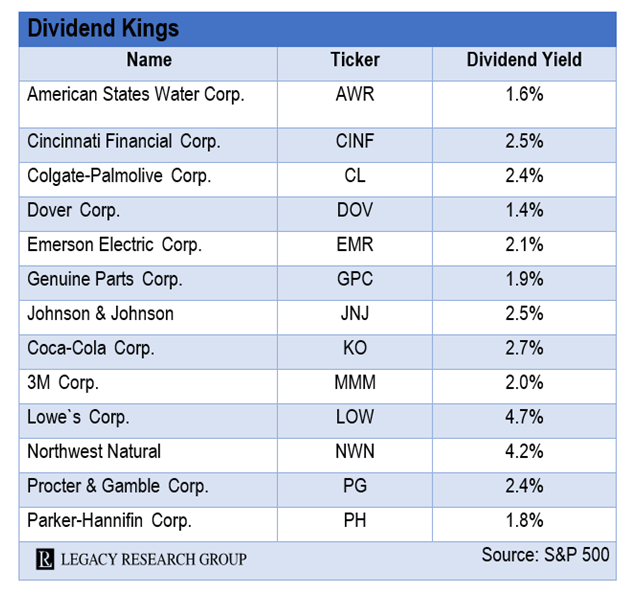
Legacy Research
Guess how many are growing as fast as LOW? None.
How fast is LOW growing?
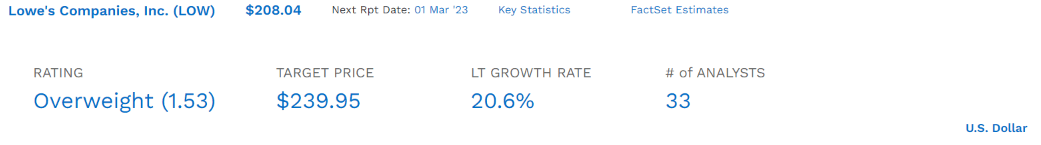
FactSet Research Terminal
At the moment, LOW is growing faster than Amazon!
What does that mean for potential income investors?
Consensus Long-Term Return Potential (Ignoring Valuations)
| Investment Strategy | Yield | LT Consensus Growth | LT Consensus Total Return Potential | Long-Term Risk-Adjusted Expected Return | Long-Term Inflation And Risk-Adjusted Expected Returns | Years To Double Your Inflation & Risk-Adjusted Wealth |
10-Year Inflation And Risk-Adjusted Expected Return |
| Lowe’s | 2.0% | 20.6% | 22.6% | 15.8% | 13.5% | 5.3 | 3.54 |
| Nasdaq | 0.8% | 11.8% | 12.6% | 8.8% | 6.5% | 11.0 | 1.88 |
| Safe Midstream | 5.9% | 6.4% | 12.3% | 8.6% | 6.3% | 11.5 | 1.84 |
| Schwab US Dividend Equity ETF | 3.5% | 8.5% | 12.0% | 8.4% | 6.0% | 11.9 | 1.80 |
| Dividend Aristocrats | 2.6% | 8.5% | 11.1% | 7.8% | 5.4% | 13.2 | 1.70 |
| S&P 500 | 1.7% | 8.5% | 10.2% | 7.1% | 4.8% | 15.0 | 1.60 |
| REITs | 3.9% | 6.1% | 10.0% | 7.0% | 4.7% | 15.4 | 1.58 |
| 60/40 Retirement Portfolio | 2.1% | 5.1% | 7.2% | 5.0% | 2.7% | 26.6 | 1.31 |
(Source: DK Research Terminal, FactSet, Morningstar, Ycharts)
Do you know any dividend kings that could potentially double the long-term returns of the dividend aristocrats? Or nearly double the returns of the Nasdaq?
Of course, 7% of that growth is due to buybacks, which LOW won’t be able to keep up at the current rate forever.
- Assuming LOW can sustain 50% of its buyback rate long-term and 17% long-term growth is more reasonable
- which would still be 19% long-term returns
And in case you think those growth estimates are absurd, management has a very solid plan to deliver on them, which I’ll cover after the investor day presentation in a deep dive report on LOW.
But take a look at LOW’s historical returns.
Historical Returns Since 1985
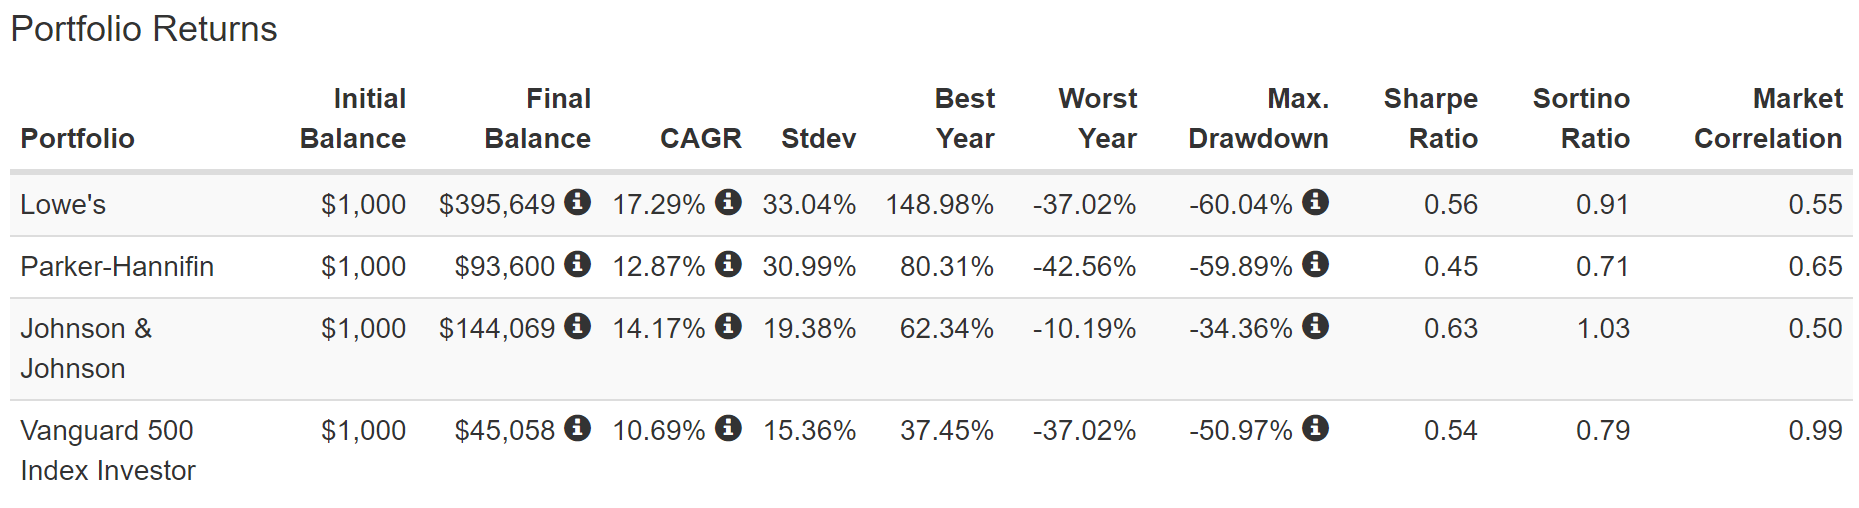
(Source: Portfolio Visualizer Premium)
LOW has delivered 17% annual returns for 37 years, even with this 36% bear market.
That’s far better than the second- and third-fastest growing dividend kings, PH and JNJ.
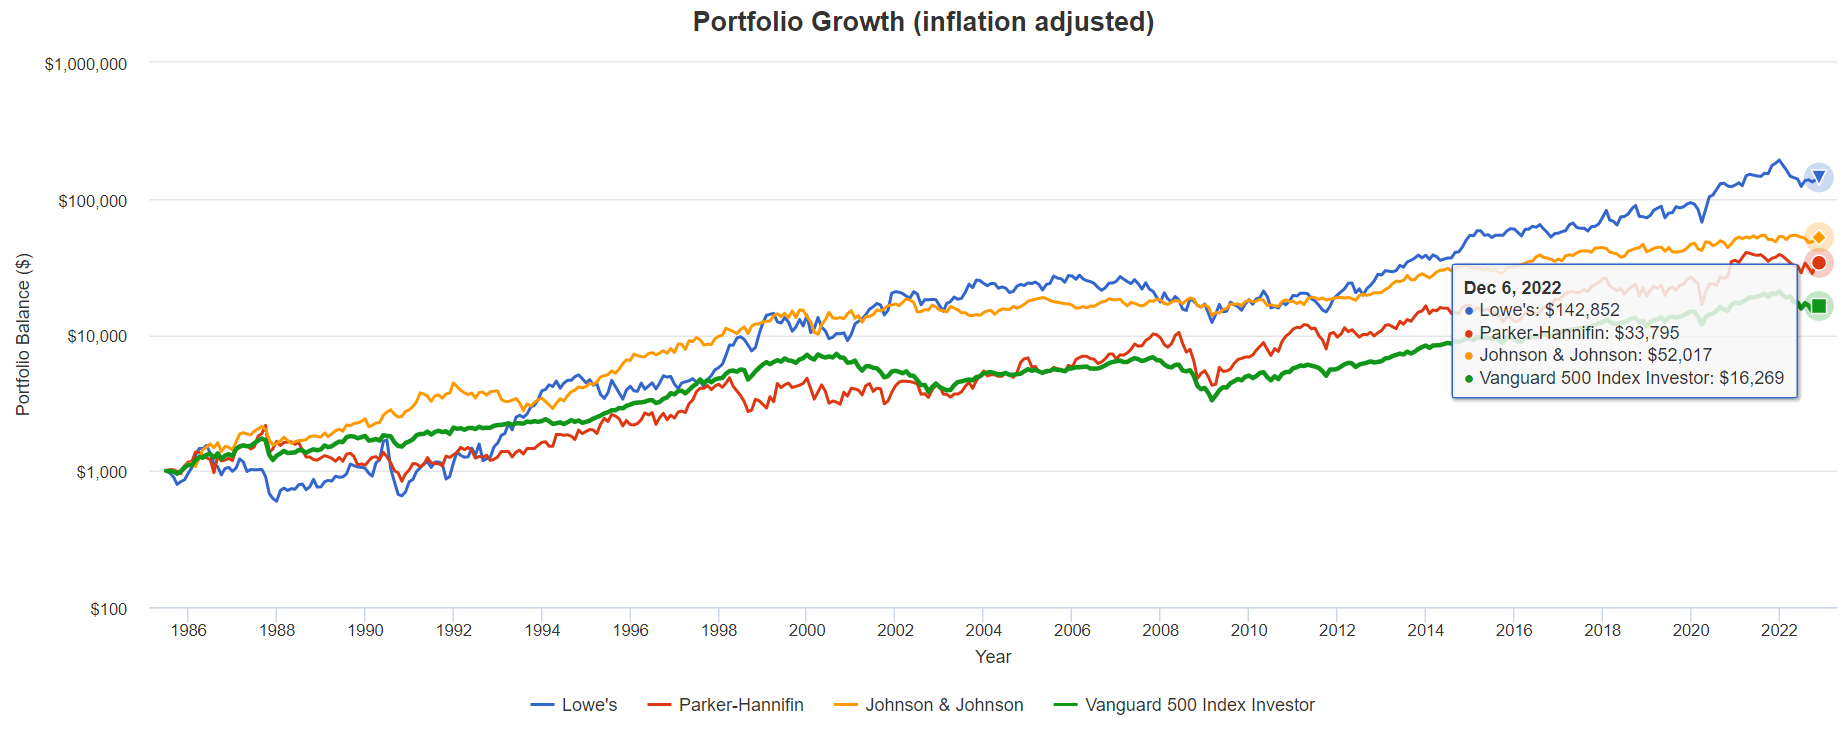
(Source: Portfolio Visualizer Premium)
LOW’s inflation-adjusted returns over the last 37 years are 143X, 9X more than the S&P 500.

(Source: Portfolio Visualizer Premium)
LOW’s average rolling 12-month return has been 22% for 37 years, which is what analysts expect in the future.
To sustain its historical 15-year rolling return of 17%, it would need to grow at 15% per year, with 3.5% of that coming from buybacks.
Dividend Growth That Rich Retirements Are Made Of
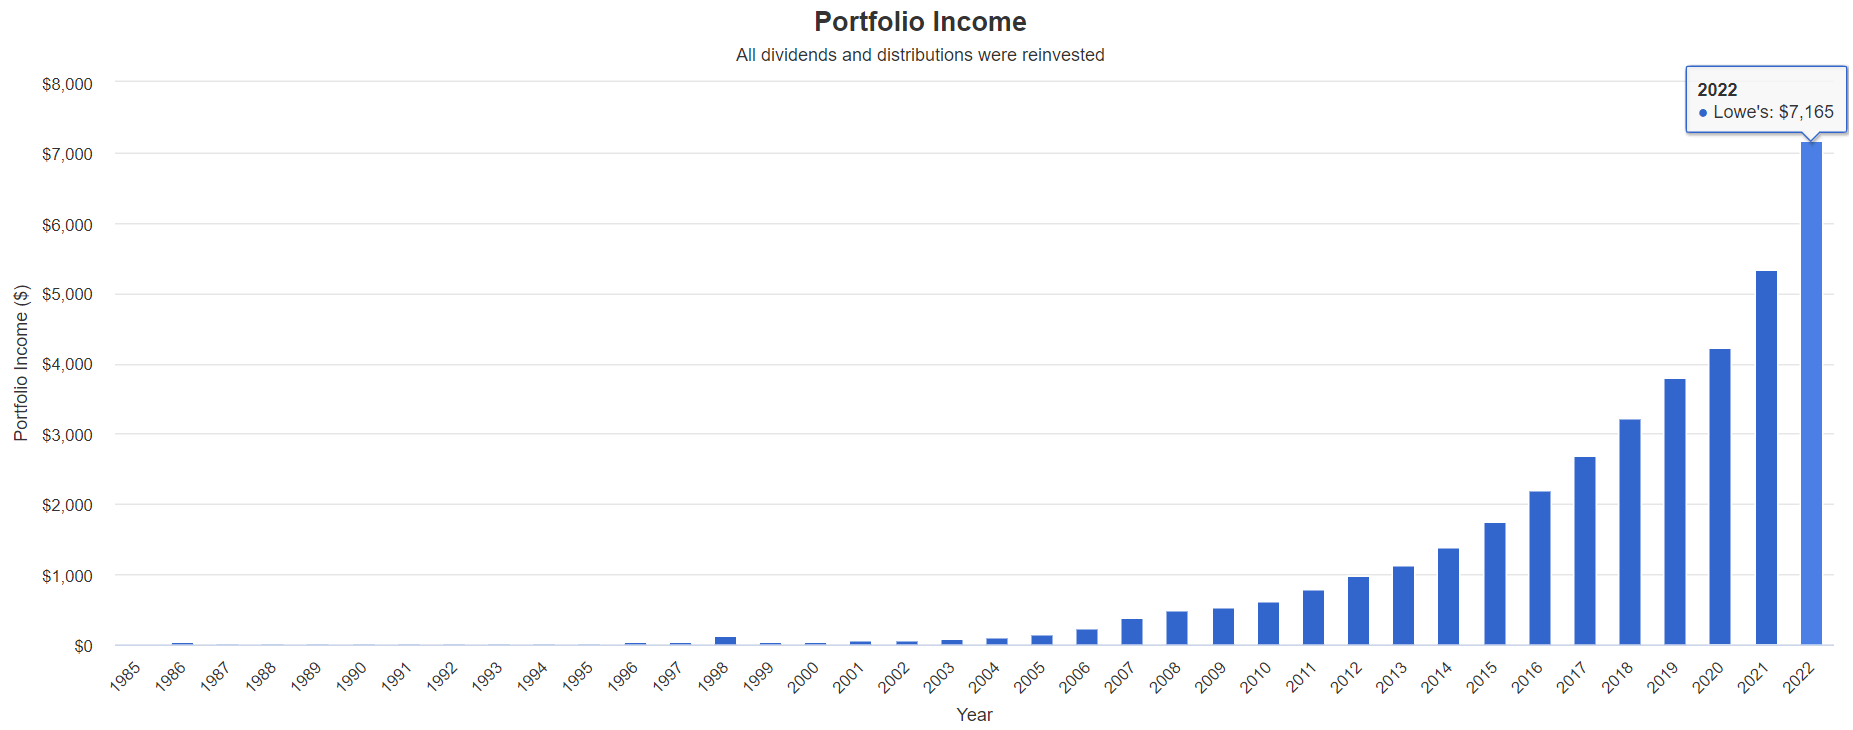
(Source: Portfolio Visualizer Premium)
This is what decades of dividend hyper-growth can accomplish.
Cumulative Dividends Since 1985 Per $1,000 Investment
| Metric | Lowe’s |
| Total Dividends | $37,951 |
| Total Inflation-Adjusted Dividends | $13,457.80 |
| Annualized Income Growth Rate | 18.4% |
| Total Income/Initial Investment % | 37.61 |
| Inflation-Adjusted Income/Initial Investment % | 13.46 |
| More Inflation-Adjusted Income Than Altria | 0.13 |
| Starting Yield | 1.4% |
| Today’s Annual Dividend Return On Your Starting Investment (Yield On Cost) | 716.5% |
| Today’s Inflation-Adjusted Annual Dividend Return On Your Starting Investment (Inflation-Adjusted Yield On Cost) | 254.1% |
(Source: Portfolio Visualizer Premium)
13.5X your initial investment back in inflation-adjusted dividends.
A 254% inflation-adjusted yield on cost thanks to 18.4% annual income growth for 37 years.
But you don’t have to wait for decades to make a lot of money in 26% undervalued LOW.
Buffett-Like Return Potential From A Blue-Chip Bargain Hiding In Plain Sight
What happens when a dividend king growing 20% becomes 26% undervalued? The opportunity for potentially Buffett-like return potential from a blue-chip bargain hiding in plain sight.
Lowe’s 2024 Consensus Total Return Potential

(Source: FAST Graphs, Factset)
If LOW grows as expected and returns to historical mid-range market-determined fair value by the end of 2024, it could deliver 60% returns.
- 25% annual return potential
- 3X more than the S&P 500
Lowe’s 2028 Consensus Total Return Potential
(Source: FAST Graphs, Factset)
If LOW grows as expected and returns to historical fair value, then it could increase more than triple in the next five years.
- 22% annual returns over the next five years
- 5.5X the S&P consensus
Lowe’s Investment Decision Score

Dividend Kings Automated Investment Decision Tool
LOWN is a potentially very good hyper-growth deep value Ultra SWAN dividend king opportunity for anyone comfortable with its risk profile. Look at how it compares to the S&P 500.
- 27% discount to fair value vs. 1% premium S&P = 28% better valuation
- very safe 2% yield growing 19% through 2028
- approximately 22.6% long-term annual return potential vs. 10.2% CAGR S&P
- about 3X higher risk-adjusted expected returns
- 66% higher income potential over five years
Mastercard: As Close To God’s Own Dividend Stock As Exists
Mastercard has three claims to fame that make it as close to a must-own company as exists on Wall Street.
First is its quality, which is sensational.
#1 Quality On The Master List
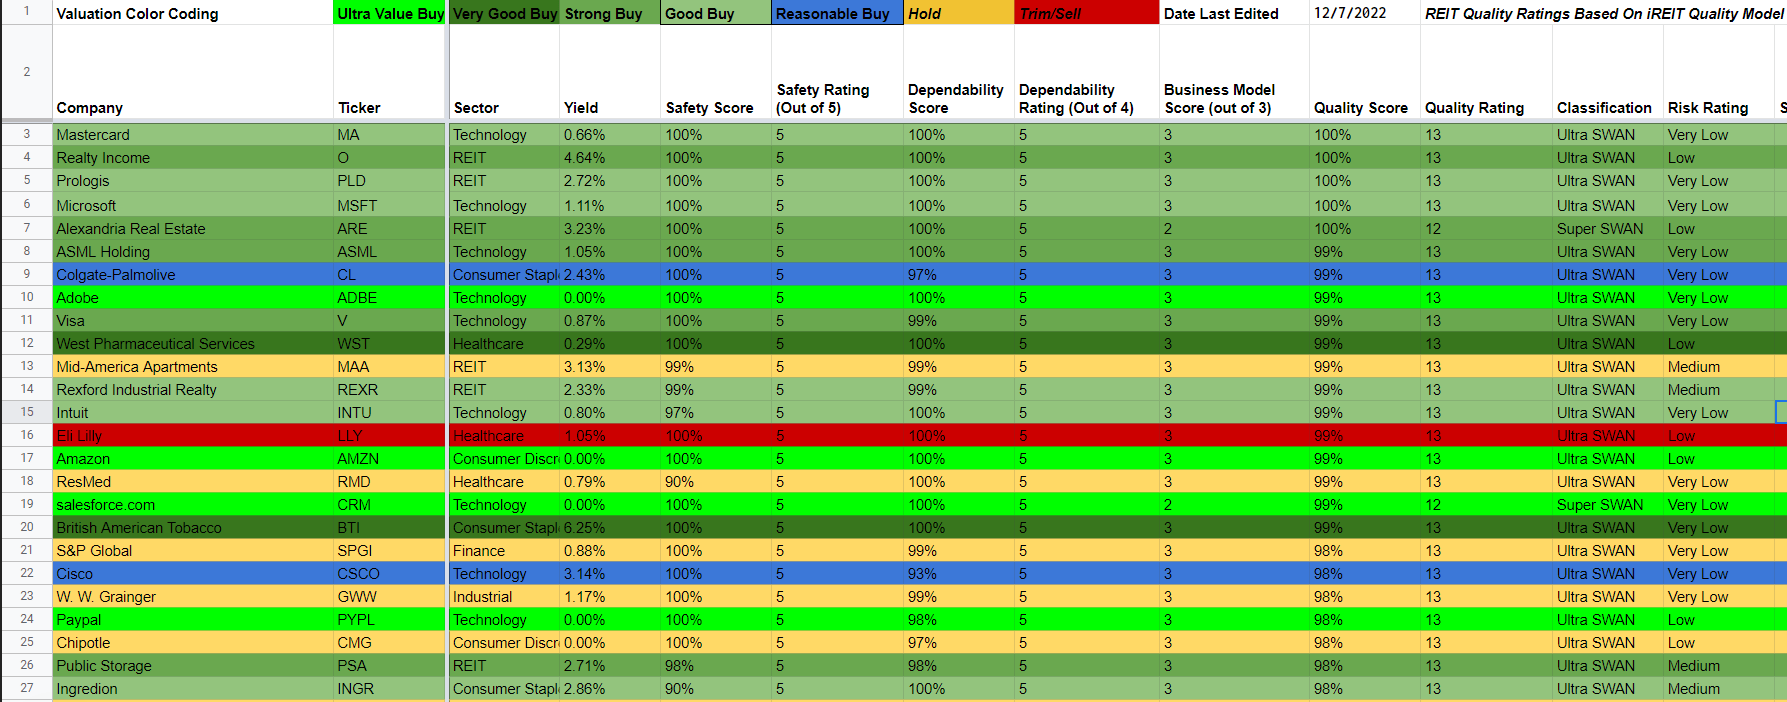
Dividend Kings Safety & Quality Tool
Mastercard scores a perfect 100% safety, quality, and dependability on the Dividend Kings’ over 1,000-point safety and quality model.
That makes it the highest quality company on the Master List. How impressive is that?
The Dividend Kings 500 Master List includes some of the world’s best companies, including:
- every dividend champion (25+ year dividend growth streaks, including foreign aristocrats)
- every dividend aristocrat
- every dividend king (50+ year dividend growth streaks)
- every Ultra SWAN (as close to perfect quality companies as exist)
- the 20% highest quality REITs according to iREIT
- 40 of the world’s best growth blue-chips
Or, to put it another way, on a list of the world’s best blue chips, Mastercard is higher quality than all of them, as close to God’s own dividend stock as can exist on Wall Street.
What makes MA so exceptional?
First, there’s the balance sheet.
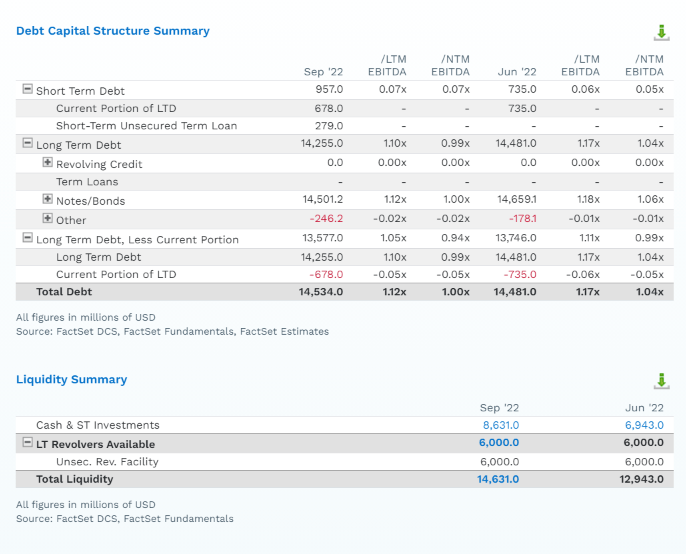
FactSet Research Terminal
Mastercard’s leverage ratio of 1X is 1/3rd the safety guideline from rating agencies for this industry.
That’s why it has an A+ stable credit rating, meaning 0.6% 30-year bankruptcy risk, according to S&P.
MA’s net debt is just 0.5X, and it’s covering its interest payments 27.4X with operating profits.
- 8X or higher is safe according to rating agencies
This brings us to Mastercard’s second claim to fame, its unbelievable profitability.
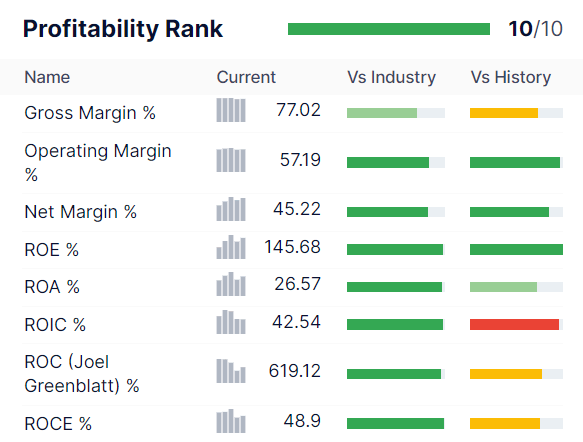
Gurufocus Premium
Over the past year, MA has delivered 45% net margins and 619% returns on capital or ROC.
ROC is Joel Greenblatt’s gold standard proxy for quality and moatiness.
- annual pre-tax profit/the cost of running the business
For context, the S&P 500 has a 14.6% ROC and the dividend aristocrats 105%.
Mastercard’s ROC is 42.5X higher than the S&P 500 and 6X more than the dividend aristocrats. But wait, it gets better.
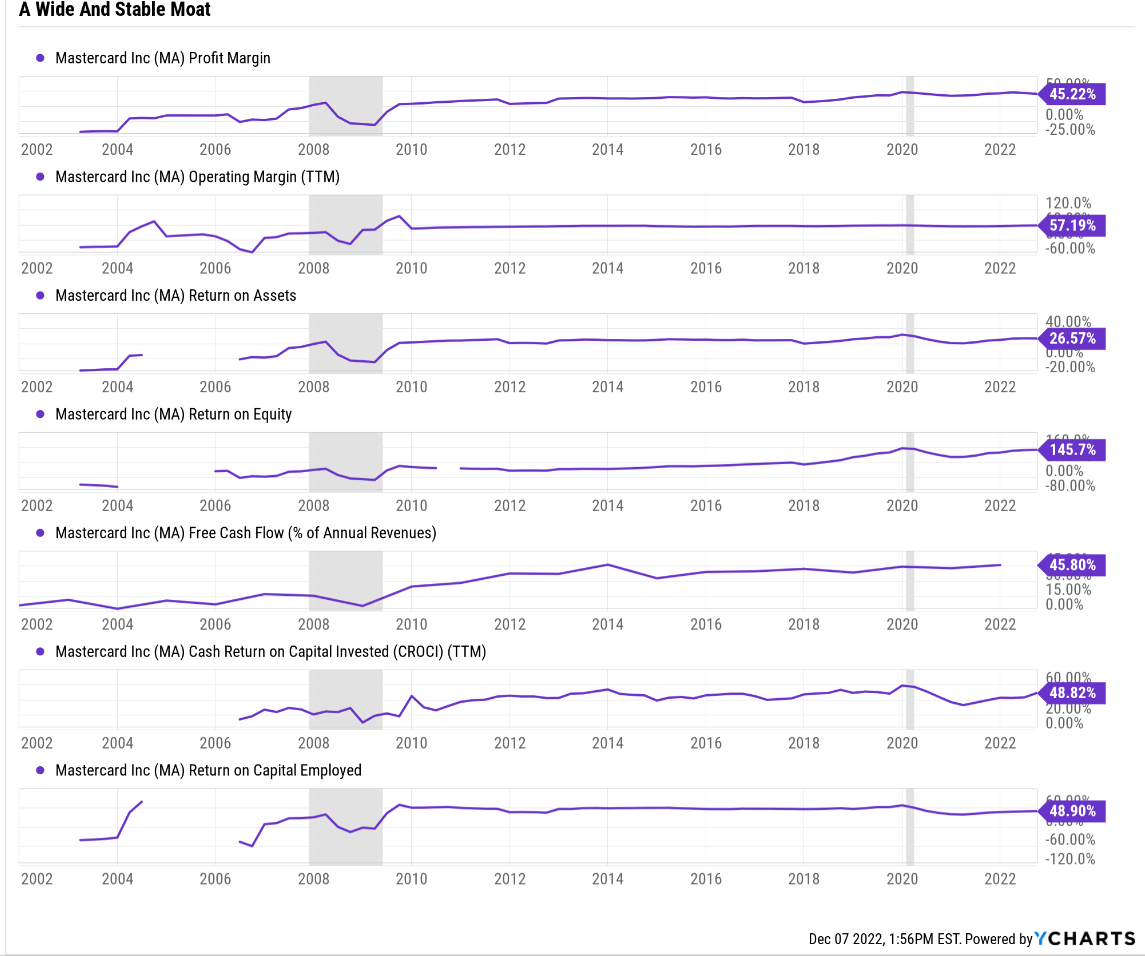
Ycharts
Mastercard’s free cash flow margin is 46% and has been rising over the last 20 years. This means almost 50% of sales drop straight to the bottom line. MA’s FCF margin is in the top 1% of all companies on earth.
Finally, let’s get to the reason I love Mastercard most of all.
Growth, Growth, And More Growth
Recession? What recession? As far as Mastercard is concerned, it’s full speed ahead for growth. Not only did they just raise the dividend by a healthy 16%, but this marks the 11th consecutive year of dividend growth.
- every year since they IPOed
I will eat my hat if Mastercard doesn’t become a dividend aristocrat in 2036.
The $9 billion buyback authorization is actually only taking effect after the current $8 billion one is completed. So MA is planning to buy back up to $17 billion in stock in the next few years. How much?
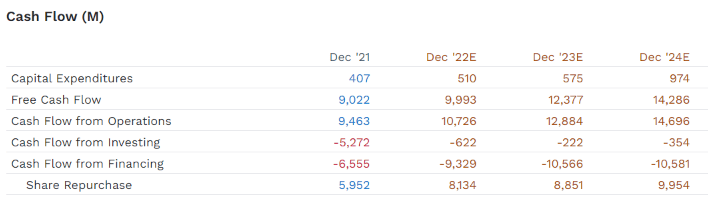
FactSet Research Terminal
Analysts think MA will complete the $8 billion buyback this year, use up the new $9 billion authorization next year, and then buy back a record $10 billion in 2024.
- $27 billion in buybacks in three years
- 8% of shares at current valuations
But wait, it gets better; MA isn’t just fast-growing; it’s faster-growing than Amazon and Lowe’s.
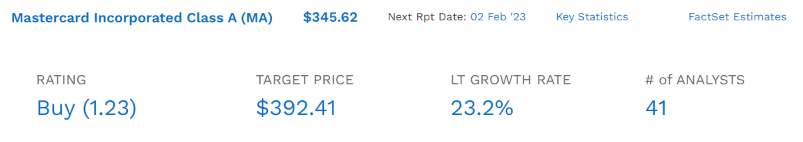
FactSet Research Terminal
The median growth consensus for MA from all 41 analysts is 23.2%.
What does that mean for long-term income growth investors?
Consensus Total Return Potential (Ignoring Valuation)
| Investment Strategy | Yield | LT Consensus Growth | LT Consensus Total Return Potential | Long-Term Risk-Adjusted Expected Return | Long-Term Inflation And Risk-Adjusted Expected Returns | Years To Double Your Inflation & Risk-Adjusted Wealth |
10-Year Inflation And Risk-Adjusted Expected Return |
| Mastercard | 0.7% | 23.2% | 23.9% | 16.7% | 14.4% | 5.0 | 3.84 |
| Nasdaq | 0.8% | 11.8% | 12.6% | 8.8% | 6.5% | 11.0 | 1.88 |
| Safe Midstream | 5.9% | 6.4% | 12.3% | 8.6% | 6.3% | 11.5 | 1.84 |
| Schwab US Dividend Equity ETF | 3.5% | 8.5% | 12.0% | 8.4% | 6.0% | 11.9 | 1.80 |
| Enbridge | 6.7% | 4.9% | 11.6% | 8.1% | 5.8% | 12.4 | 1.76 |
| Dividend Aristocrats | 2.6% | 8.5% | 11.1% | 7.8% | 5.4% | 13.2 | 1.70 |
| S&P 500 | 1.7% | 8.5% | 10.2% | 7.1% | 4.8% | 15.0 | 1.60 |
| REITs | 3.9% | 6.1% | 10.0% | 7.0% | 4.7% | 15.4 | 1.58 |
| 60/40 Retirement Portfolio | 2.1% | 5.1% | 7.2% | 5.0% | 2.7% | 26.6 | 1.31 |
(Source: DK Research Terminal, FactSet, Morningstar, Ycharts)
How would you like to double the Nasdaq’s long-term return potential? Owning the greatest company in the world? With profitability, that’s out of this world.
Returns Since June 2006
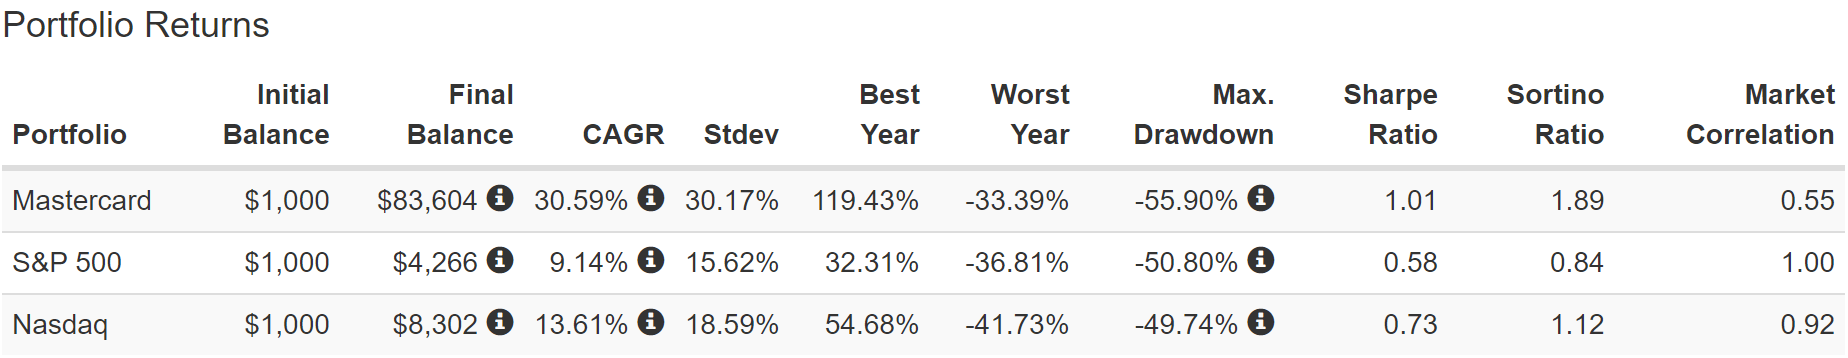
Portfolio Visualizer Premium
Mastercard is one of the greatest growth stocks in history, delivering nearly 100X returns over the last 16 years. MA’s inflation-adjusted returns are 56X since its IPO, 10X better than the Nasdaq.
And its income growth?
27% Annual Income Growth Over The Last 15 Years
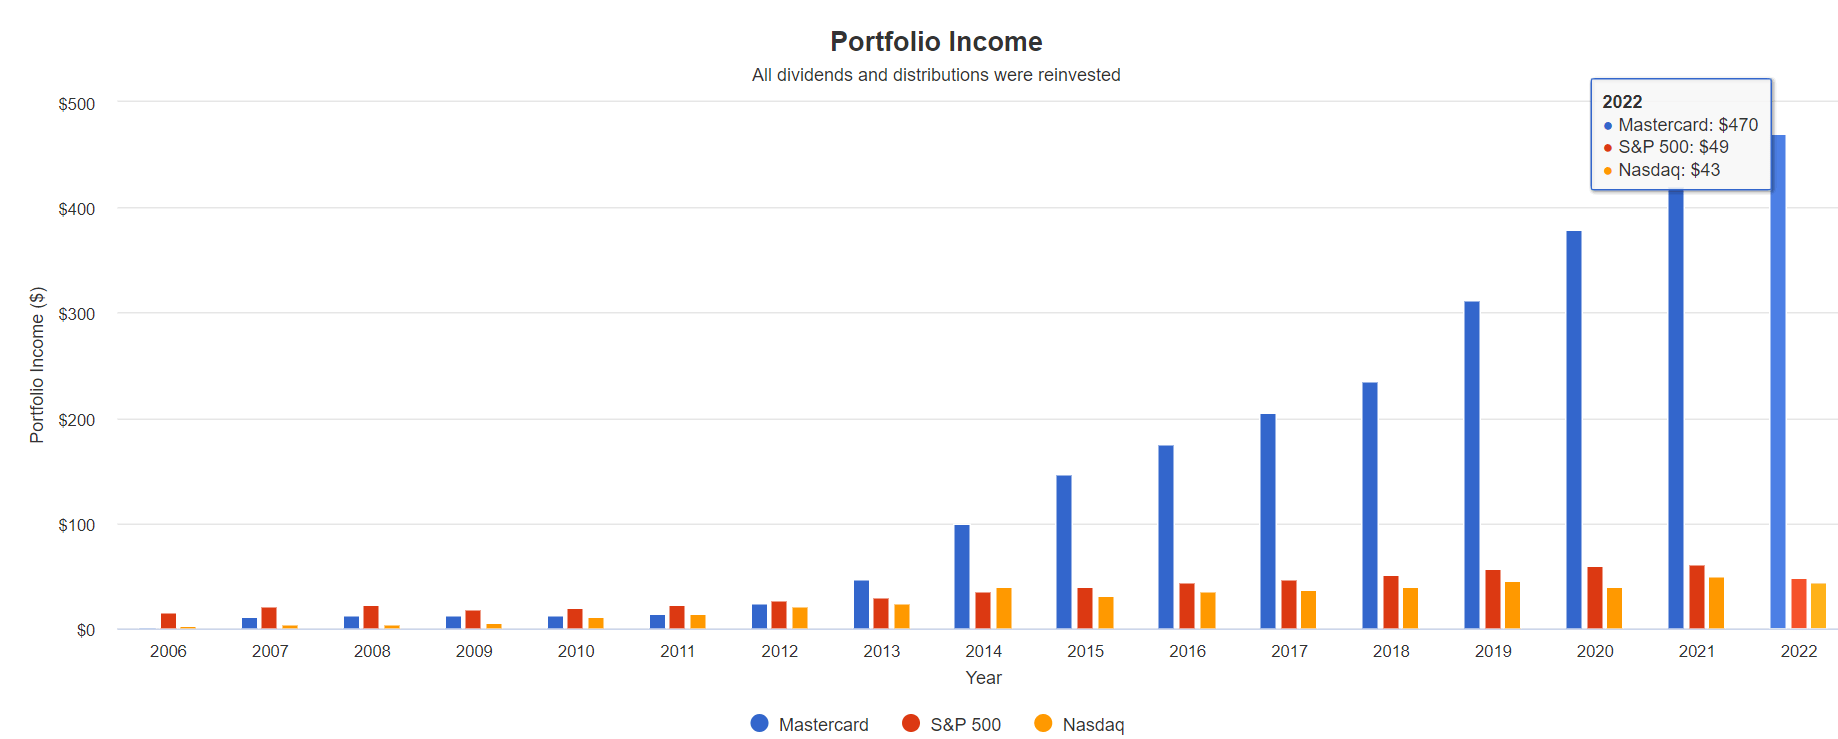
Portfolio Visualizer Premium
If you bought MA at its IPO, your yield on cost is now almost 55%, including the 2023 dividend hike.
Valuation: The Ultimate Buffett-Style “Wonderful Company At A Fair Price”
| Metric | Historical Fair Value Multiples (13-year) | 2021 | 2022 | 2023 | 2024 | 2025 |
12-Month Forward Fair Value |
| 5-Year Average Yield | 0.52% | $338.46 | $438.46 | $438.46 | $440.38 | $871.15 | |
| Earnings | 31.24 | $262.42 | $329.27 | $379.57 | $489.84 | $540.76 | |
| Average | $295.63 | $376.10 | $406.89 | $463.80 | $667.30 | $405.71 | |
| Current Price | $339.37 | ||||||
|
Discount To Fair Value |
-14.80% | 9.77% | 16.59% | 26.83% | 49.14% | 14.86% | |
| Upside To Fair Value | -12.89% | 10.82% | 19.90% | 36.66% | 97.30% | 20.22% | |
| 2022 EPS | 2023 EPS | 2022 Weighted EPS | 2023 Weighted EPS | 12-Month Forward EPS | 12-Month Average Fair Value Forward PE | Current Forward PE |
Current Forward Cash-Adjusted PE |
| $10.54 | $12.15 | $0.41 | $11.68 | $12.09 | 33.6 | 28.1 | 24.4 |
How can MA be a potentially strong buy at a 28 PE? Because when you adjust for cash, it’s trading at a 24.4 PE and a PEG of about 1.
- Peter Lynch’s growth at a reasonable price
What kind of returns could you get from a 15% undervalued Mastercard growing at over 20%?
Buy Mastercard Today, And You Will Likely Be Thrilled In 5+ Years
What happens when a dividend king growing 20% becomes 26% undervalued? The opportunity for potentially Buffett-like return potential from a blue-chip bargain hiding in plain sight.
Mastercard 2024 Consensus Total Return Potential

(Source: FAST Graphs, FactSet)
If LOW grows as expected and returns to historical mid-range market-determined fair value by the end of 2024, it could deliver 32% returns.
- 14% annual return potential
- 50% more than the S&P 500
Mastercard 2028 Consensus Total Return Potential
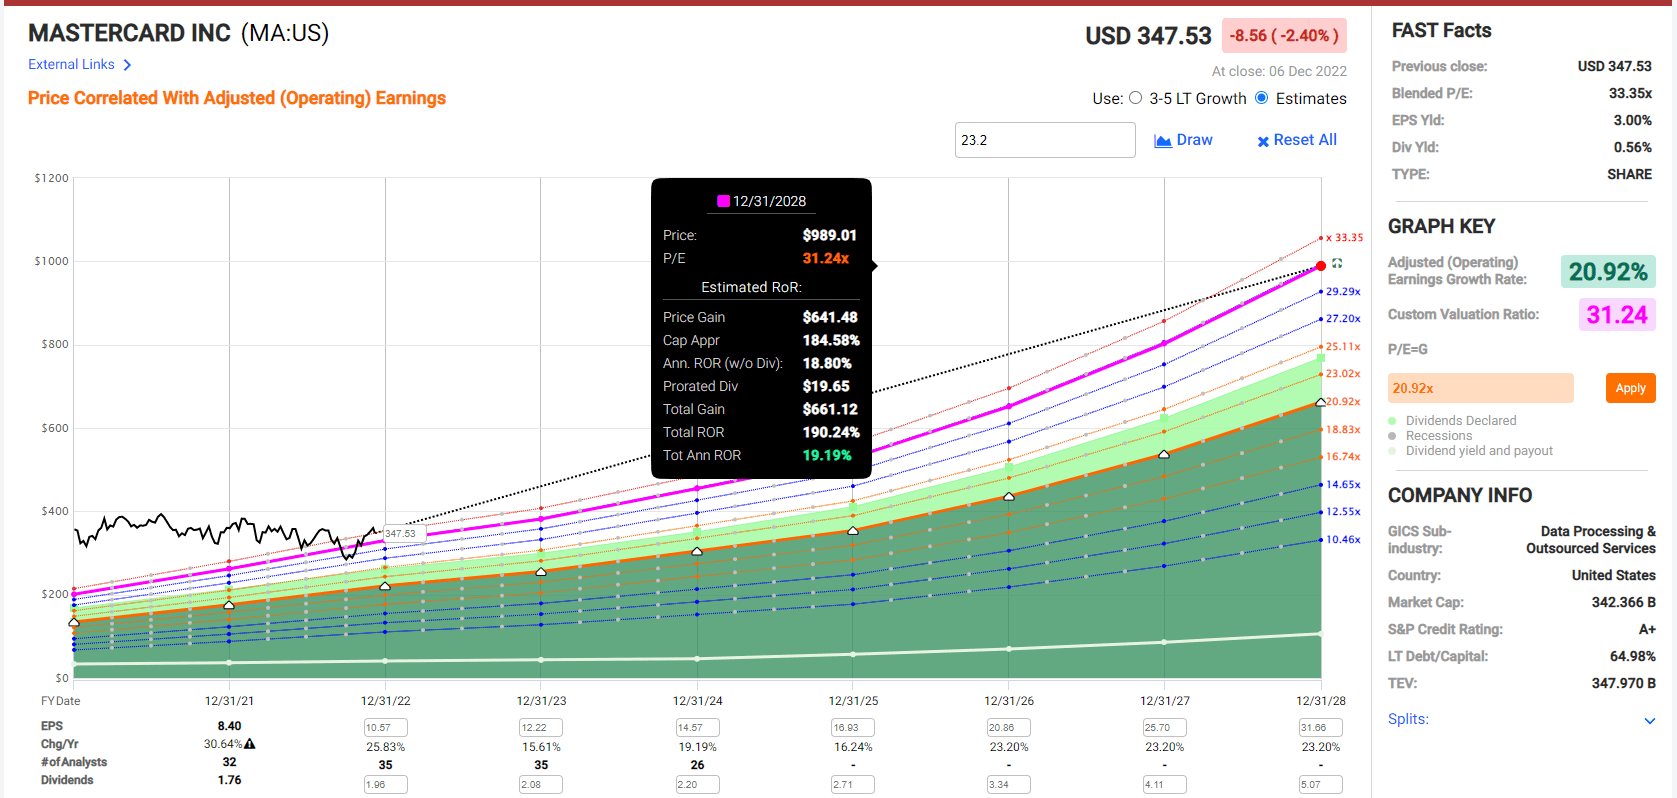
(Source: FAST Graphs, FactSet)
If MA grows as expected and returns to historical fair value, then it could almost triple in the next five years.
- 19% annual returns over the next five years
- 4X the S&P consensus
Mastercard Investment Decision Score

Dividend Kings Automated Investment Decision Tool
MA is as close to a perfect Ultra SWAN dividend growth opportunity for anyone comfortable with its risk profile. Look at how it compares to the S&P 500.
- 15% discount to fair value vs. 1% premium S&P = 16% better valuation
- very safe 0.7% yield growing 20% through 2028
- approximately 23.9% long-term annual return potential vs. 10.2% CAGR S&P
- about 2X higher risk-adjusted expected returns
Bottom Line: Amazon, Lowe’s, And Mastercard Could Potentially 6X Your Retirement Income
Let me be clear: I’m NOT calling the bottom in AMZN, LOW, or MA (I’m not a market-timer).
Ultra SWAN quality does NOT mean “can’t fall hard and fast in a bear market.”
Fundamentals are all that determine safety and quality, and my recommendations.
- over 30+ years, 97% of stock returns are a function of pure fundamentals, not luck
- in the short term; luck is 25X as powerful as fundamentals
- in the long term, fundamentals are 33X as powerful as luck
While I can’t predict the market in the short term, here’s what I can tell you about AMZN, LOW, and MA.
They are three of the highest-quality companies on Wall Street. They are quintessential world-beaters, all trading at good to spectacular valuations.
- AMZN is 56% historically undervalued
- 11X cash-adjusted earnings
Are income investors who own purely high-yield blue-chips like BTI, ENB, and MO wrong? No. But if you’re goal is maximum safe income throughout retirement, then you’re leaving a lot of dividends on the table.
- Combining ENB, MO, and BTI, with AMZN, LOW, and MA boosted your retirement income by 6X over the last 25 years
And as we’ve just seen, the growth engines at AMZN, LOW, and MA are firing all cylinders, creating an incredible opportunity to boost total returns and turbocharge your retirement income growth.
Not just in the second half of 2023, when the next bull market is likely to begin, and hyper-growth Ultra SWANs like these are likely to rocket higher. But for years or even decades to come.
35% of millionaires and 45% of Americans say it will take a miracle for them to retire. Well, my friends, retiring in safety and splendor doesn’t take a miracle; it just takes a diversified portfolio of the world’s best blue-chips, bought a treasonable to outrageously attractive prices.
Be the first to comment