

ArLawKa AungTun/iStock via Getty Images
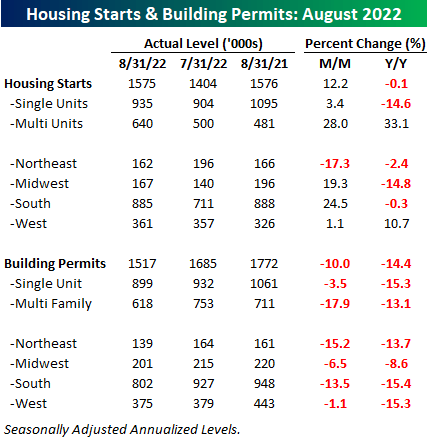
Relative to expectations, Tuesday’s report on Building Permits and Housing Starts was mixed, but overall, it was pretty lousy. Housing Starts exceeded expectations by over 100K, but Building Permits missed expectations by nearly 100K, and as shown in the table below, both are currently down on a year/year basis. Within the better-than-expected Housing Starts report, practically all of the strength was in multi-family units which increased 28% m/m. Single-family units were also positive but increased at just a fraction of the rate of multi-family units. Building Permits were a more gloomy part of the report. with the headline reading down 10% m/m and 14.4% y/y. On a regional basis, Permits were down across the board, with weakness concentrated in the Northeast and South.
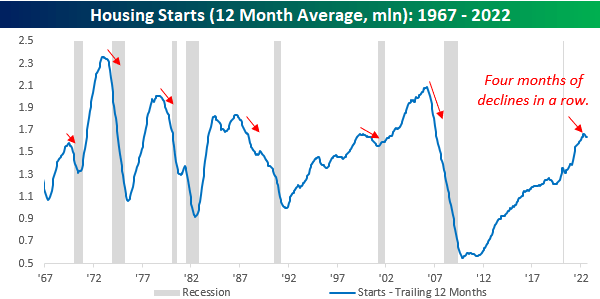
As we have highlighted frequently over the years, Housing Starts have been an excellent leading indicator of the economic cycle. With the exception of the COVID crash, every other recession since the mid-1960s was preceded by a rollover in the 12-month average of Housing Starts (even ahead of COVID, Housing Starts technically rolled over from a peak, but nothing of the magnitude like they did ahead of prior recessions). The current magnitude of decline from the recent peak is by no means near the severity of rollovers leading up to prior recessions, but there has been a clear trend of weakness in this reading, with four straight months of declines in the 12-month moving average.
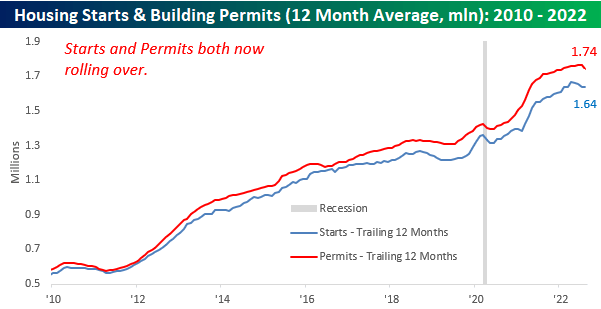
Looking more closely at the post-financial crisis trends in Housing Starts and Building Permits, both appear to have reached at least a short-term peak. Building Permits had been holding up in the months leading up to August’s report, but with a current reading of 1.517 million replacing a reading of 1.772 million from 12 months ago, the one-year average took a sharp turn lower. In fact, the last time it dropped as much as it did this month was back in mid-2009.
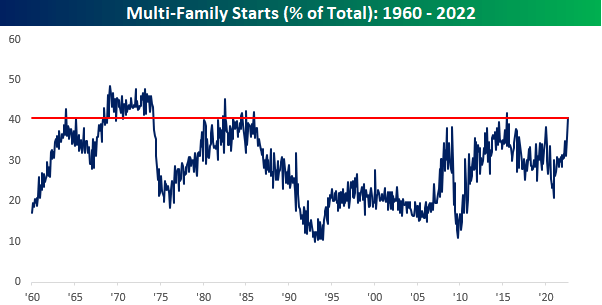
Finally, with the release of each month’s Housing Starts report, a phrase you increasingly hear is something along the lines of “but all the strength was in multi-family units”. As noted above, that was the case again this month, and so much so that multi-family starts accounted for over 40% of all starts. Relative to recent history, that’s a very high percentage, and outside of one month in June 2015 when the reading was distorted due to the expiration of a tax break for multi-family units in New York, it’s the highest reading since 1985. Given their smaller size, multi-family units aren’t considered to be nearly as economically impactful as single-family units, and therefore, suggests that the strength of the August report wasn’t as much as it looked at the surface.
Editor’s Note: The summary bullets for this article were chosen by Seeking Alpha editors.
Be the first to comment