

Petmal
By Robert Hughes
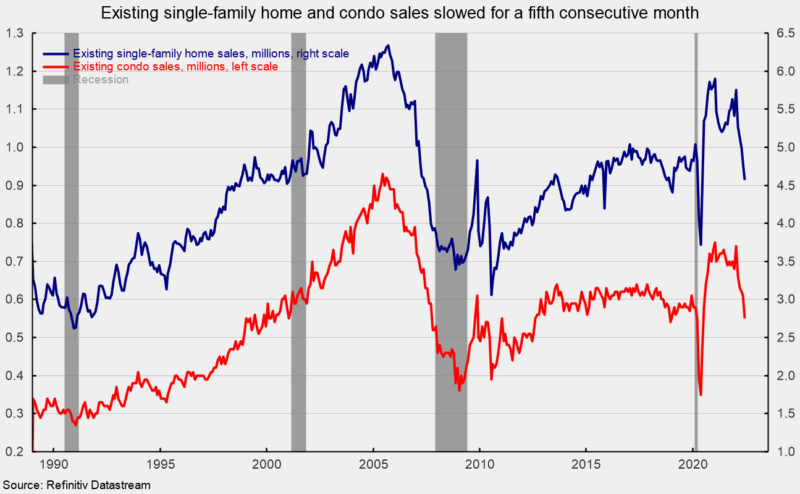
Sales of existing homes sank another 5.4 percent in June, to a 5.12 million seasonally adjusted annual rate. That is the fifth consecutive monthly decline, leaving the selling pace at the lowest level since June 2020 following the lockdown recession. Sales were down 14.2 percent from a year ago and 21.1 percent from the January peak.
Sales in the market for existing single-family homes, which account for about 89 percent of total existing-home sales, dropped 4.8 percent in June, coming in at a 4.57 million seasonally adjusted annual rate (see first chart). Sales were down 12.8 percent from a year ago and 20.5 percent from the January peak. Single-family sales also fell for the fifth consecutive month and were at their slowest pace since June 2020.
The single-family segment saw sales decline in three of the four regions. Sales fell 10.6 percent in the West, 5.6 percent in the South, the largest region by volume, and 0.9 percent in the Midwest, while sales were unchanged in the Northeast, the smallest region by volume. Measured from a year ago, sales were down in all four regions (-20.8 percent in the West, -11.5 percent in the South, -11.1 percent in the Northeast, and -9.4 percent in the Midwest).
Condo and co-op sales fell 9.8 percent for the month, leaving sales at a 550,000 annual rate for the month versus 610,000 in May (see first chart). Measured from a year ago, condo and co-op sales were off 24.7 percent, and were at their slowest pace since June 2020.
Condo and co-op sales were down in three regions in June, falling 14.3 percent in the West, 12.5 percent in the Midwest, and 10.7 percent in the South while sales were unchanged in the Northeast. From a year ago, sales were down in all four regions (-30.6 percent in the South, -25.0 percent in the West, -15.4 percent in the Northeast, and -12.5 percent in the Midwest).
Total inventory of existing homes for sale rose in June, increasing by 9.6 percent to 1.26 million, leaving the months’ supply (inventory times 12 divided by the annual selling rate) up 0.4 months at 3.0, the highest since November 2020 but still low by historical comparison, but the fifth consecutive increase.
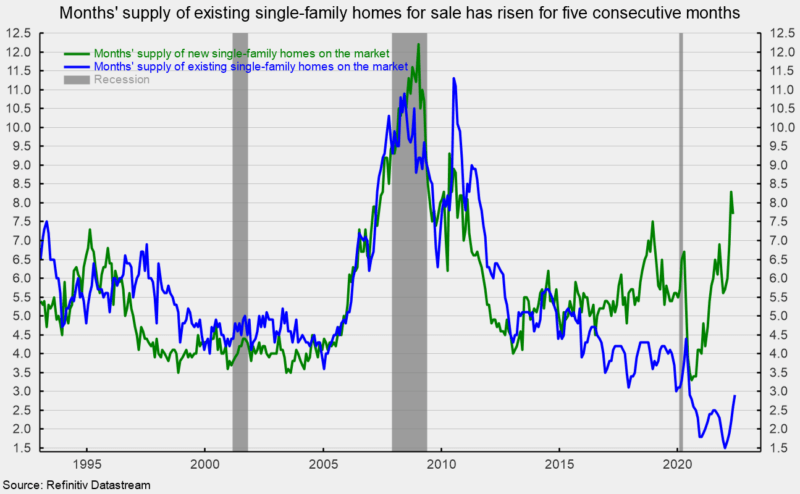
For the single-family segment, inventory was up 9.8 percent for the month at 1.12 million and is 5.7 percent above the June 2021 level. The months’ supply was 2.9, up from 2.6 in the prior month, matching the July 2020 result (see second chart).
The condo and co-op inventory increased 7.7 percent to 140,000, pushing the months’ supply up to 3.1 from 2.6 in May. Months’ supply is 10.7 percent above June 2021 and has risen for five consecutive months.
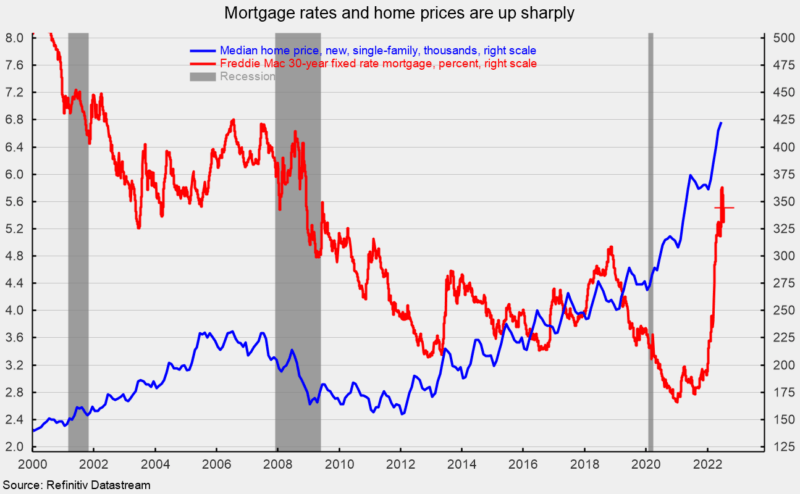
The median sale price in June of an existing home was $416,000, 13.4 percent above the year-ago price and a new record high. For single-family existing home sales in June, the price was $423,300, a 13.3 percent rise over the past year and a record high (see third chart). The median price for a condo/co-op was $354,900, 11.5 percent above June 2021 and also a record high. At the same time, mortgage rates have rocketed higher recently, reaching 5.50 percent by mid-July (see third chart).
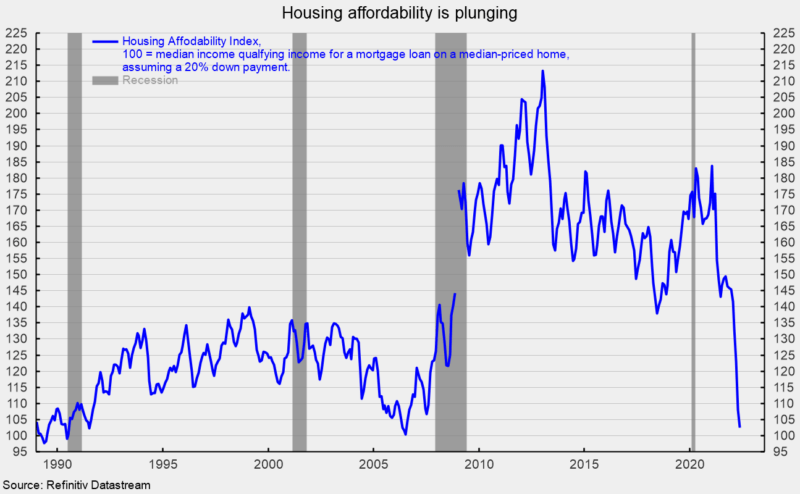
The combination of record-high home prices and sharply higher mortgage rates has sent housing affordability plunging. The Housing Affordability Index from the National Association of Realtors measures whether or not a typical family could qualify for a mortgage loan on a typical home. A typical home is defined as the national median-priced, existing single-family home as calculated by NAR. The typical family is defined as one earning the median family income as reported by the U.S. Bureau of the Census. A value of 100 means that a family with the median income has exactly enough income to qualify for a mortgage on a median-priced home. An index above 100 signifies that a family earning the median income has more than enough income to qualify for a mortgage loan on a median-priced home, assuming a 20% down payment. As of May, the index stood at 102.5, the lowest since July 2006 (see fourth chart).
Housing is likely to be under intense pressure as record-high prices and the recent surge in mortgage rates reduce affordability and push more and more buyers out of the market.
Editor’s Note: The summary bullets for this article were chosen by Seeking Alpha editors.
Be the first to comment