

Justin Sullivan/Getty Images News
Hormel Foods (NYSE:HRL) is much more than their well-known packaged meats and of course the iconic SPAM and Hormel Brand Chili. Hormel has spent much of the last decade transforming their business into healthier food options including Justin’s Nut Butter, Wholly Guacamole, Jennie-O turkey, and most recently acquired the Planters nut business.
That transition has served the business, and investors, well as it’s led to some higher growth and higher margin subsidiaries coming into the fold. As consumers continue to search out healthier alternatives, Hormel is now positioned to continue to serve their customers.
Many consumer staples and consumer packaged goods companies have struggled with inflationary pressures. However, Hormel has combated that quite well with continued revenue growth that was driven largely from increased pricing. That led to Q2 sales showing an impressive 19% increase year-over-year with operating margins seeing just slight compression over that time.
Hormel reached a new all-time high back in April of this year; however, since then shares have pulled back nearly 14%. Hormel is a wonderful, defensive business that can allow investors to have a strong ballast to their portfolio compared to the high-flyers, and sometimes fast-fallers.
Dividend History
The majority of my capital is invested in dividend growth stocks. The dividend growth strategy appealed to me when I began my investment journey because the concept is simple: find quality businesses that have a history of paying and growing the dividend, focus on the underlying business, and don’t pay too much for it.
Hormel Foods Dividend History (Hormel Foods Investor Relations)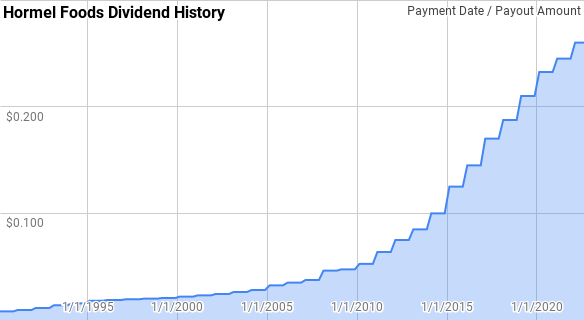
Hormel is a Dividend King with 56 consecutive years of dividend growth. That’s a period of time that covers all sorts of economic booms and busts as well as market crashes and far too many geopolitical issues to count. Yet every year for over half a century, Hormel has been a steady hand rewarding owners with higher dividends.
Since 1990 Hormel’s year over year dividend growth has ranged between 2.6% to 25.0% with an average of 11.6% and a median of 10.7%.
Over that same time there’s been 28 rolling 5-year periods with Hormel’s annualized dividend growth spanning from 3.9% to 18.9% with an average of 11.4% and a median of 11.2%.
There’s also been 23 rolling 10-year periods with annualized dividend growth coming in between 6.0% and 16.3% with an average of 11.1% and a median of 10.7%.
The rolling 1-, 3-, 5-, and 10-year annualized dividend growth rates from Hormel since 1990 can be found in the following table.
| Year | Annual Dividend | 1 Year DGR | 3 Year DGR | 5 Year DGR | 10 Year DGR |
| 1990 | $0.032 | ||||
| 1991 | $0.038 | 16.0% | |||
| 1992 | $0.045 | 20.2% | |||
| 1993 | $0.055 | 22.1% | 19.4% | ||
| 1994 | $0.062 | 13.0% | 18.4% | ||
| 1995 | $0.072 | 16.0% | 17.0% | 17.4% | |
| 1996 | $0.075 | 3.9% | 10.9% | 14.9% | |
| 1997 | $0.078 | 3.2% | 7.5% | 11.4% | |
| 1998 | $0.080 | 3.1% | 3.4% | 7.7% | |
| 1999 | $0.082 | 3.0% | 3.1% | 5.7% | |
| 2000 | $0.088 | 6.3% | 4.1% | 3.9% | 10.5% |
| 2001 | $0.092 | 5.5% | 4.9% | 4.2% | 9.4% |
| 2002 | $0.098 | 5.6% | 5.8% | 4.7% | 8.0% |
| 2003 | $0.105 | 7.8% | 6.3% | 5.6% | 6.7% |
| 2004 | $0.112 | 6.8% | 6.7% | 6.4% | 6.1% |
| 2005 | $0.130 | 15.7% | 10.0% | 8.2% | 6.0% |
| 2006 | $0.140 | 7.7% | 10.0% | 8.7% | 6.4% |
| 2007 | $0.150 | 7.1% | 10.1% | 9.0% | 6.8% |
| 2008 | $0.185 | 23.5% | 12.5% | 12.0% | 8.8% |
| 2009 | $0.190 | 2.6% | 10.7% | 11.1% | 8.7% |
| 2010 | $0.210 | 10.7% | 11.9% | 10.1% | 9.2% |
| 2011 | $0.255 | 21.3% | 11.3% | 12.8% | 10.7% |
| 2012 | $0.300 | 17.6% | 16.4% | 14.9% | 11.9% |
| 2013 | $0.340 | 13.3% | 17.3% | 12.9% | 12.4% |
| 2014 | $0.400 | 17.6% | 16.2% | 16.1% | 13.5% |
| 2015 | $0.500 | 25.0% | 18.6% | 18.9% | 14.4% |
| 2016 | $0.580 | 16.0% | 19.5% | 17.8% | 15.3% |
| 2017 | $0.680 | 17.2% | 19.3% | 17.8% | 16.3% |
| 2018 | $0.750 | 10.3% | 14.5% | 17.1% | 15.0% |
| 2019 | $0.840 | 12.0% | 13.1% | 16.0% | 16.0% |
| 2020 | $0.930 | 10.7% | 11.0% | 13.2% | 16.0% |
| 2021 | $0.980 | 5.4% | 9.3% | 11.1% | 14.4% |
| 2022 | $1.040 | 6.1% | 7.4% | 8.9% | 13.2% |
Source: Author; Data Source: Hormel Foods Investor Relations
The dividend payout ratio is a quick way to measure to measure the sustainability of a dividend by comparing the dividend payment versus either profits or cash flow. All else being equal a lower dividend payout ratio is better as it allows more room for the inevitable business specific issues without jeopardizing the dividend while also allowing more potential room for future growth.
HRL Dividend Payout Ratios (HRL SEC filings)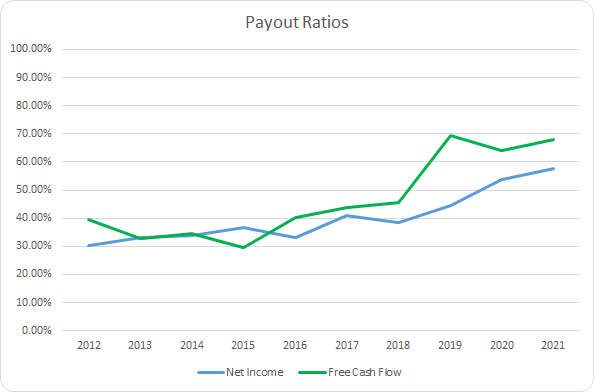
Hormel’s payout ratio has clearly been on the rise over the last decade meaning that the dividend has grown faster than the growth in underlying profits or free cash flow. The 10-year average net income payout ratio is 40.2% with the 5-year average at 47.0%. Similarly, the average free cash flow payout ratios are 46.7% and 58.2%, respectively.
Quantitative Quality
A lengthy dividend growth history is just one metric that I like to see from the businesses that I invest in. There’s several other financial metrics that I track to see how the business is performing over time and whether I believe it’s sustainable.
HRL Revenue Profits and Cash Flow (HRL SEC filings)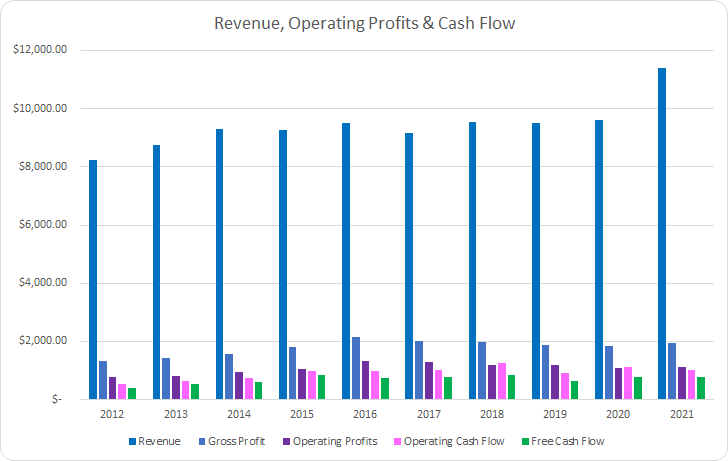
Over the last decade Hormel has managed to grow revenues by 38.3% in total or 3.7% annualized. That growth came through organic means as well as through various acquisitions. Gross profits improved by 44.7% or 4.2% annualized.
Similarly, Hormel’s operating profits increased by 46.8% or 4.4% annualized; however, operating cash flow showed dramatic improvement rising by 93.4% or 7.6% annualized. Free cash flow outpaced the others increasing by 99.5% or 8.0% annualized.
A quality business should be able to show at a minimum stable margins over time. I typically look for free cash flow margins that are greater than 10% as a sign of a strong cash generating enterprise.
HRL Margins and CCR (HRL SEC filings)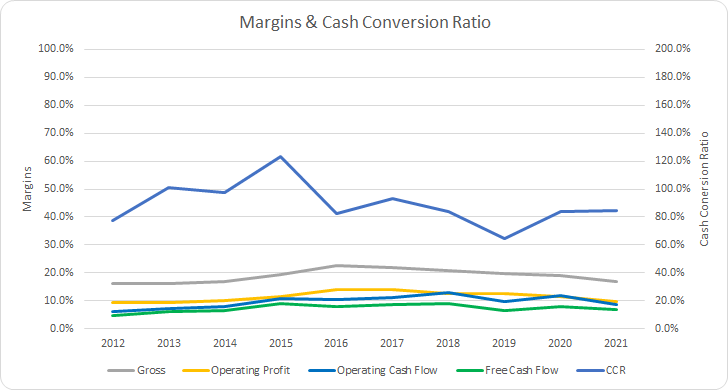
Hormel showed steady improvements in their gross margin in the first half of the decade; however, it has essentially round-tripped back to where it began over the second half. The 10-year average gross margin for Hormel is 19.0% with the 5-year average at 19.7%.
While Hormel’s free cash flow margins have retreated they still show solid improvement over the last decade. The 10-year average free cash flow margin is 7.3% with the 5-year average coming to 7.8%. Unfortunately, Hormel’s free cash flow margin hasn’t reached the 10% level that I like to see even once over the last decade.
While the free cash flow margin lets you know how much of each dollar of sales is turned into free cash flow, I also track how efficient the business is at generating free cash flow from its assets and capital base. Once again I expect a quality business to show stale or rising returns over time and want to see free cash flow returns on invested capital greater than 10%.
HRL Free Cash Flow Returns (HRL SEC filings)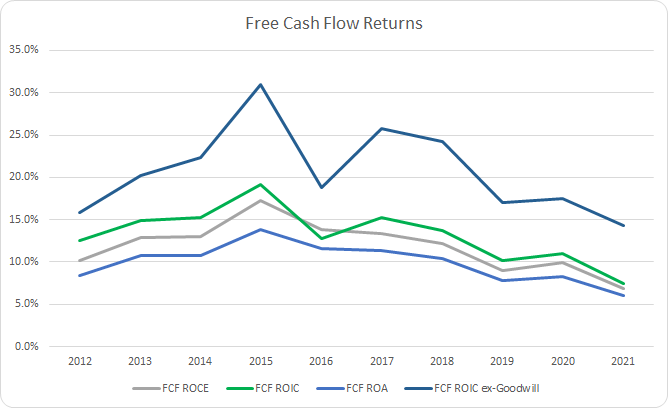
That’s not exactly the best looking return profile for Hormel with each metric trending poorly since 2015. However, Hormel has surpassed the 10% FCF ROIC level in every year save for 2021 during the last decade. The 10-year average FCF ROIC is 13.2% with the 5-year average coming to 12.9%.
To understand how Hormel uses its free cash flow, I calculate three variations of the metric, defined below:
- Free Cash Flow, FCF: Operating cash flow less capital expenditures
- Free Cash Flow after Dividend, FCFaD: FCF less total cash dividend payments
- Free Cash Flow after Dividend and Buybacks, FCFaDB: FCFaD less net cash used on share repurchases
HRL Free Cash Flows (HRL SEC filings)
Over the last decade, Hormel’s business has generated $6.9 B in FCF while sending $3.3 B to owners via dividends. That puts the cumulative FCFaD at a healthy $3.6 B. While Hormel has used share repurchases, they have not been a preferred means to return additional cash to owners. Over the last decade Hormel has spent a net total of just $0.3 B on buybacks putting the cumulative FCFaDB at $3.3 B.
If a company has excess free cash flow after paying their dividend, my preference would be for special dividends or a higher baseline dividend payment; however, I realize that share buybacks will be the likely use for that cash flow.
HRL Shares Outstanding (HRL SEC Filings)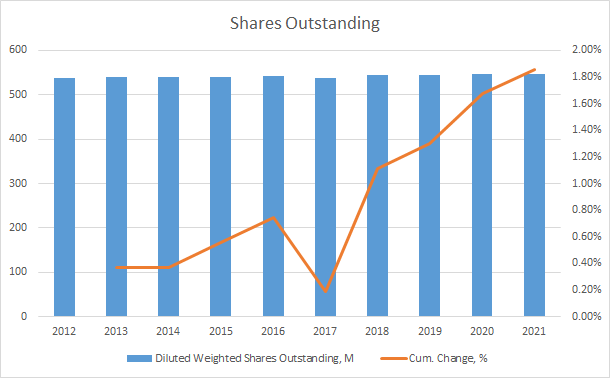
Hormel has not typically been a serial share repurchaser spending over $11 on dividends for every $1 of net buybacks during the last decade. Their share count has actually shown a slight rise over that time increasing by a total of 1.9%.
As an investor in the equity of a business, I want to make sure that the balance sheet is not overburdened with debt. While I prefer no debt as it introduces potential risks, I also realize that most companies will carry some amount of debt.
HRL Debt to Capitalization Ratio (HRL SEC filings)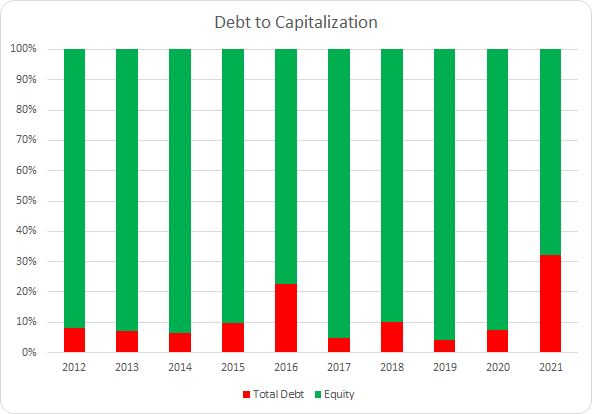
Hormel has typically eschewed much debt financing while carrying a very strong balance sheet. The 10-year average debt-to-capitalization ratio works out just 11% with the 5-year average coming to just 12%. The Planters acquisition completed last year did substantially increase the debt-to-capitalization ratio; however, it’s still at very conservative levels.
In conjunction with the debt-to-capitalization ratio I also track the net debt ratios to get a better idea of how burdensome the debt load is. The net debt ratios compare the net debt versus some measure of profits or cash flow. They let you know how quickly the business could de-lever assuming no major changes to the underlying business.
HRL Debt Ratios and Interest Coverage (HRL SEC filings)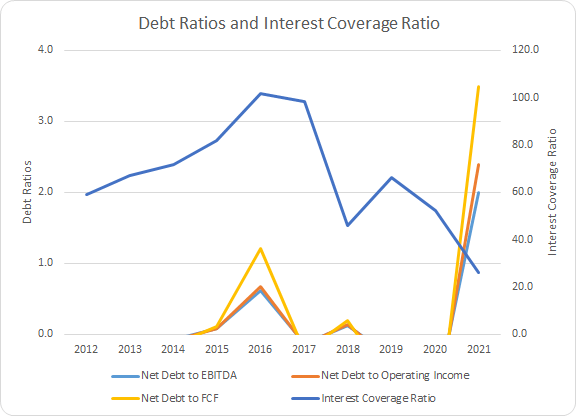
Reinforcing the prudent use of leverage by Hormel is the low overall net debt ratios. In 6 of the last 10 years Hormel carried more cash than total debt which is very conservative. Even after the Planters acquisition introduced a relatively hefty amount of debt, Hormel’s net debt ratios still appear very manageable and I expect them to trend back down towards even more conservative levels.
The 10-year average net debt-to-EBITDA, net debt-to-operating income, and net debt-to-FCF ratios are 0.1x for each metric. The 5-year averages work out to 0.1x, 0.2x, and 0.2x. Similarly, the interest coverage ratio, while declining, is still more than adequate at over 26x for FY 2021.
Valuation
When trying to value an investment I employ several valuation methods that in an attempt value the business from different perspectives. The methods that I utilize are dividend yield theory, a reverse discounted cash flow analysis, and a minimum acceptable rate of return, “MARR”, analysis.
Analysts expect Hormel to report FY 2022 EPS of $1.86 with FY 2023 EPS of $2.04. They also expect Hormel to be able to achieve 8.6% annual EPS growth over the next 5 years. I then assumed that Hormel would be able to sustain EPS growth of 5.0% annually for the following 5 years. Dividends are assumed to target a 55% payout ratio.
We also need to determine what we could expect for potential terminal or exit multiples in order to determine the value of the business at some future date in order to complete the MARR analysis. Over the last decade Hormel has typically been valued between approximately 15x to 30x with a longer run multiple in the 20x to 25x range.
The following table shows the potential internal rates of return that an investment in Hormel could generate provided the assumptions listed above prove to be reasonable forecasts for how the future plays out. Returns assume a purchase price of $47.22, Wednesday’s closing price. Dividends are assumed to be paid in cash and follow Hormel’s historic payment and increase schedule.
| IRR | ||
| P/E Level | 5 Year | 10 Year |
| 30 | 15.5% | 11.0% |
| 25 | 11.0% | 9.1% |
| 22.5 | 8.5% | 8.0% |
| 20 | 5.9% | 6.8% |
| 17.5 | 2.9% | 5.5% |
| 15 | -0.4% | 4.0% |
Source: Author
Alternatively, I use the framework developed for the MARR analysis to determine what price I could pay for shares today in order to generate the returns that I desire from my investments. My standard hurdle rate is a 10% IRR and for Hormel I’ll also examine 12% and 8% return targets.
| Purchase Price Targets | ||||||
| 10% Return Target | 12% Return Target | 8% Return Target | ||||
| P/E Level | 5 Year | 10 Year | 5 Year | 10 Year | 5 Year | 10 Year |
| 30 | $59 | $52 | $55 | $45 | $64 | $61 |
| 25 | $50 | $45 | $47 | $39 | $54 | $53 |
| 22.5 | $46 | $41 | $43 | $36 | $49 | $48 |
| 20 | $41 | $38 | $38 | $33 | $44 | $44 |
| 17.5 | $36 | $34 | $34 | $30 | $39 | $40 |
| 15 | $32 | $31 | $30 | $27 | $34 | $35 |
Source: Author
Dividend yield theory is a simple valuation method that is best suited for stable businesses that have a history of paying dividends to shareholders. The theory operates under the premise that investors will value a business around a normal dividend yield over time. For Hormel I’ll use the 3-year average forward dividend yield as a proxy for fair value.
Hormel Foods Dividend Yield Theory (HRL Investor Relations and Google Finance)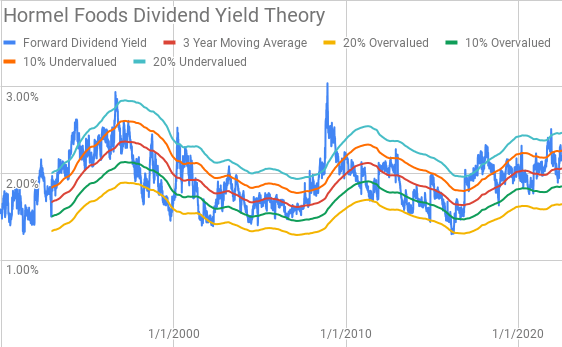
Hormel currently offers a forward dividend yield of 2.20% compared to the 3-year average forward yield of 2.05% suggesting shares are roughly 10% undervalued at the moment. The dividend yield band has been a relatively good predictor of under- and over-valuation whenever the yield reaches either the +/-20% level.
A reverse discounted cash flow analysis can be used as a reality check on what the current market valuation implies about market participants’ collective expectation is for the future cash flows of the business. I use a simplified DCF model based on revenue growth, an initial free cash flow margin of 8.0% that improves to 9% during the forecast period, and a terminal growth rate of 3.5%.
To discount the cash flows back to the present I use an after tax cost of debt of 3.46% along with a cost of equity of 10% and 8%. That gives a WACC of 9.3% and 7.5%, respectively, which I’ll use as the discount rate for the present value.
Based on those assumptions Hormel needs to grow revenues 9.6% annually during the forecast period in order to generate the cash flows necessary to justify the current market valuation with a WACC of 9.3%. Reducing the required return to 8%, WACC of 7.5%, lowers the necessary revenue growth rate to 3.9% annually for the forecast period.
Conclusion
Hormel is a quality business that I’m glad that I own although not in nearly enough size. They aren’t the most profitable business out there with pretty tight gross margins around 19.0%, operating margins of ~11%, and free cash flow margins between 7-8%. While their margins are quite narrow, they are dominant in their end markets.
The Hormel Foundation’s large ownership stake allows for management to take truly focus on the long-term positioning of the company without being overly worried about short-term issues. That’s a huge advantage that most management teams don’t have.
Dividend yield theory gives a fair value range for Hormel between $46 and $56. Meanwhile the MARR analysis based on a 10% return target and an exit multiple between 20x and 25x 5 years from now suggests a fair value range between $41 and $50. With an 8% return target the fair value range rises to $44 to $54.
The reverse DCF model implies that 10% returns are probably not likely unless you believe that a significant margin expansion will be underway for Hormel as the required revenue growth appears quite lofty. However, 8% returns do seem quite achievable from current prices.
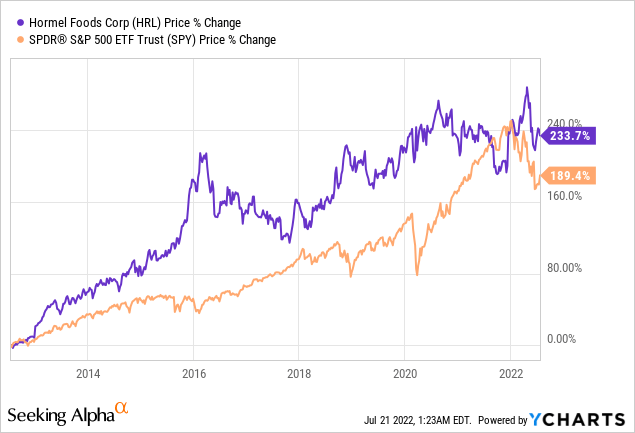
Hormel is one of those stealth compounders that just continues to fly under the radar because of its boring business. Over the last decade Hormel has handily outperformed the S&P 500, via S&P 500 ETF Trust (SPY). Not bad for a little packaged foods company.
Hormel has weathered the inflationary storm quite well. During the Q2 FY 2022 earnings release, operating margin held in strong at 10.8%. Compared to many other consumer staples businesses Hormel has been quite resilient passing along costs to customers. If Hormel can continue to pass on any future inflationary that bodes well for shareholders.
In my opinion shares of Hormel are at a level where a purchase makes sense for long-term investors. However, given that I have a stake in the business already I personally would be holding out for more attractive price levels. I believe that an additional purchase of shares sub-$45 would be more attractive with an ideal purchase coming closer to $40.
At those levels I believe that the expected returns for this great business should be more than adequate with a very high likelihood of greater than 10% returns over time. That’s an excellent level from which to add shares of a business that continues to prove itself over time and carries what I believe to be very limited downside risk to the underlying business.
Be the first to comment