


Mohammed Haneefa Nizamudeen
September numbers for home prices across the country were released by S&P CoreLogic Case Shiller this morning. Below is a look at how much home prices are up since February 2020 just before COVID hit. The National index is up 41%, while Tampa, Phoenix, and Miami are all up 63% or more. At the lower end of the gains are Washington DC, Minneapolis, San Francisco, and Chicago with price increases between 27% and 31%.
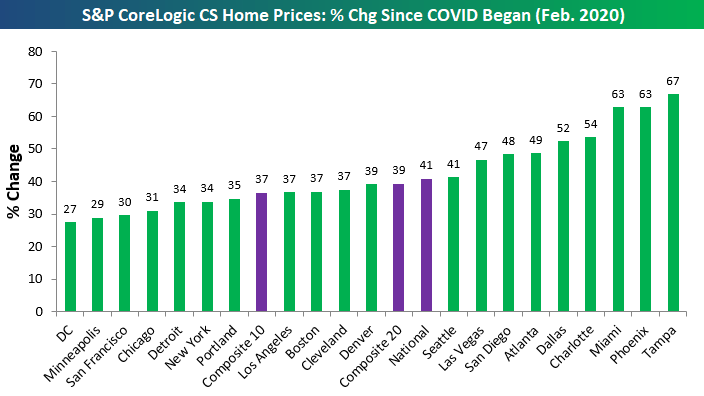
S&P CoreLogic CS Home Prices: % Change Since Covid Began (February 2020) (Author)
Prices are off of their post-COVID highs, however, and remember that this data is only through September. We’ve likely seen prices fall even further over the last two months. As shown below, the 10-city and 20-city composite indices are down 3.9%, while the National index is down 2.6%. San Francisco and Seattle have seen the biggest drops in home prices so far with declines of more than 11%. San Diego is down 7.9%, Los Angeles is down 6.0%, and Denver is down 5.7%. Cleveland, Chicago, Atlanta, Miami, New York, and Tampa have thus far seen the smallest drops from their highs with declines ranging from -0.8% to -1.3%.
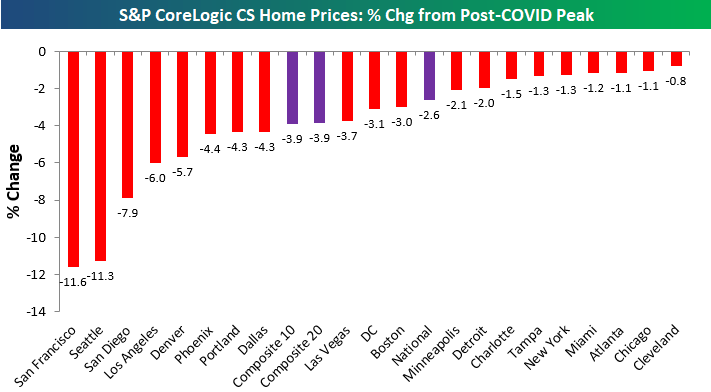
S&P CoreLogic CS Home Prices: % Change From Post-Covid Peak (Author)
Below is a table showing the data from the two charts above along with a look at month-over-month and year-over-year percentage change. So far at least, cities in the western US have seen the biggest declines from their post-COVID highs, while areas in the southeastern US and south Florida that saw some of the biggest post-COVID gains have only seen minimal declines.
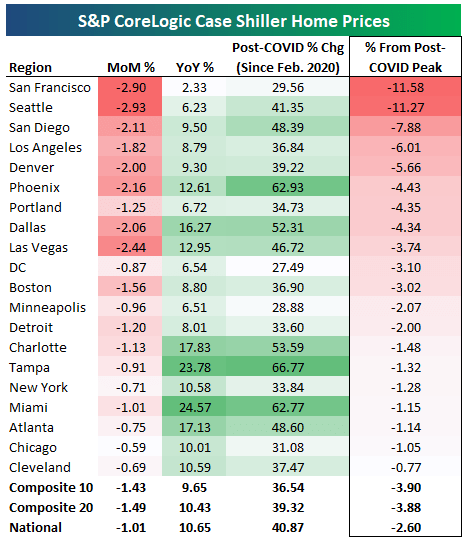
S&P CoreLogic Case Shiller Home Prices (Author)
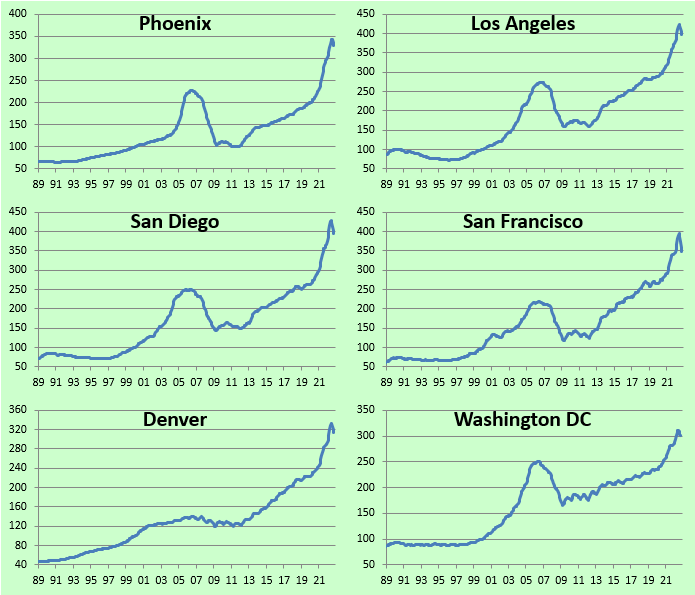
Below are long-term charts of the twenty individual city home price indices along with the National and 10-city and 20-city Composite indices. These charts really show how much home prices rose over the last couple of years and how small the declines have been so far. The recent drop has been like going from the 100th floor down to the 99th floor of an NYC skyscraper.
Author
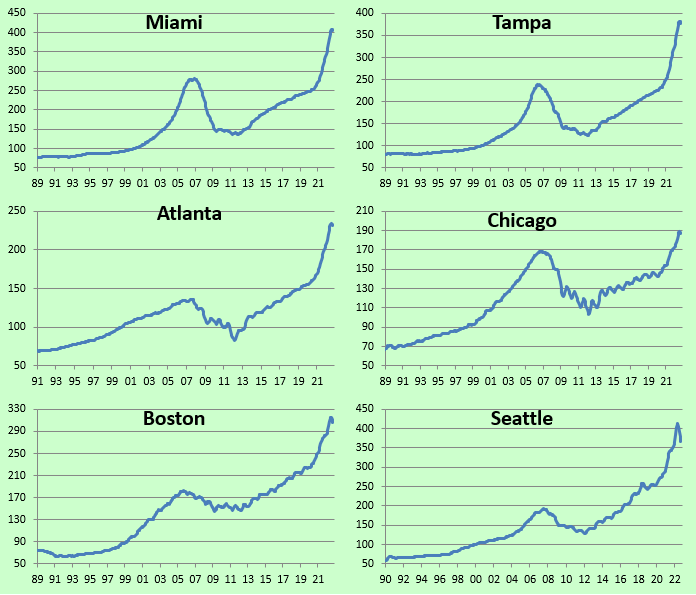
Author
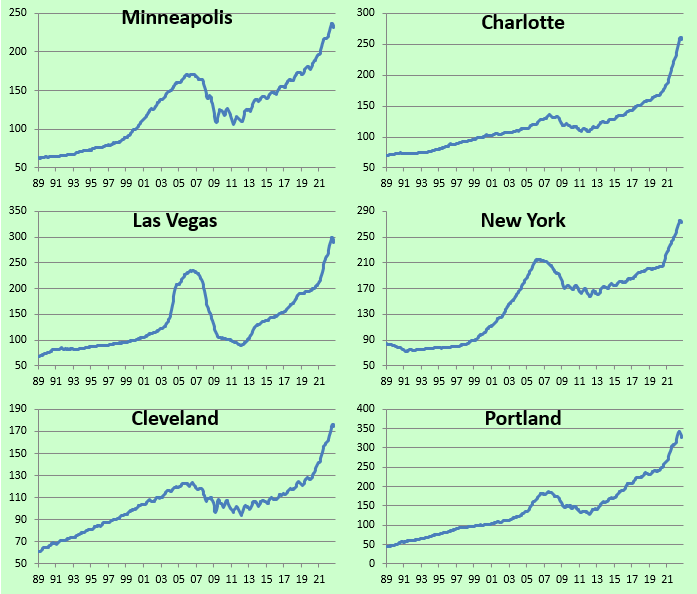
Author
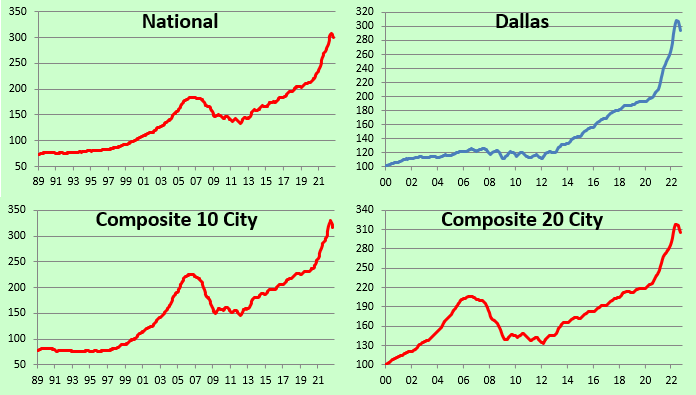
Author
Editor’s Note: The summary bullets for this article were chosen by Seeking Alpha editors.
Be the first to comment