

littleny/iStock Editorial via Getty Images
Home Depot (NYSE:HD) has outpaced the S&P 500 ETF (SPY) since mid-October, when it saw itself down 34% year to date vs. SPY down 24%, to a gap of only 2% today.
HD chart (seekingalpha)
Home Depot is buoyed by higher mortgage rates where folks will stay in their aging house and upgrade rather than buying another house.
Analysts are catching on to Home Depot’s strong spot in the new high interest rate economy with the most EPS upgrades in recent history. For the Feb. 21, 2023, earnings announcement, HD has 26 upgrades.
EPS chart (orats.com)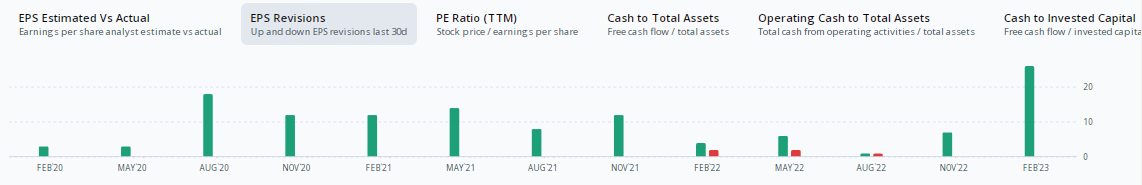
Analyst Love
The Home Depot operates as a home improvement retailer. It operates stores that sell various building materials, home improvement products, lawn and garden products, and décor products, as well as facilities maintenance, repair, and operations products. The company also offers installation services for flooring and cabinets.
Home Depot was recently named by Cowen in its top investment ideas for 2023. Analyst Max Rakhlenko raised his price target to $379 from $350, citing that the market is undervaluing the benefits that HD is getting from its Pro Xtra efforts.
According to Home Depot’s website:
Pros are important customers to us and we treat you that way. Enjoy exclusive Pro Benefits and business tools to save you time and money, while helping grow your business. From competitive pricing and special shipping and delivery options to advanced online business tools that help you stay organized – our goal is to give the Pros we work with everything they need to succeed.
Their effort seems to be working. According to Oppenheimer, the “positive sales numbers found support from do-it-yourselfers, as well as professional builders and contractors. Professional customers, according to HD sources, reported solid backlogs supporting their business purchases.”
HD: Low P/E Relative to the Stock’s History
Seeking Alpha valuation is strong and we find that Home Depot trades at a very reasonable 20.0 P/E – that’s a 9% discount to its historical average over the last 12 quarters.
PE Ratio History (orats.com)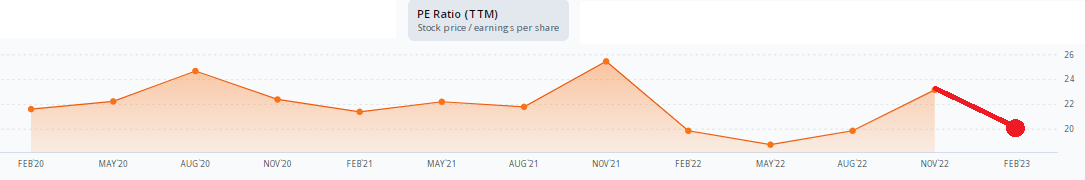
Home Depot shines in its profitability with an A+ rating from Seeking Alpha. The firm’s EBIT margin is high at 15.5%, compared to just 7.9% in the consumer discretionary sector. EBIT is also higher than its five-year average, suggesting that Home Depot is on the right path. Finally, net income per employee (ttm), a good way to normalize performance, is $34.9K compared to the sector’s $12.6K and HD’s five-year average of $27.9K.
Home Depot: A Dividend Machine
Home Depot pays a quarterly dividend of $1.90 that translates into a 2.3% dividend yield. HD has raised its dividend consistently into the March payment on average by 18.7% since 2017.
HD quarterly dividend history (orats.com)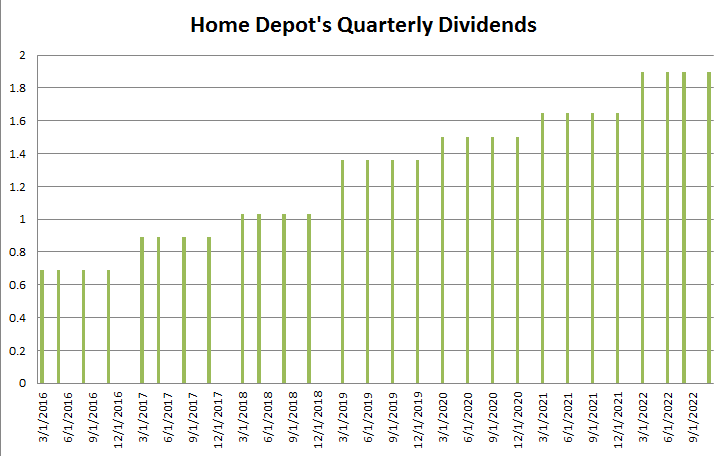
Income Options Trade
As we explained in our previous article involving a short put spread, we utilize various parameters to identify the best risk reward and probability of profit tradeoff.
The Short Put Spread on Home Depot
The top result was a bullish short put spread on HD expiring on Dec. 30. Selling the $310 strike put and going long the $305 strike put complete the trade. With a risk/reward ratio of 1:6.1 and a high probability of profit at 82%, the trade looks good for those with a near-term time horizon. The max gain is $70, while the max loss is $430 as of near the close on Friday, Dec. 30. The delta is low at just 0.06 and the market width is $0.44 total for both options in the trade. In all, you collect $70 of premium at the onset of the trade and would obtain this max gain so long as the stock is at or above the breakeven price of $309.30, representing the short higher strike put at expiration less the credit received.
The profit and loss distribution illustrated below shows that shares can pull back further before losses are incurred. Here’s a look at the payoff picture for the short put spread:
Options Trade Payoff Picture (orats.com)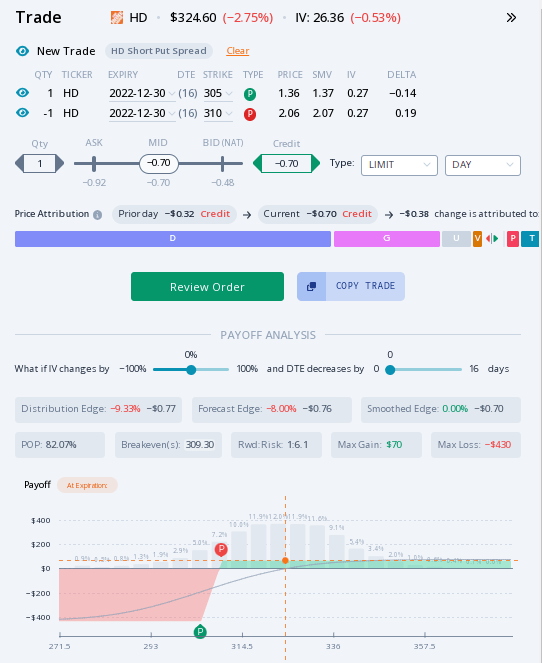
Technicals Support the Trade
HD has recently rallied from its October lows, forming an uptrend. The stock price has bumped off of upper resistance and lower support, strengthening the trend channel from a technical perspective. The lower support in the $320s fits the options trade well.
HD Is in a Continuing Uptrend
HD stock chart with trend channel (seekingalpha)
Home Depot shares are in a nice uptrend rally off the October lows and have strong fundamentals behind them. The trendline pattern shows support at $320. Options traders can play this trend with a short put spread using the $310 and $305 strikes expiring Dec. 30.
Be the first to comment