

patty_c/iStock Unreleased via Getty Images
Since the exiting of the founders in the early 2000s, The Home Depot (NYSE:HD) has built themselves into an American retail behemoth. During a tough two decades for brick and mortar retailers, the company has successfully defended its brand in a new age of digital retail. I see Home Depot as a hold at current prices, but believe the company could be a buy if the market overreacts too negatively to normalizing DIY demand. This article is designed to prepare you for that possibility by analyzing company’s economics over the past 2 decades. If you’re looking for a quick prediction for the next quarter, this isn’t the read for you. The objective here is to explore big-picture business fundamentals since the exit of the founders.
We’ll start with an introduction to the approach. The equation below breaks down return-on-equity (ROE) for most brick and mortar retailer. If you’re interested in a more detailed discussion about the breakdown, click on the link below where I walk through the term definitions and math.
Author Generated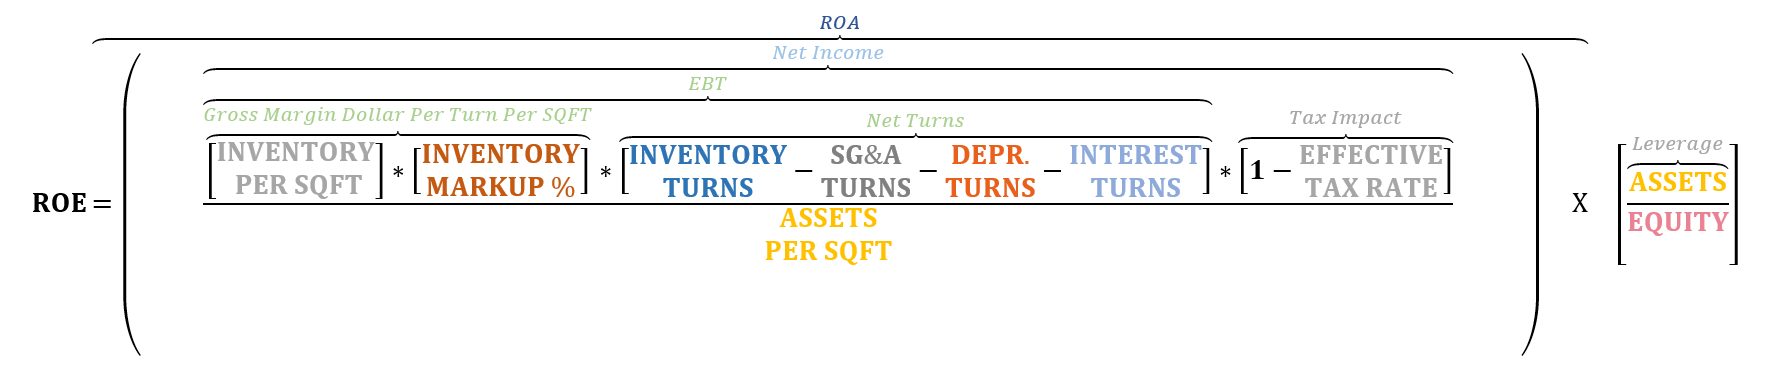
(Click here for full derivation.)
The different colors are designed to match the colors you’ll see in the charts below. All figures are calculated on a square-foot basis to allow for an apples-to-apples comparisons across time and between other companies.
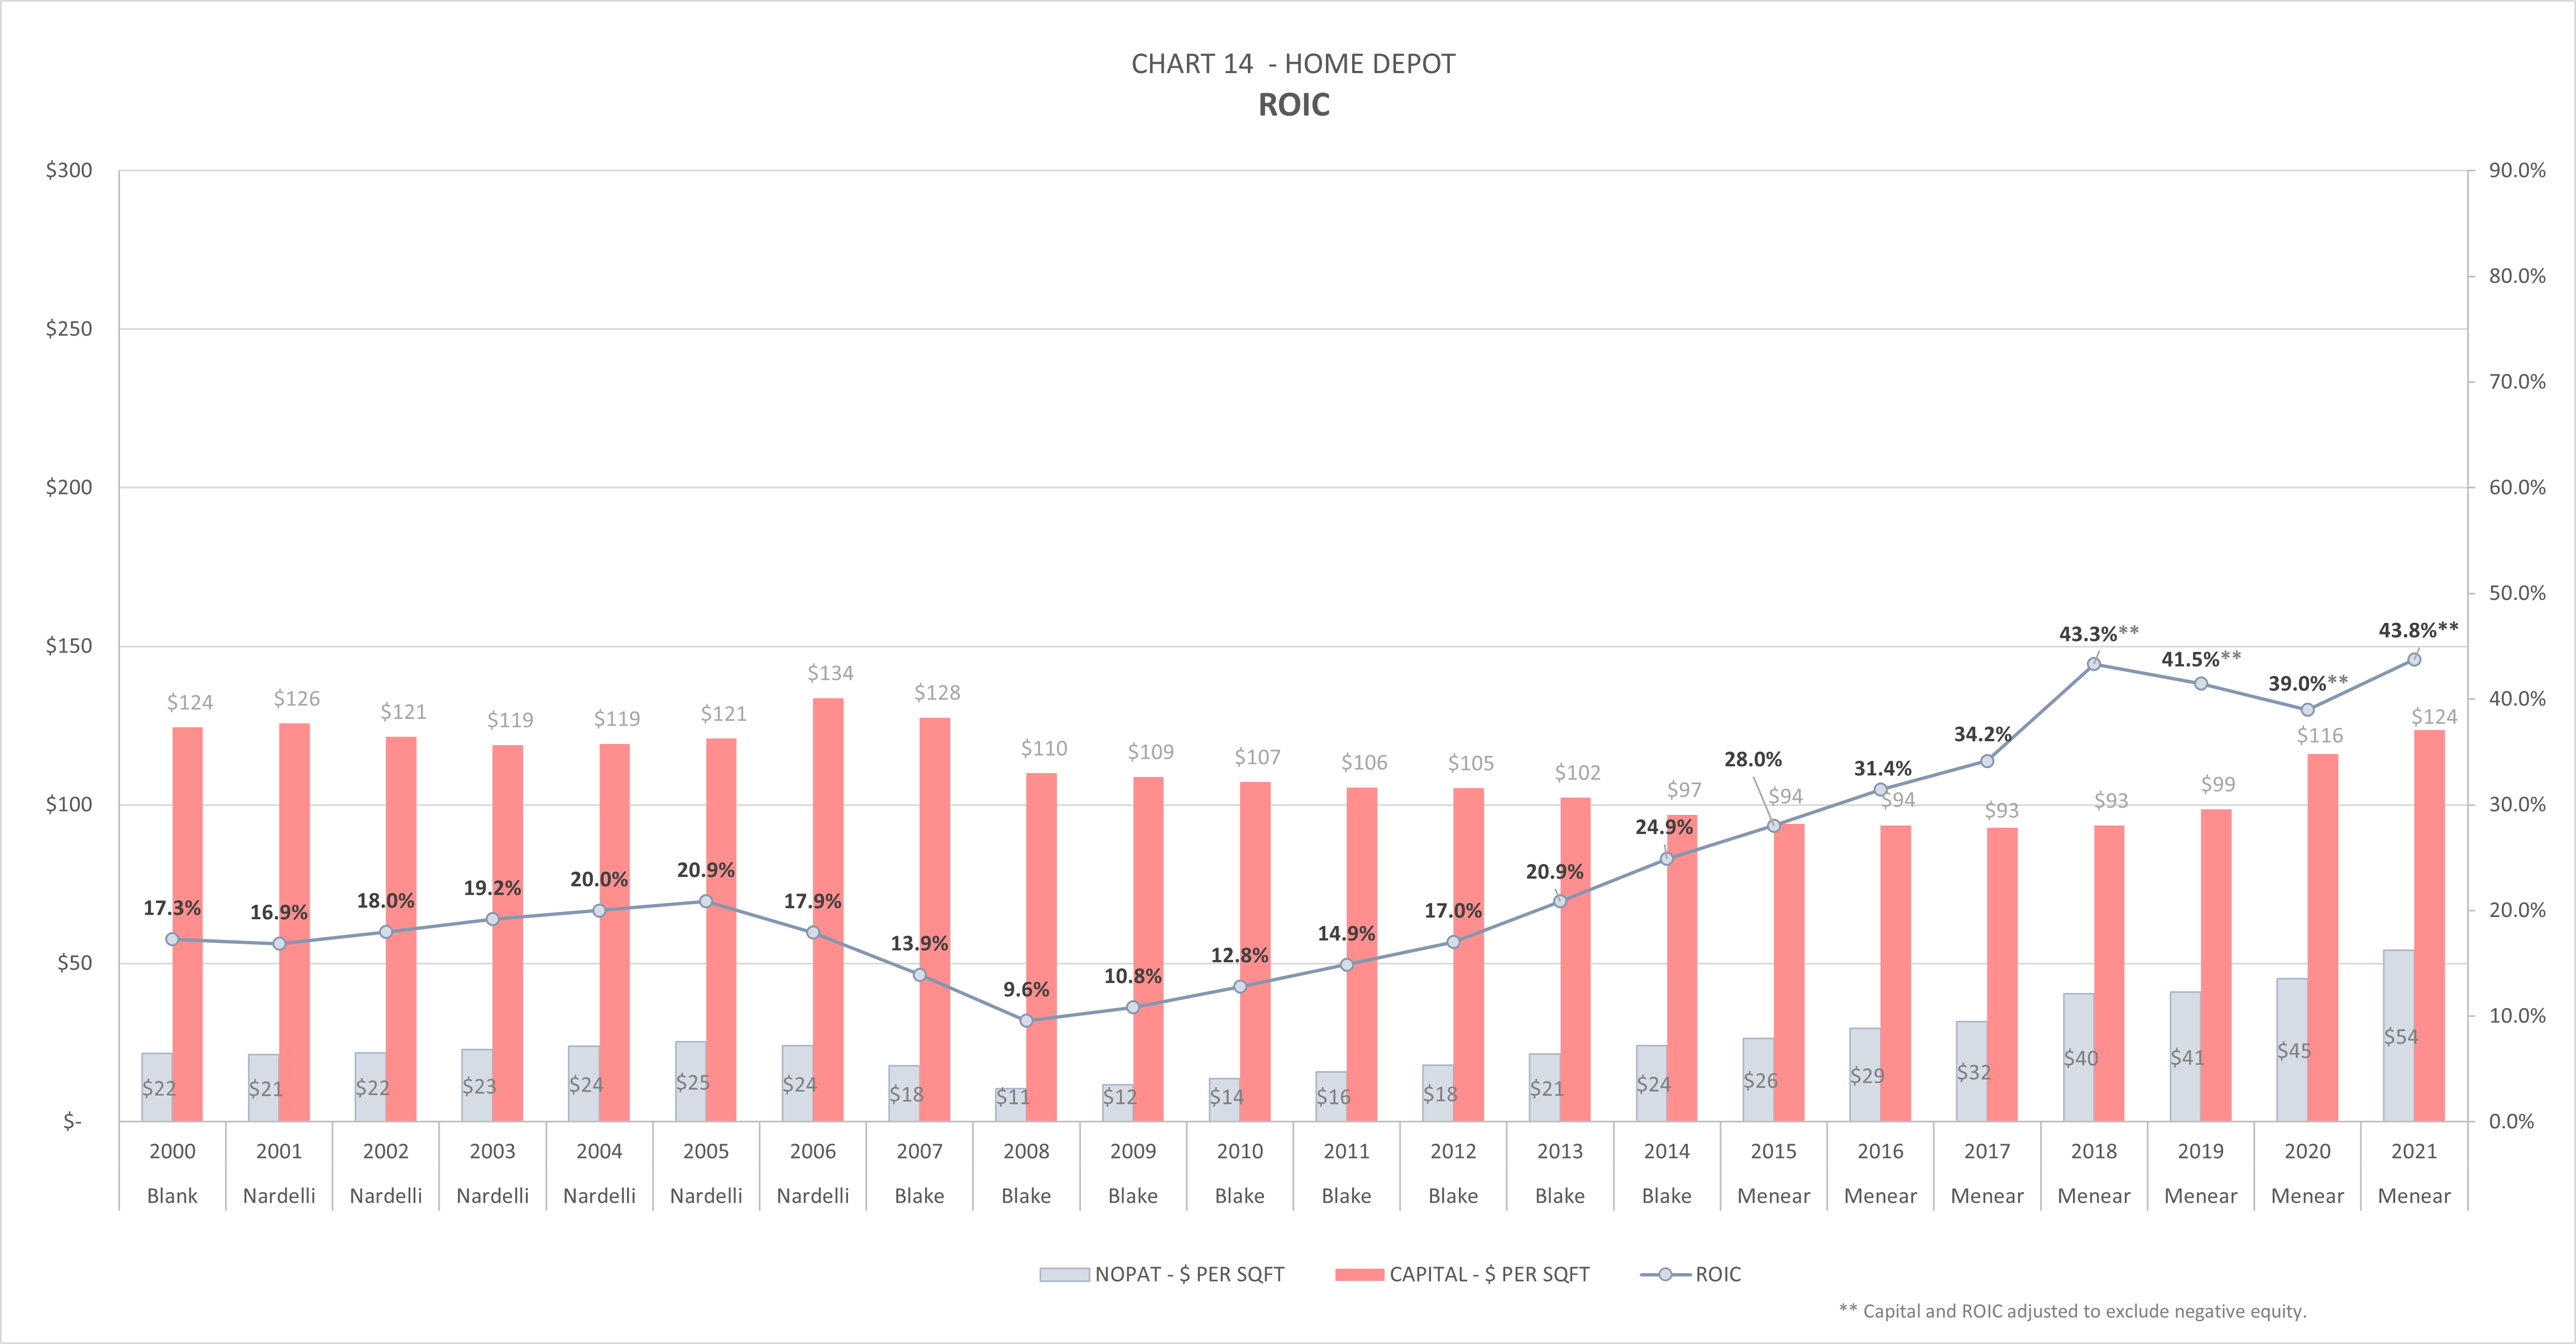
Since Home Depot’s equity position has been low or negative in recent years, ROE calculations will yield nonsensical results. We work around this by ignoring the leverage factor and focusing exclusively on return on assets (ROA). Adjustments to company assets will be needed to offset distortions from aging PP&E, and are found in the notes.
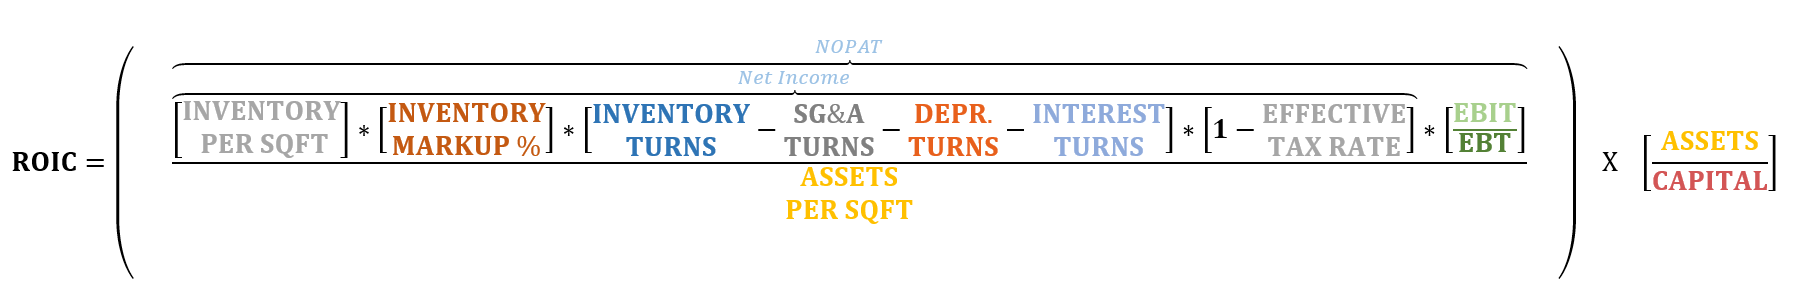
A second workaround for low or negative equity companies is to use return on invested-capital (ROIC). It’s similar to ROA, but measures earnings performance from the liabilities’ side of the balance sheet. It’s also a primary focus of Home Depot executives as the metric is tied directly to their executive compensation packages.
To find ROIC, two multipliers are used to add back after-tax income and swap Assets for Capital:

Yielding:
The order of the charts below will roughly follow the governing equations from left to right. All data is presented first, saving the qualitative discussion around CEO performance to the end.
Products
Author Generated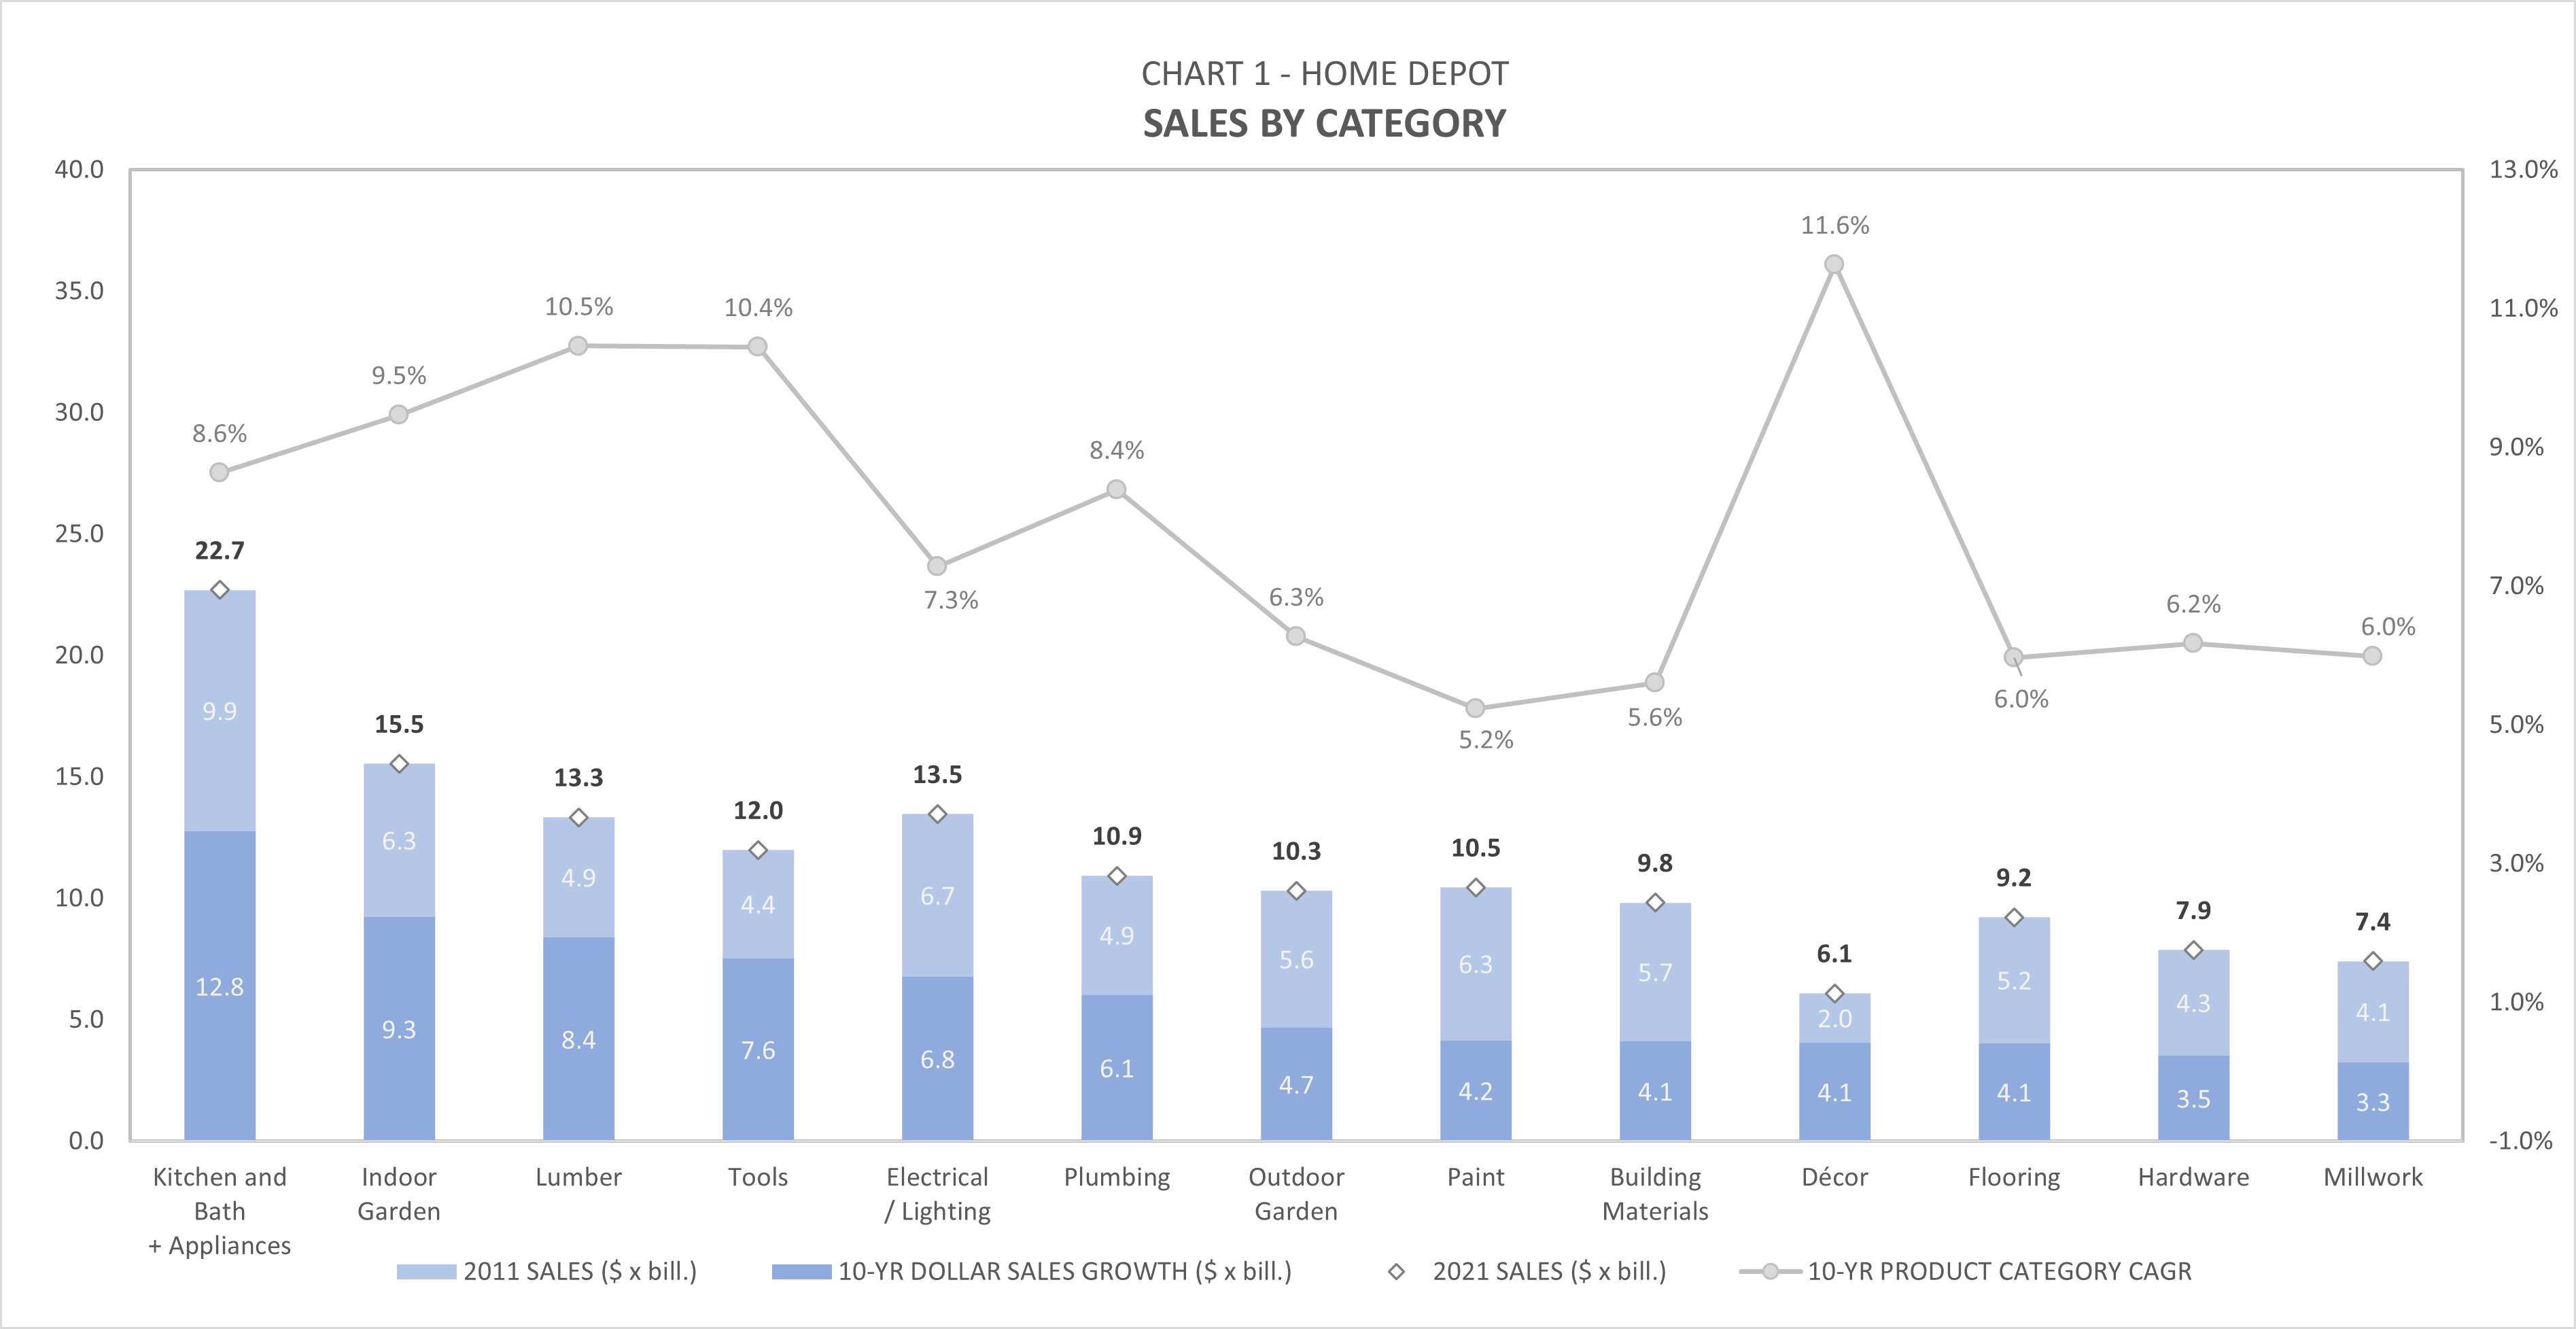
Chart 1 shows The Home Depot FY 2021 sales by product category. Categories are ordered by dollar growth over the past 10 years. The CAGR rate is also shown, as 10-year dollar growth is a function of both starting (2011) sales and category CAGR. The company’s largest dollar growth in the past decade has come from appliances, indoor garden, lumber, and tools. Décor is a smaller portion of sales at the moment, but has the potential to become a larger piece of future business given its high growth rate.
Square Footage
Author Generated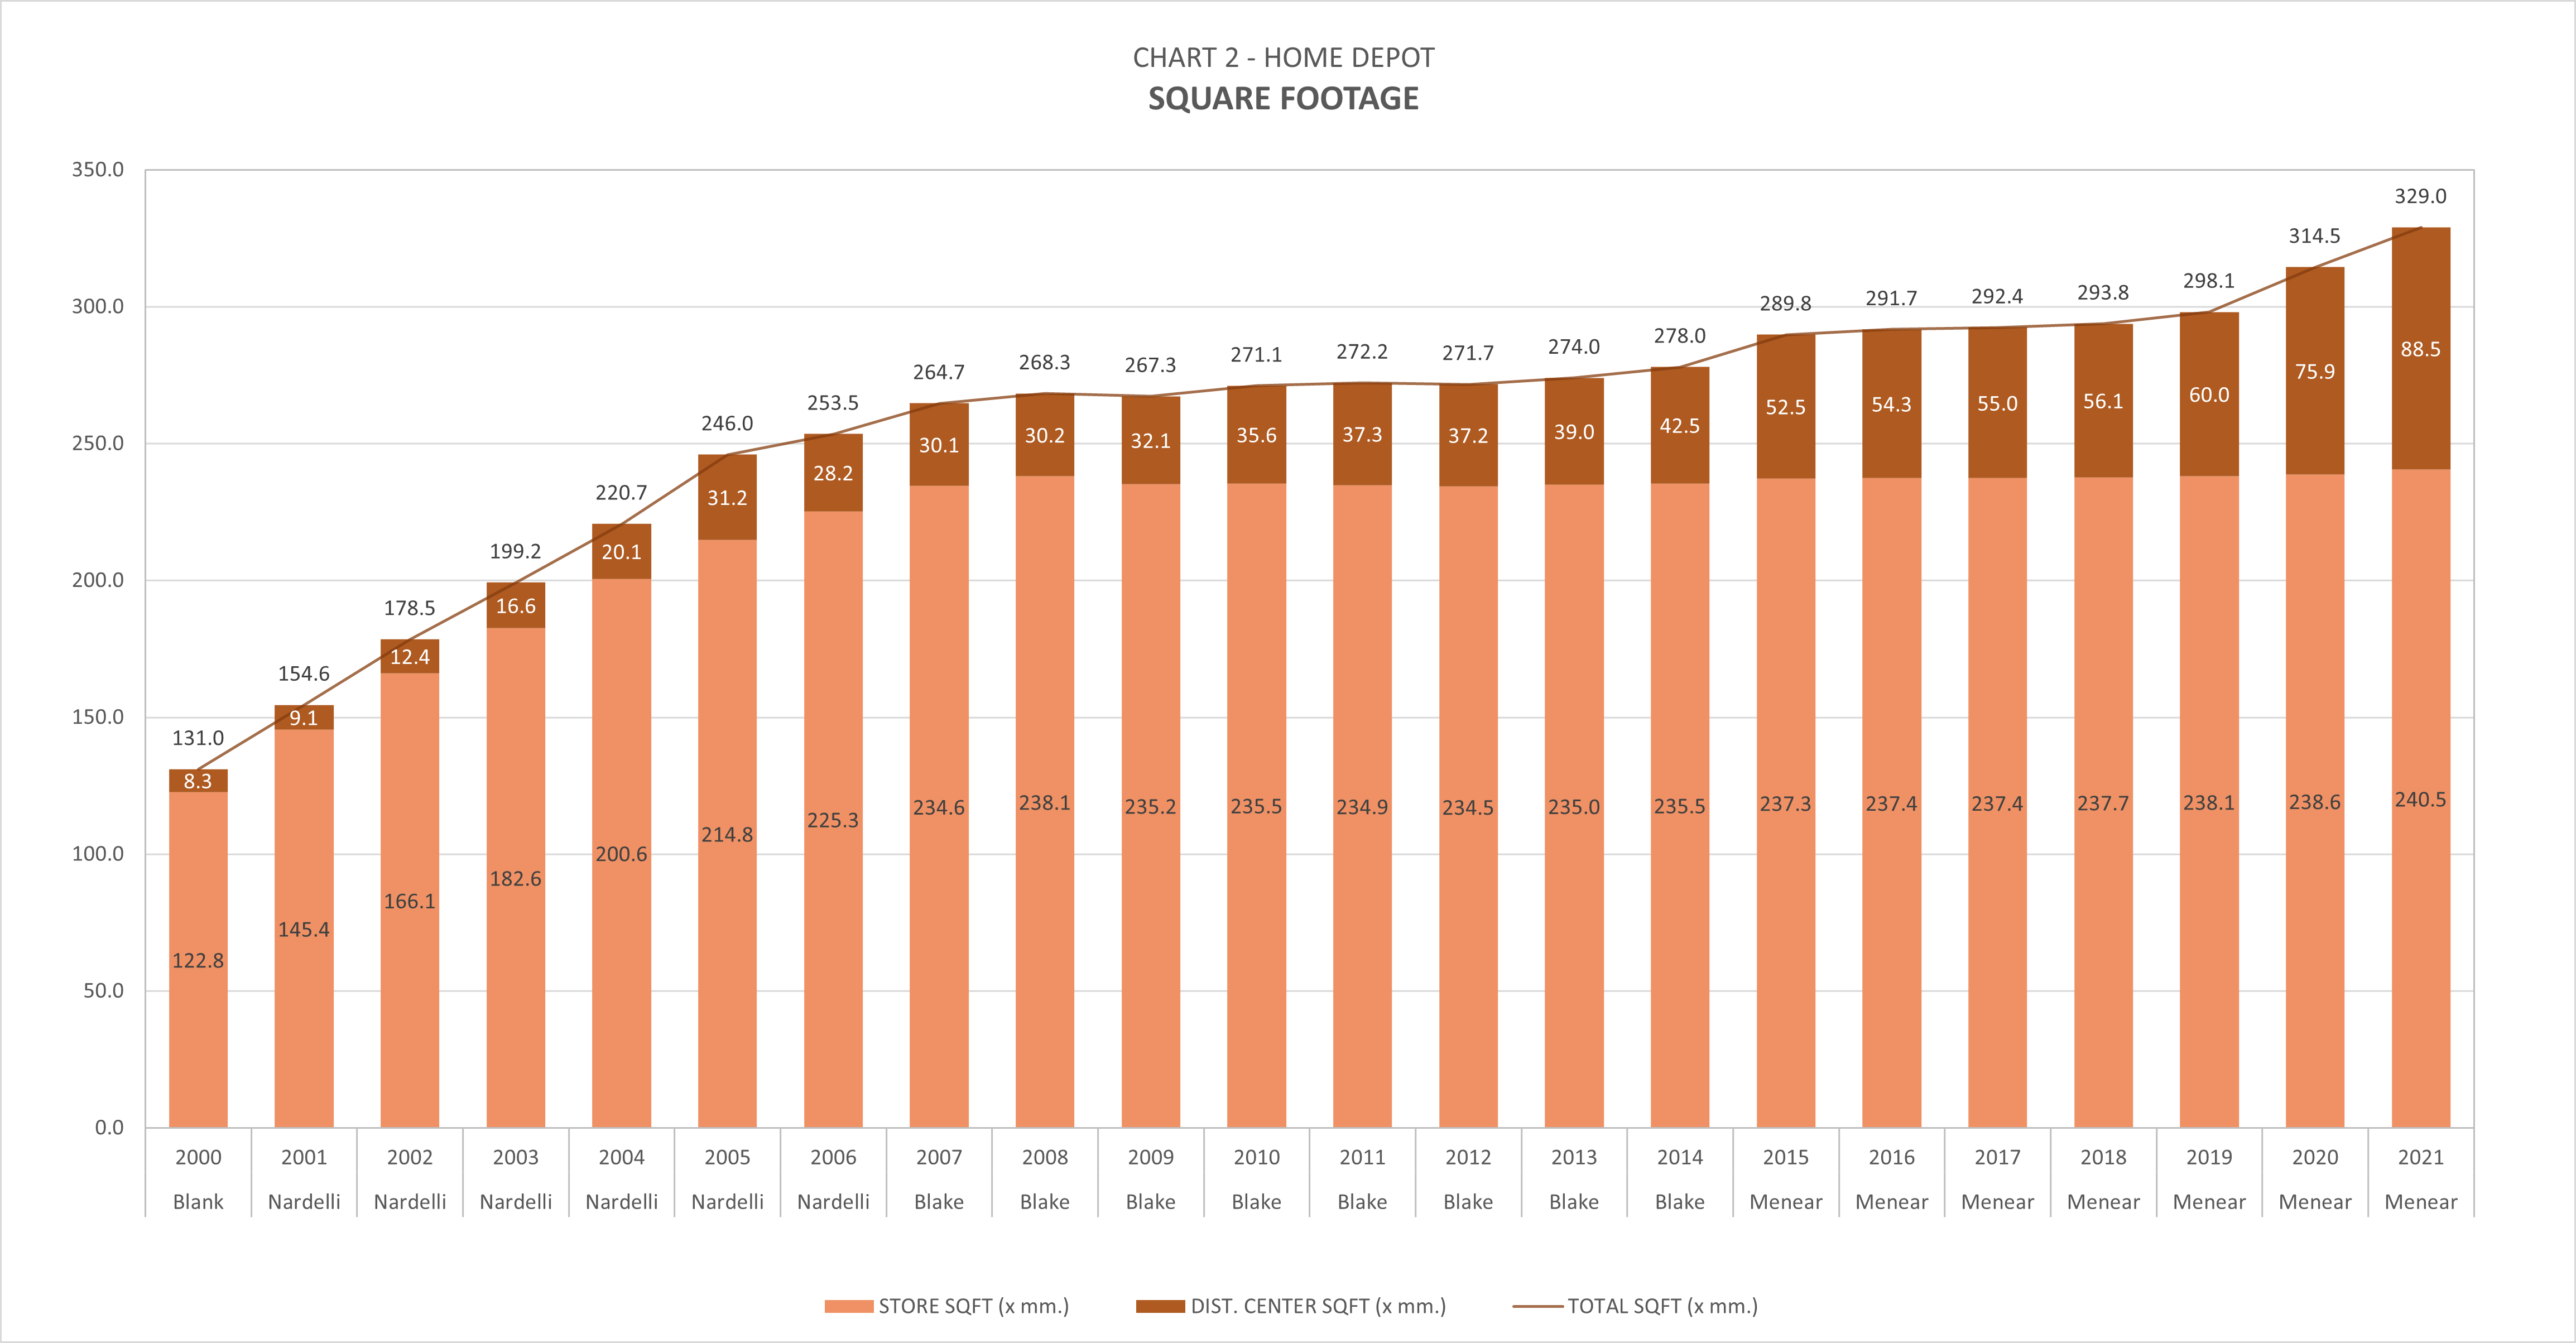
As of Jan. 30, 2022, The Home Depot operated 2,317 retail stores in the U.S., Canada and Mexico, with an average enclosed store footprint of about 104,000 sqft/store. Chart 2 shows that retail square footage has grown very little since 2007, but distribution center square footage has been growing rapidly in recent years. More on this later.
Gross Margin Dollars Per Turn
Author Generated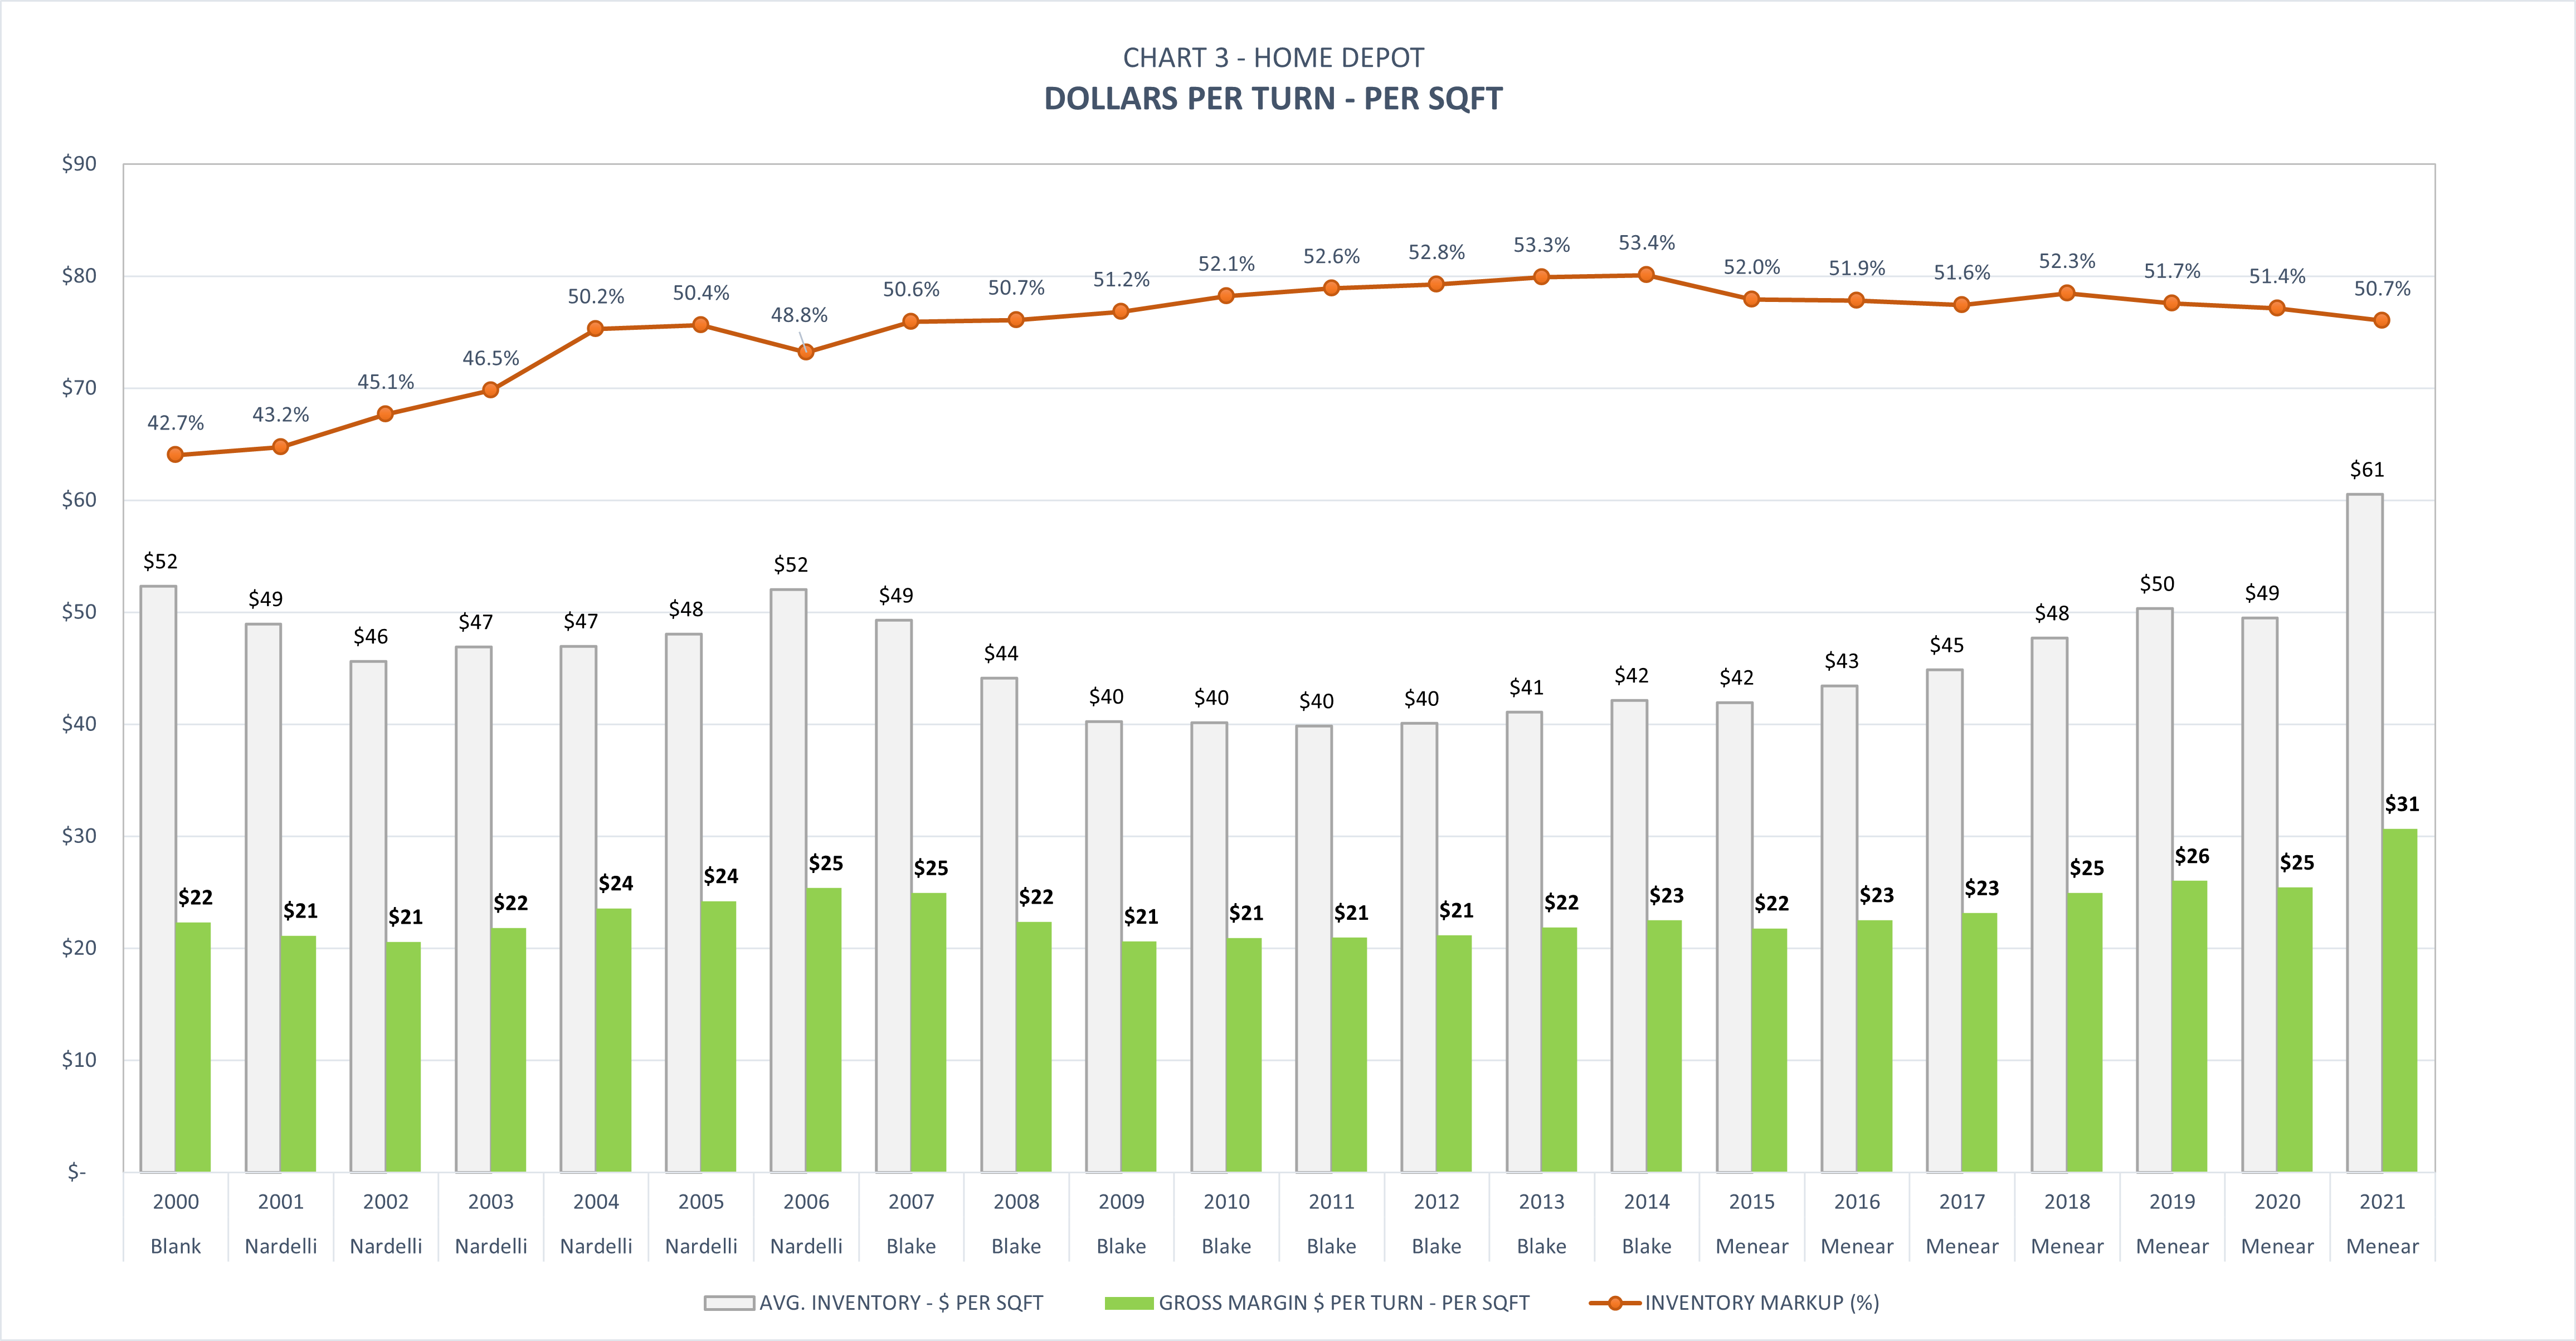
Chart 3 starts with Home Depot’s inventory per-sqft (light gray). Changes in inventory per-square-foot may result from changes in average product cost, product mix, in-stock positions, and/or average inventory density. Like most retailers, HD purchases inventory from vendors, marks it up, turns it, then repeats the process. Each inventory turn generates gross margin dollars (green) that are pooled and used to pay for operating expenses, interest, taxes, etc. The inventory markup rate (orange) is simply the gross margin dollars earned per turn as a percentage of the inventory cost.
Inventory markup rate tends to be discussed less frequently than gross margin rate. You can convert one to the other using the formula below:
Note:
- Total square footage = Average of this year and last year’s retail square footage + DC square footage
- Inventory Turns and Average inventory based on quarterly inventory levels.
Inventory Turns
Author Generated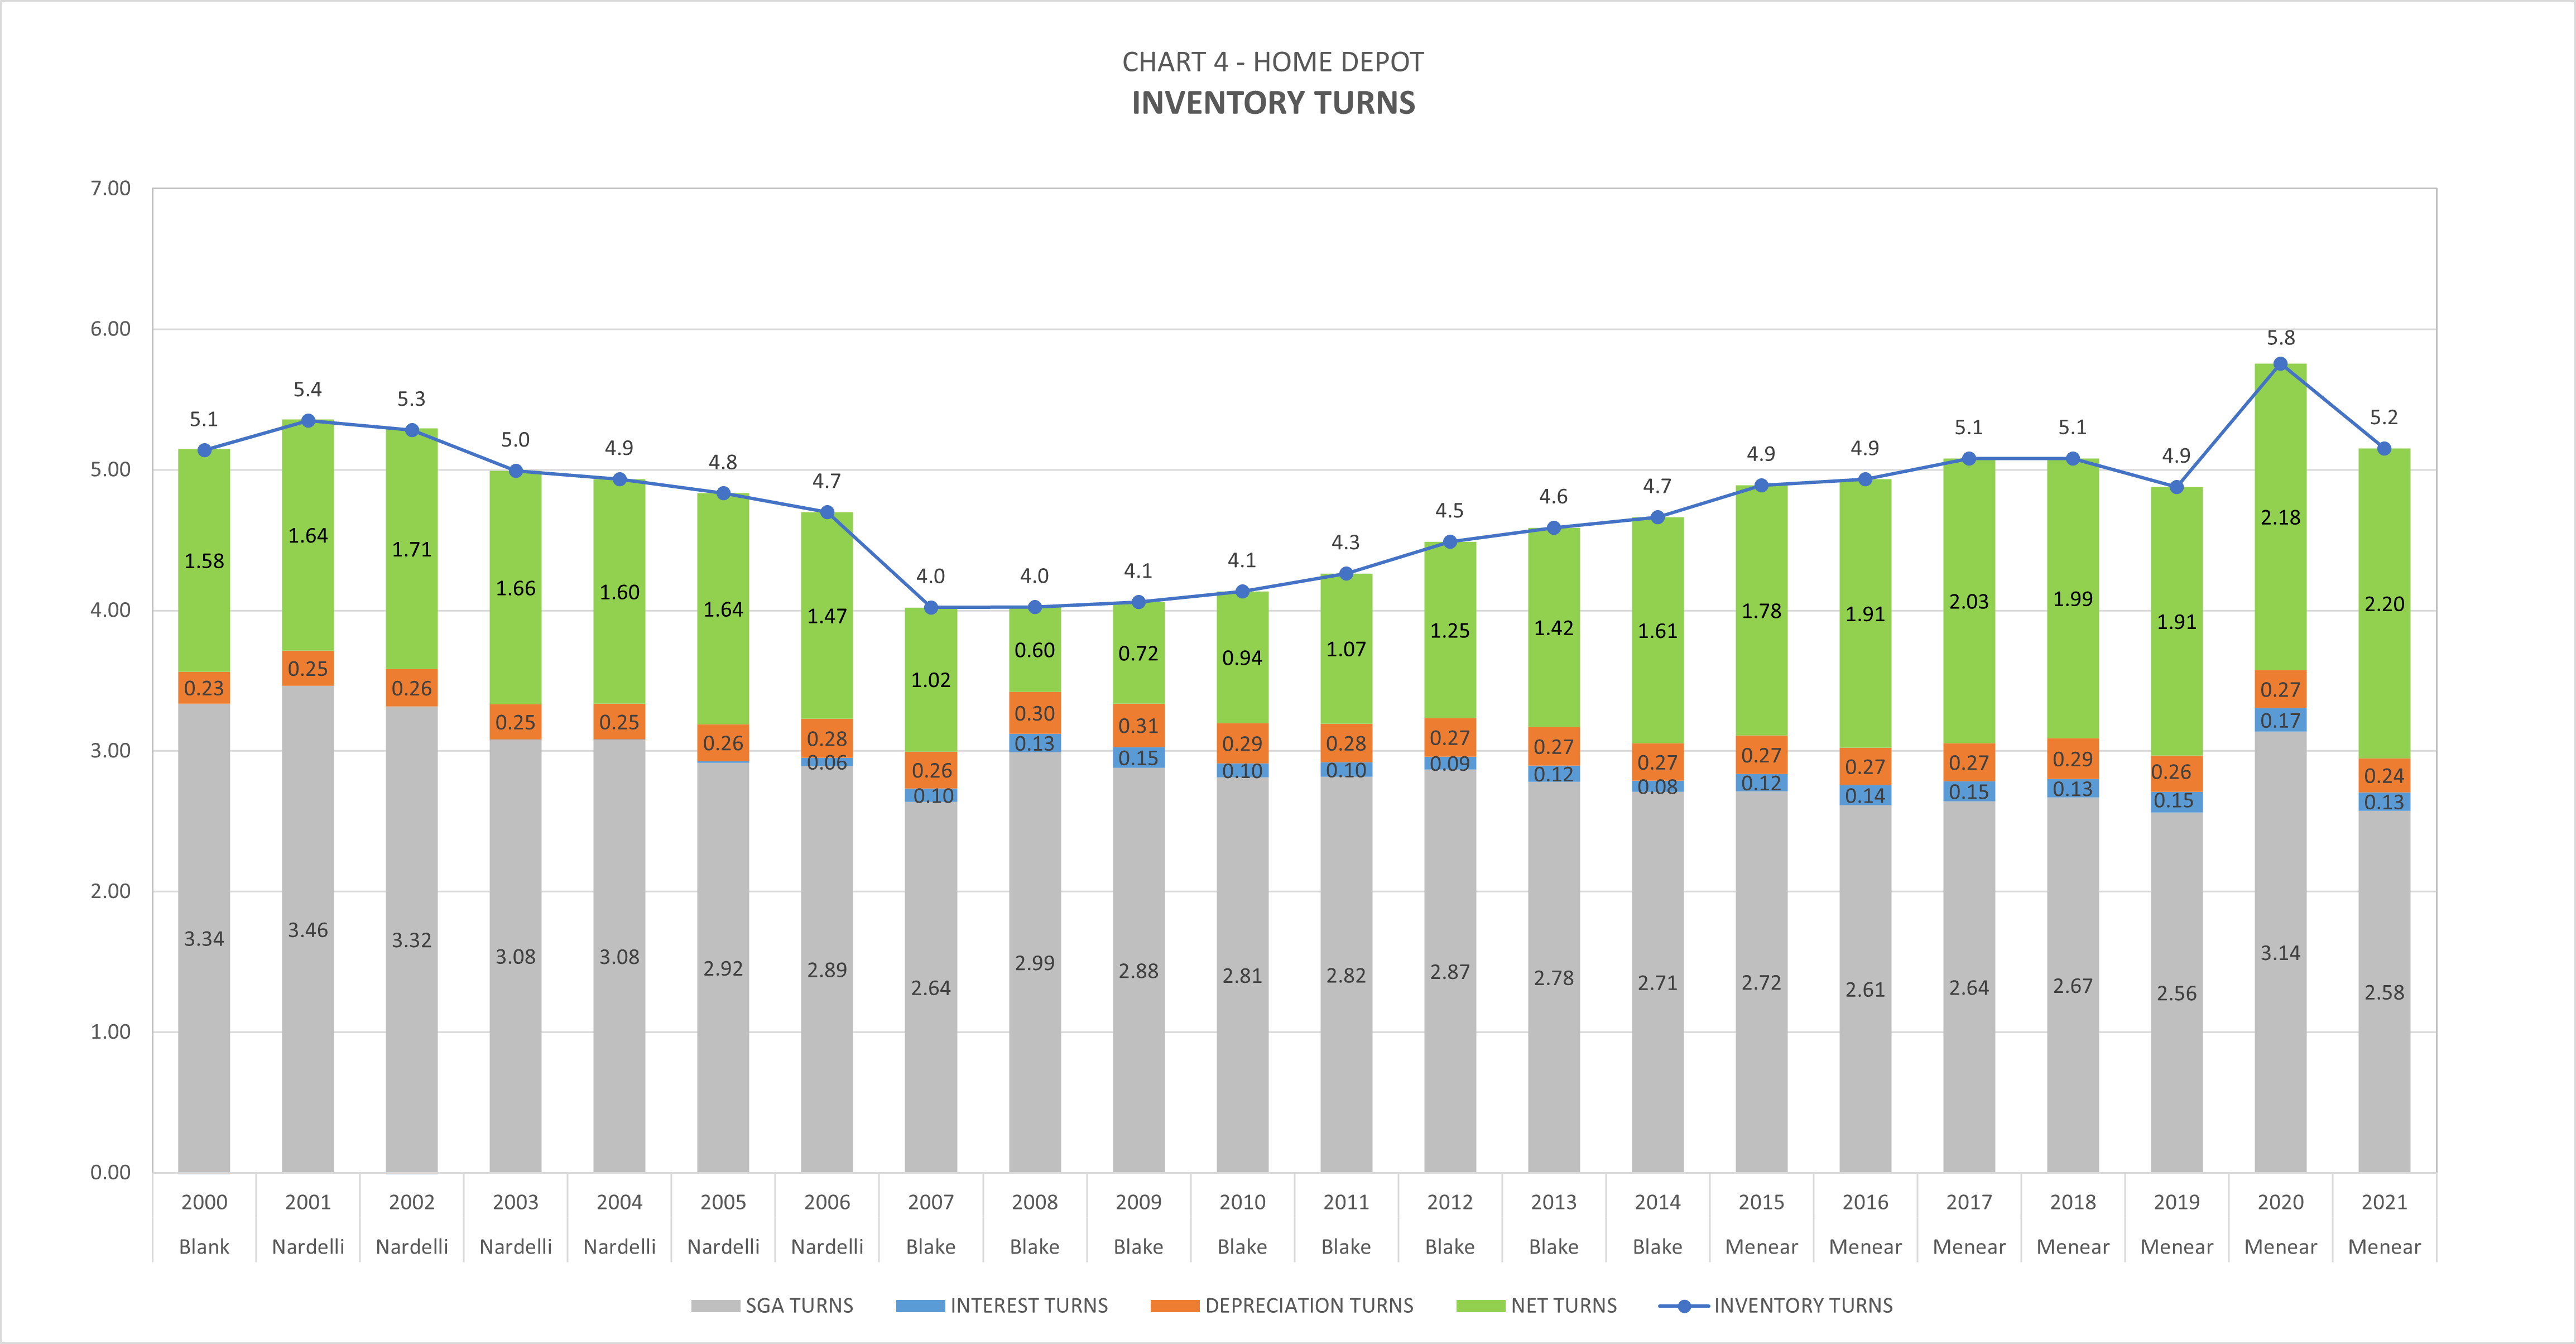
Chart 4 shows HD’s annual inventory turns over time. SG&A Turns (gray), Interest Turns (blue), and Depreciation Turns (orange) are defined as the amount of inventory turns needed to cover each respective expense with gross margin dollars earned in that period. Net Turns (green) are the number of inventory turns remaining that generate earnings for shareholders. In recent years Home Depot has shown higher inventory turns and net turns compared to competitors like Lowe’s (LOW). This is a change from the early and mid 2000s where company turns were neck and neck. Lately, America seems to prefer shopping at HD over Lowe’s.
Note: A quick estimation of the company’s degree of operating leverage (DOL) can be found by dividing Total Turns by Net Turns (this assumes all expenses to be fixed). Companies like Lowe’s have had lower Net Turns in recent years, giving them the ability to grow EPS at a faster rate than Home Depot due simply to higher operating leverage. That said, a faster EPS growth rate is not necessary a sign of company health. The cost cutting measures Marvin Ellison has made at Lowe’s has boosted their EPS rapidly since 2018, but the plan hasn’t done much for the company’s inventory turns and market share. See the discussion below on Bob Nardelli to understand the risks associated with the kind of strategy Ellison is attempting. Stay tuned for a future side-by-side between the two companies.
Gross Margin Dollars
Gross Margin Dollars are simply the product of Gross Margin Dollars-Per-Turn (Chart 3 – green) and all components of Inventory Turns (Chart 4).
Author Generated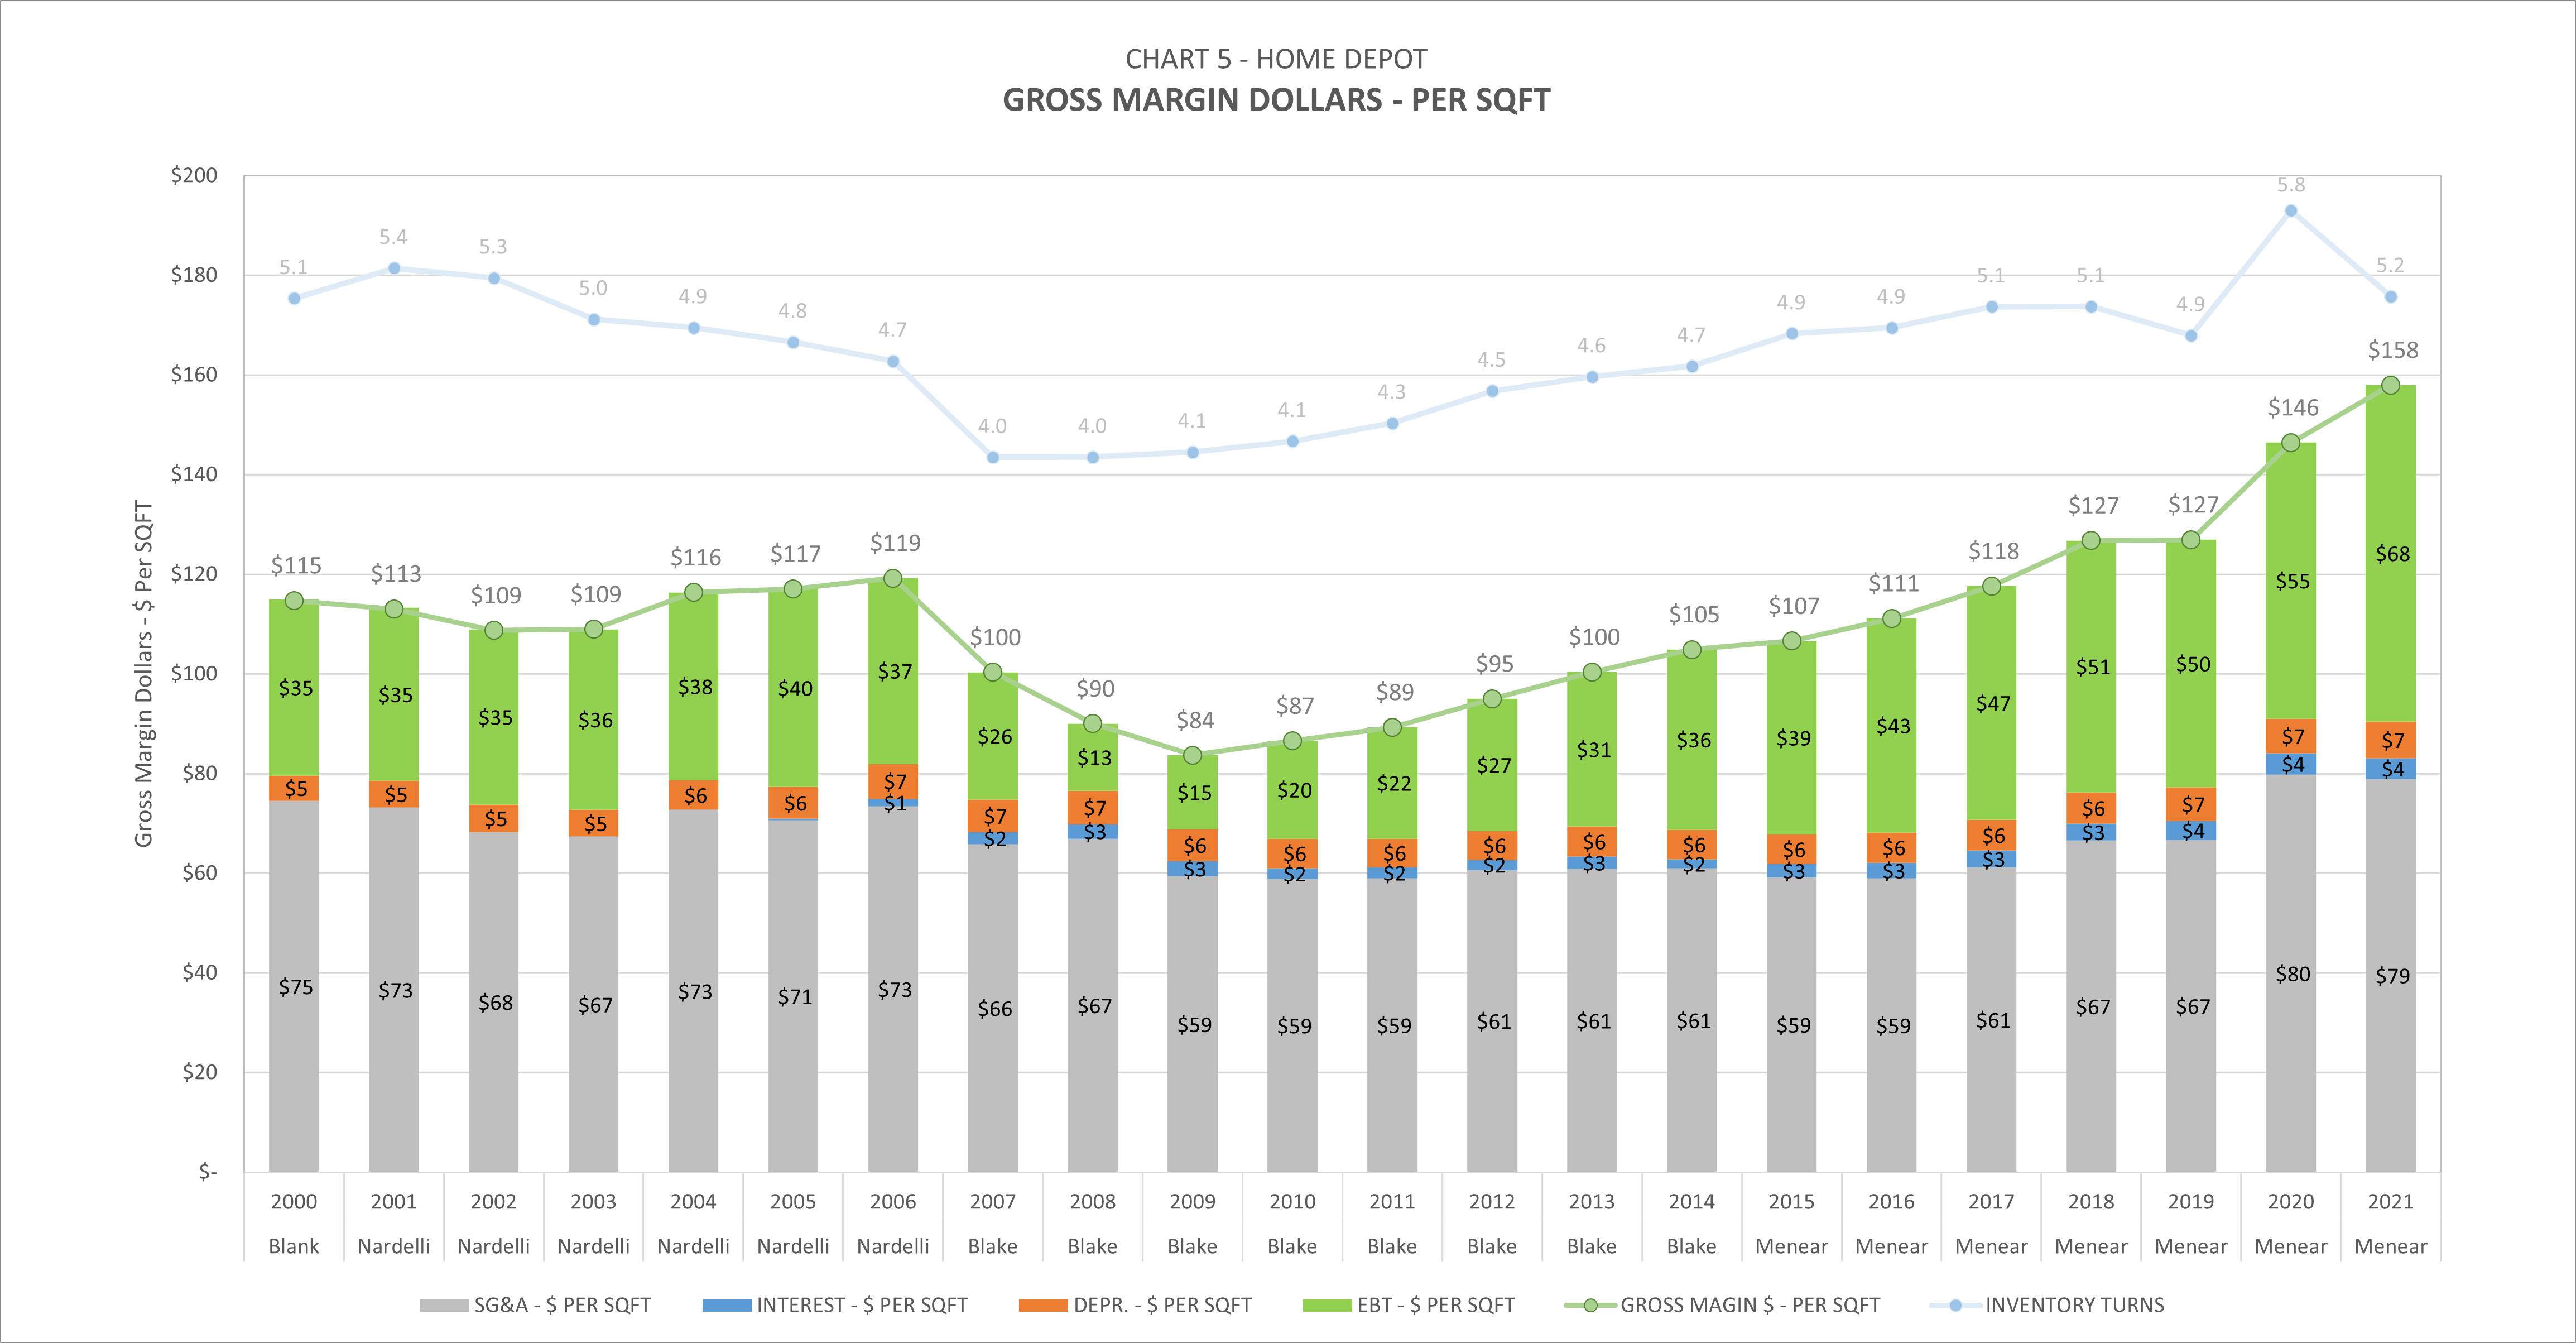
Pre-tax income (EBT) shown in green above is found by multiplying Gross Margin Dollars-Per-Turn by Net Turns (Chart 4 – green). We take a closer look at EBT and Net Income below.
Pre-Tax Income
Chart 6 simply isolates EBT shown in Chart 5 above. These earnings will go on to be taxed at the company’s effective tax rate.
Author Generated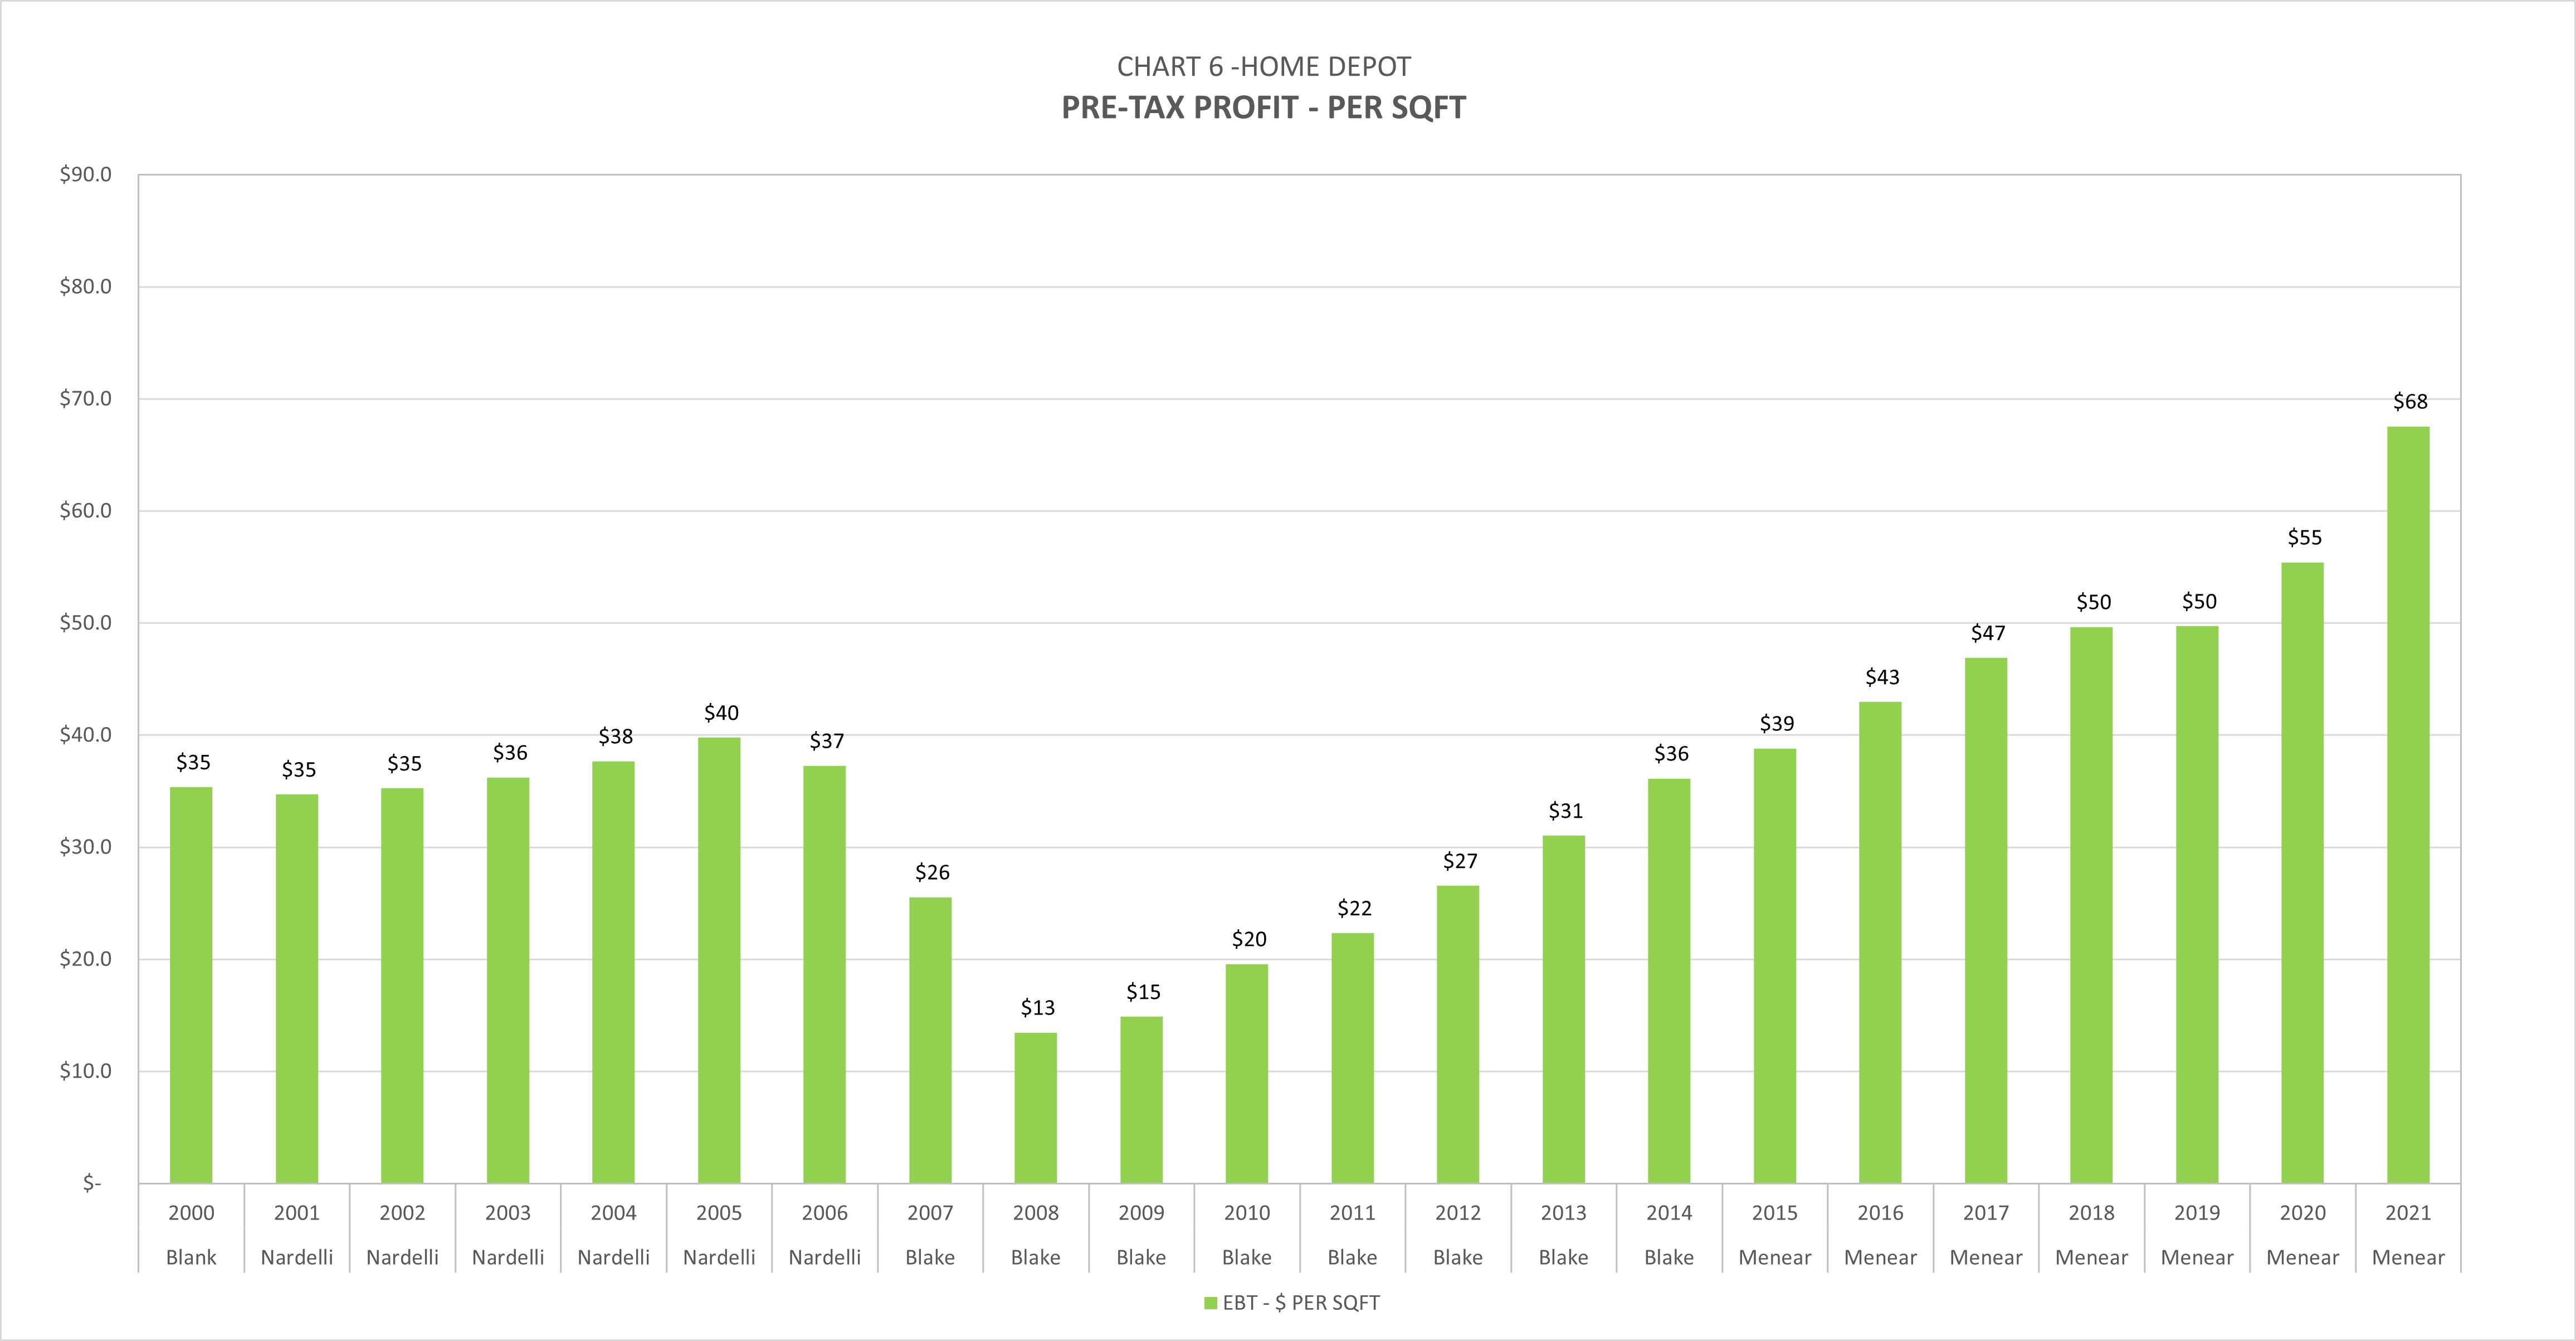
Net Income
Net Income is found by multiplying Chart 6 above by (1-Effective Tax Rate).
Author Generated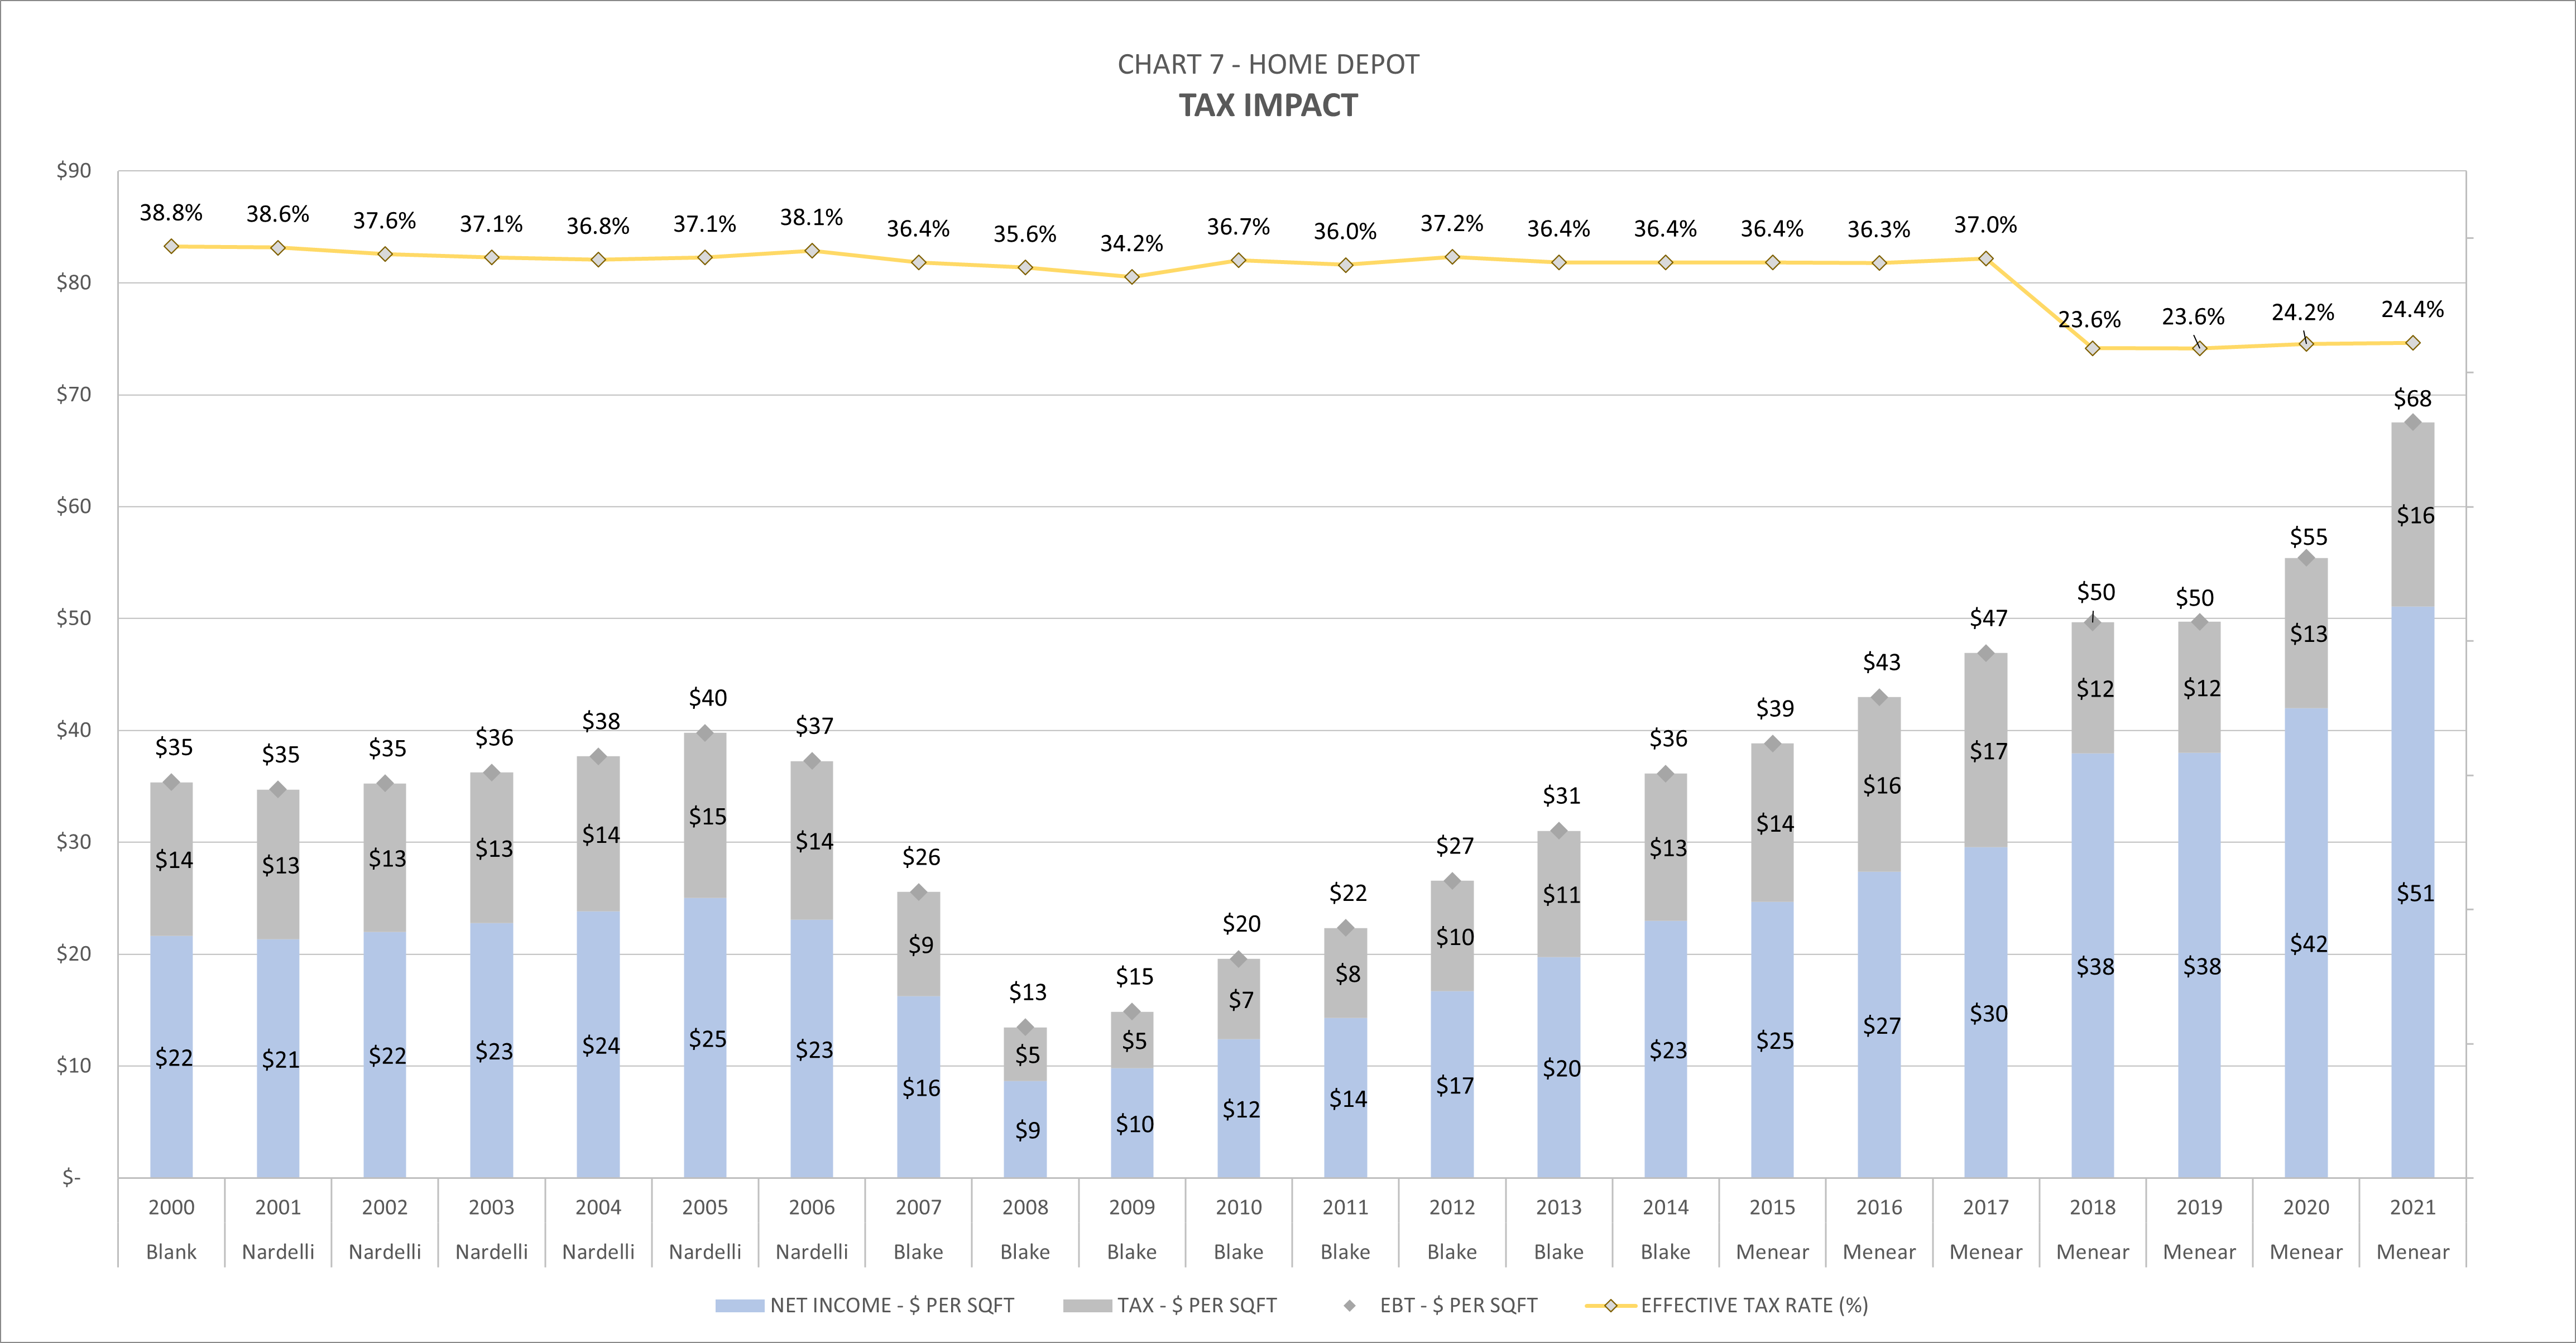
For example, in 2021 each square foot of HD operated with $61 of inventory, yielding $31 of gross margin dollars per turn resulting from a 50.7% markup. That year, inventory was turned 5.2 times. 2.58 of those turns covered SG&A costs, 0.24 turns covered depreciation, and 0.13 turns covered interest, leaving 2.20 turns x $31 = $68 of per-tax earnings. 24.4% of that $68 was paid to the U.S. government, leaving $51 per square foot available to shareholders.
Earnings Per Share
We can get from earnings per square foot to EPS by using the conversion factor shown in Chart 8 below. In effect, the square foot/share factor shows the fraction of 1 square foot that a single share of common stock can buy you. If the company either adds square footage or repurchases shares, it will have a positive effect on this value. Over the past 20 years HD has done both, with repurchases accelerating as square footage growth has slowed. Since 2002, the company has more than doubled its footprint (including distribution centers) and repurchased more than 50% of shares outstanding. In 2000, you’d have to buy about 20 shares of stock to own 1 square foot of Home Depot. Today it takes just over 3.
Author Generated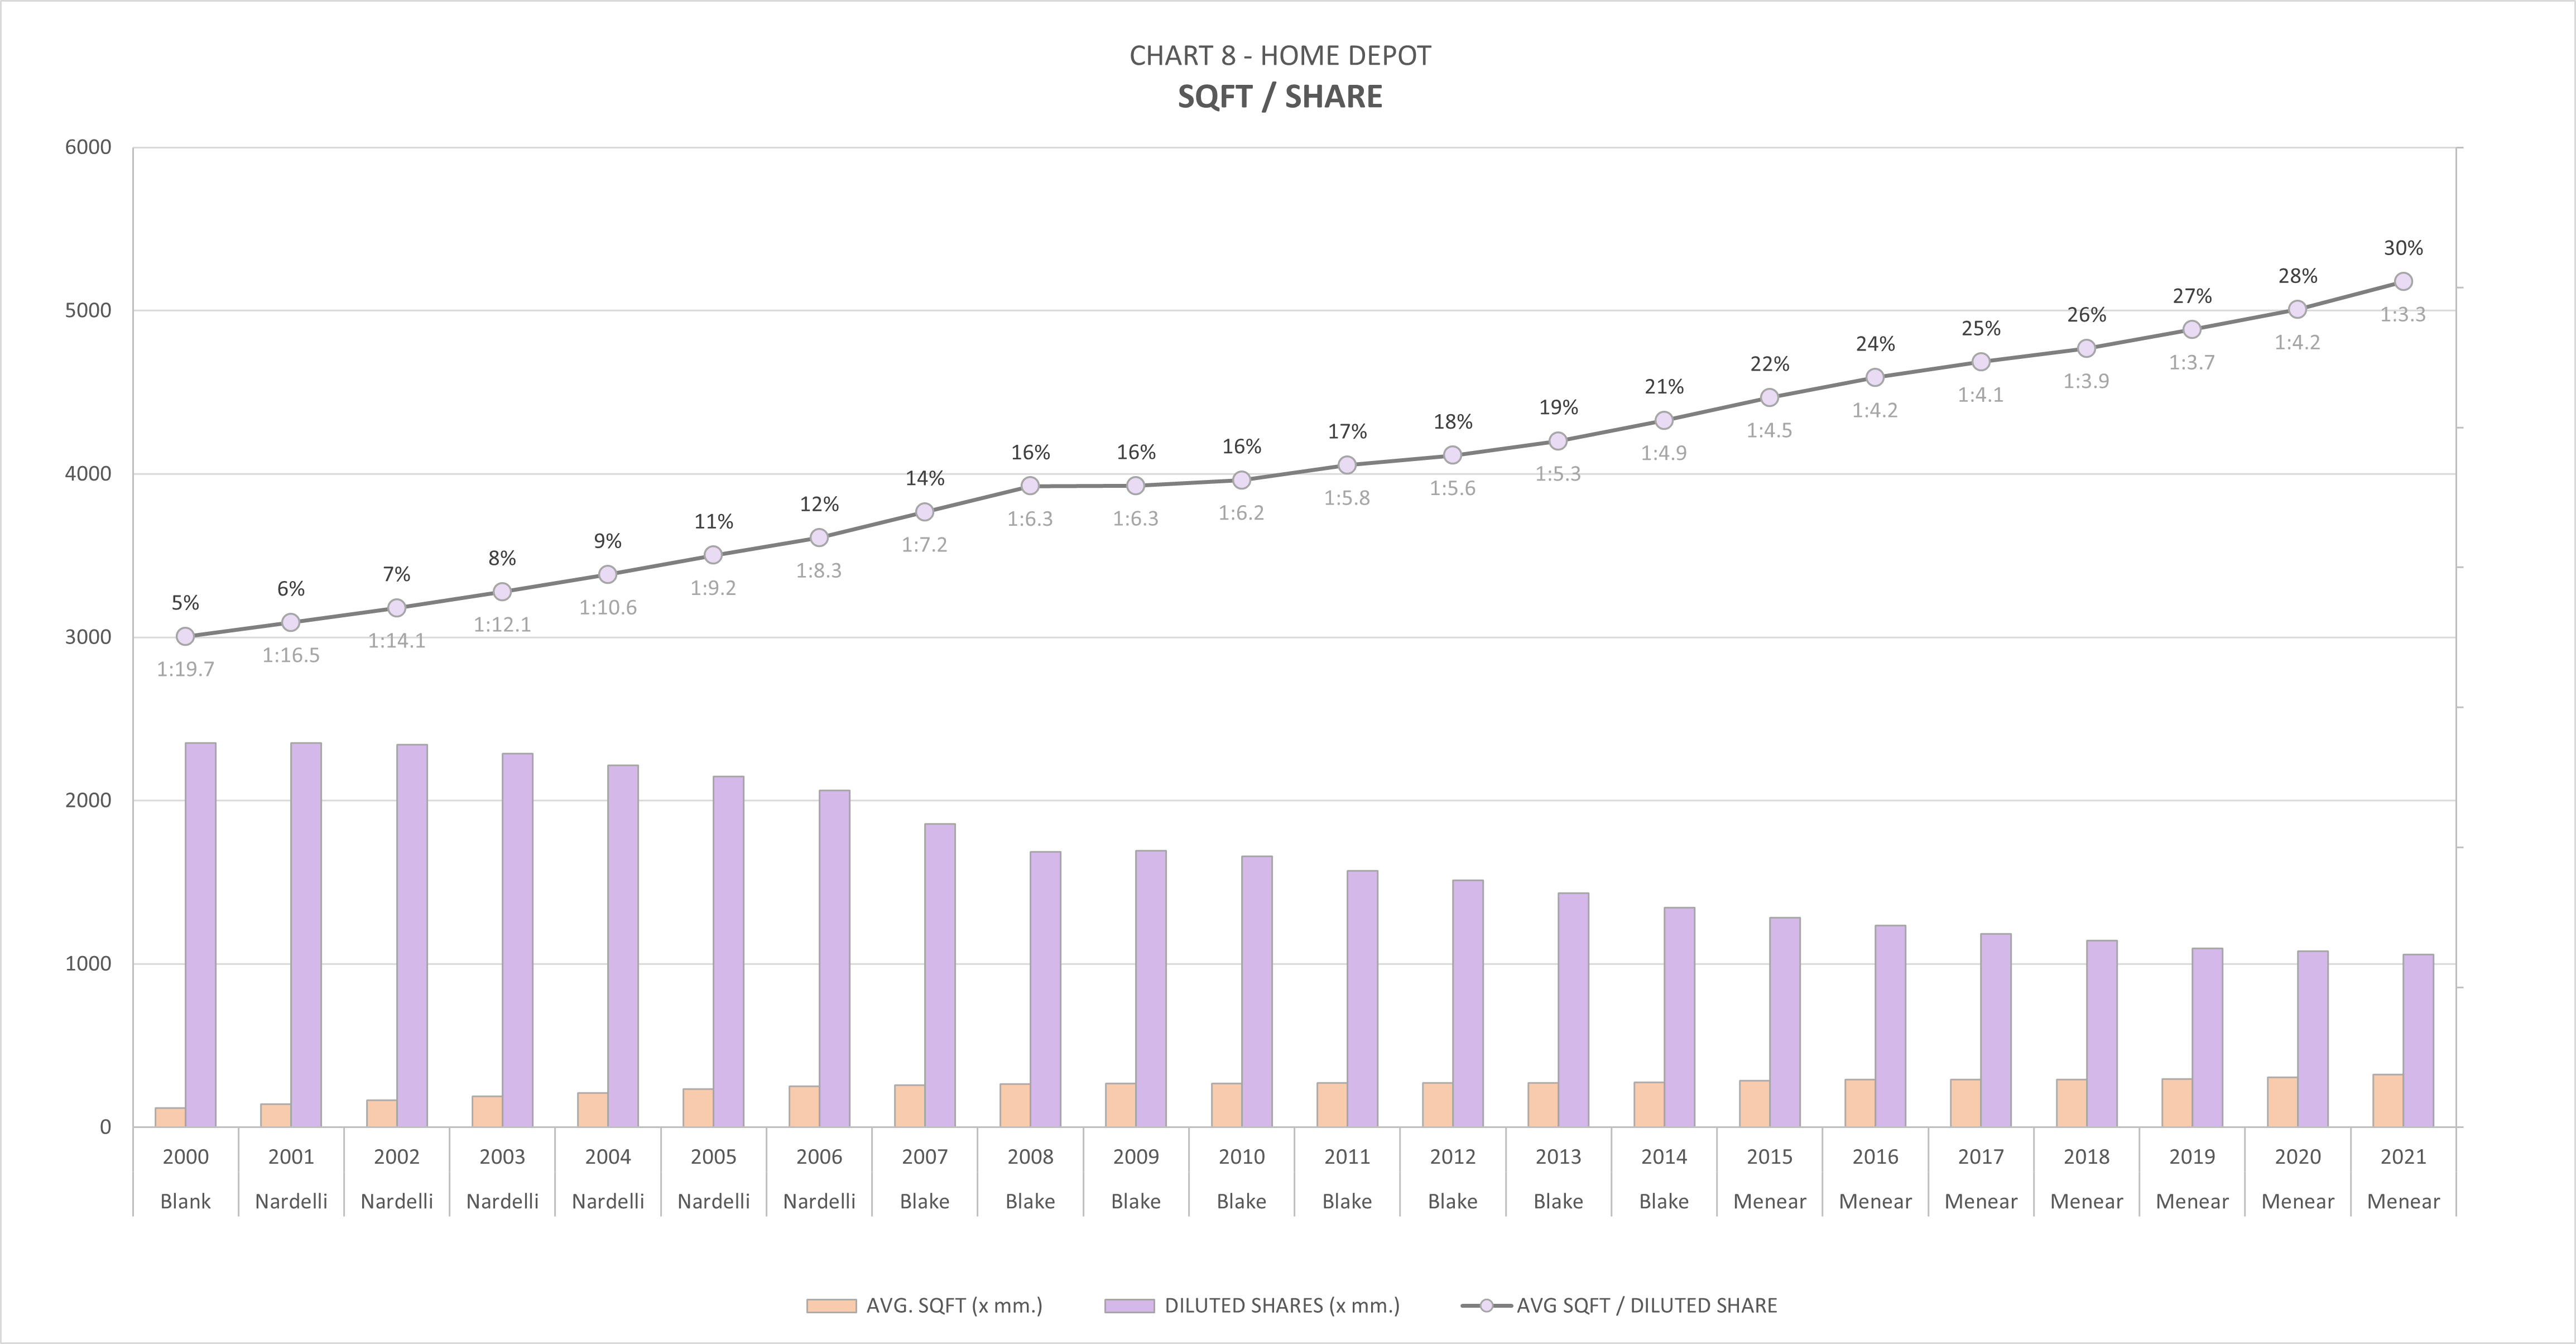
By multiplying Net Income per-sqft (Chart 7 – light blue) by the SQFT/Share factor (Chart 8), you find EPS…
Author Generated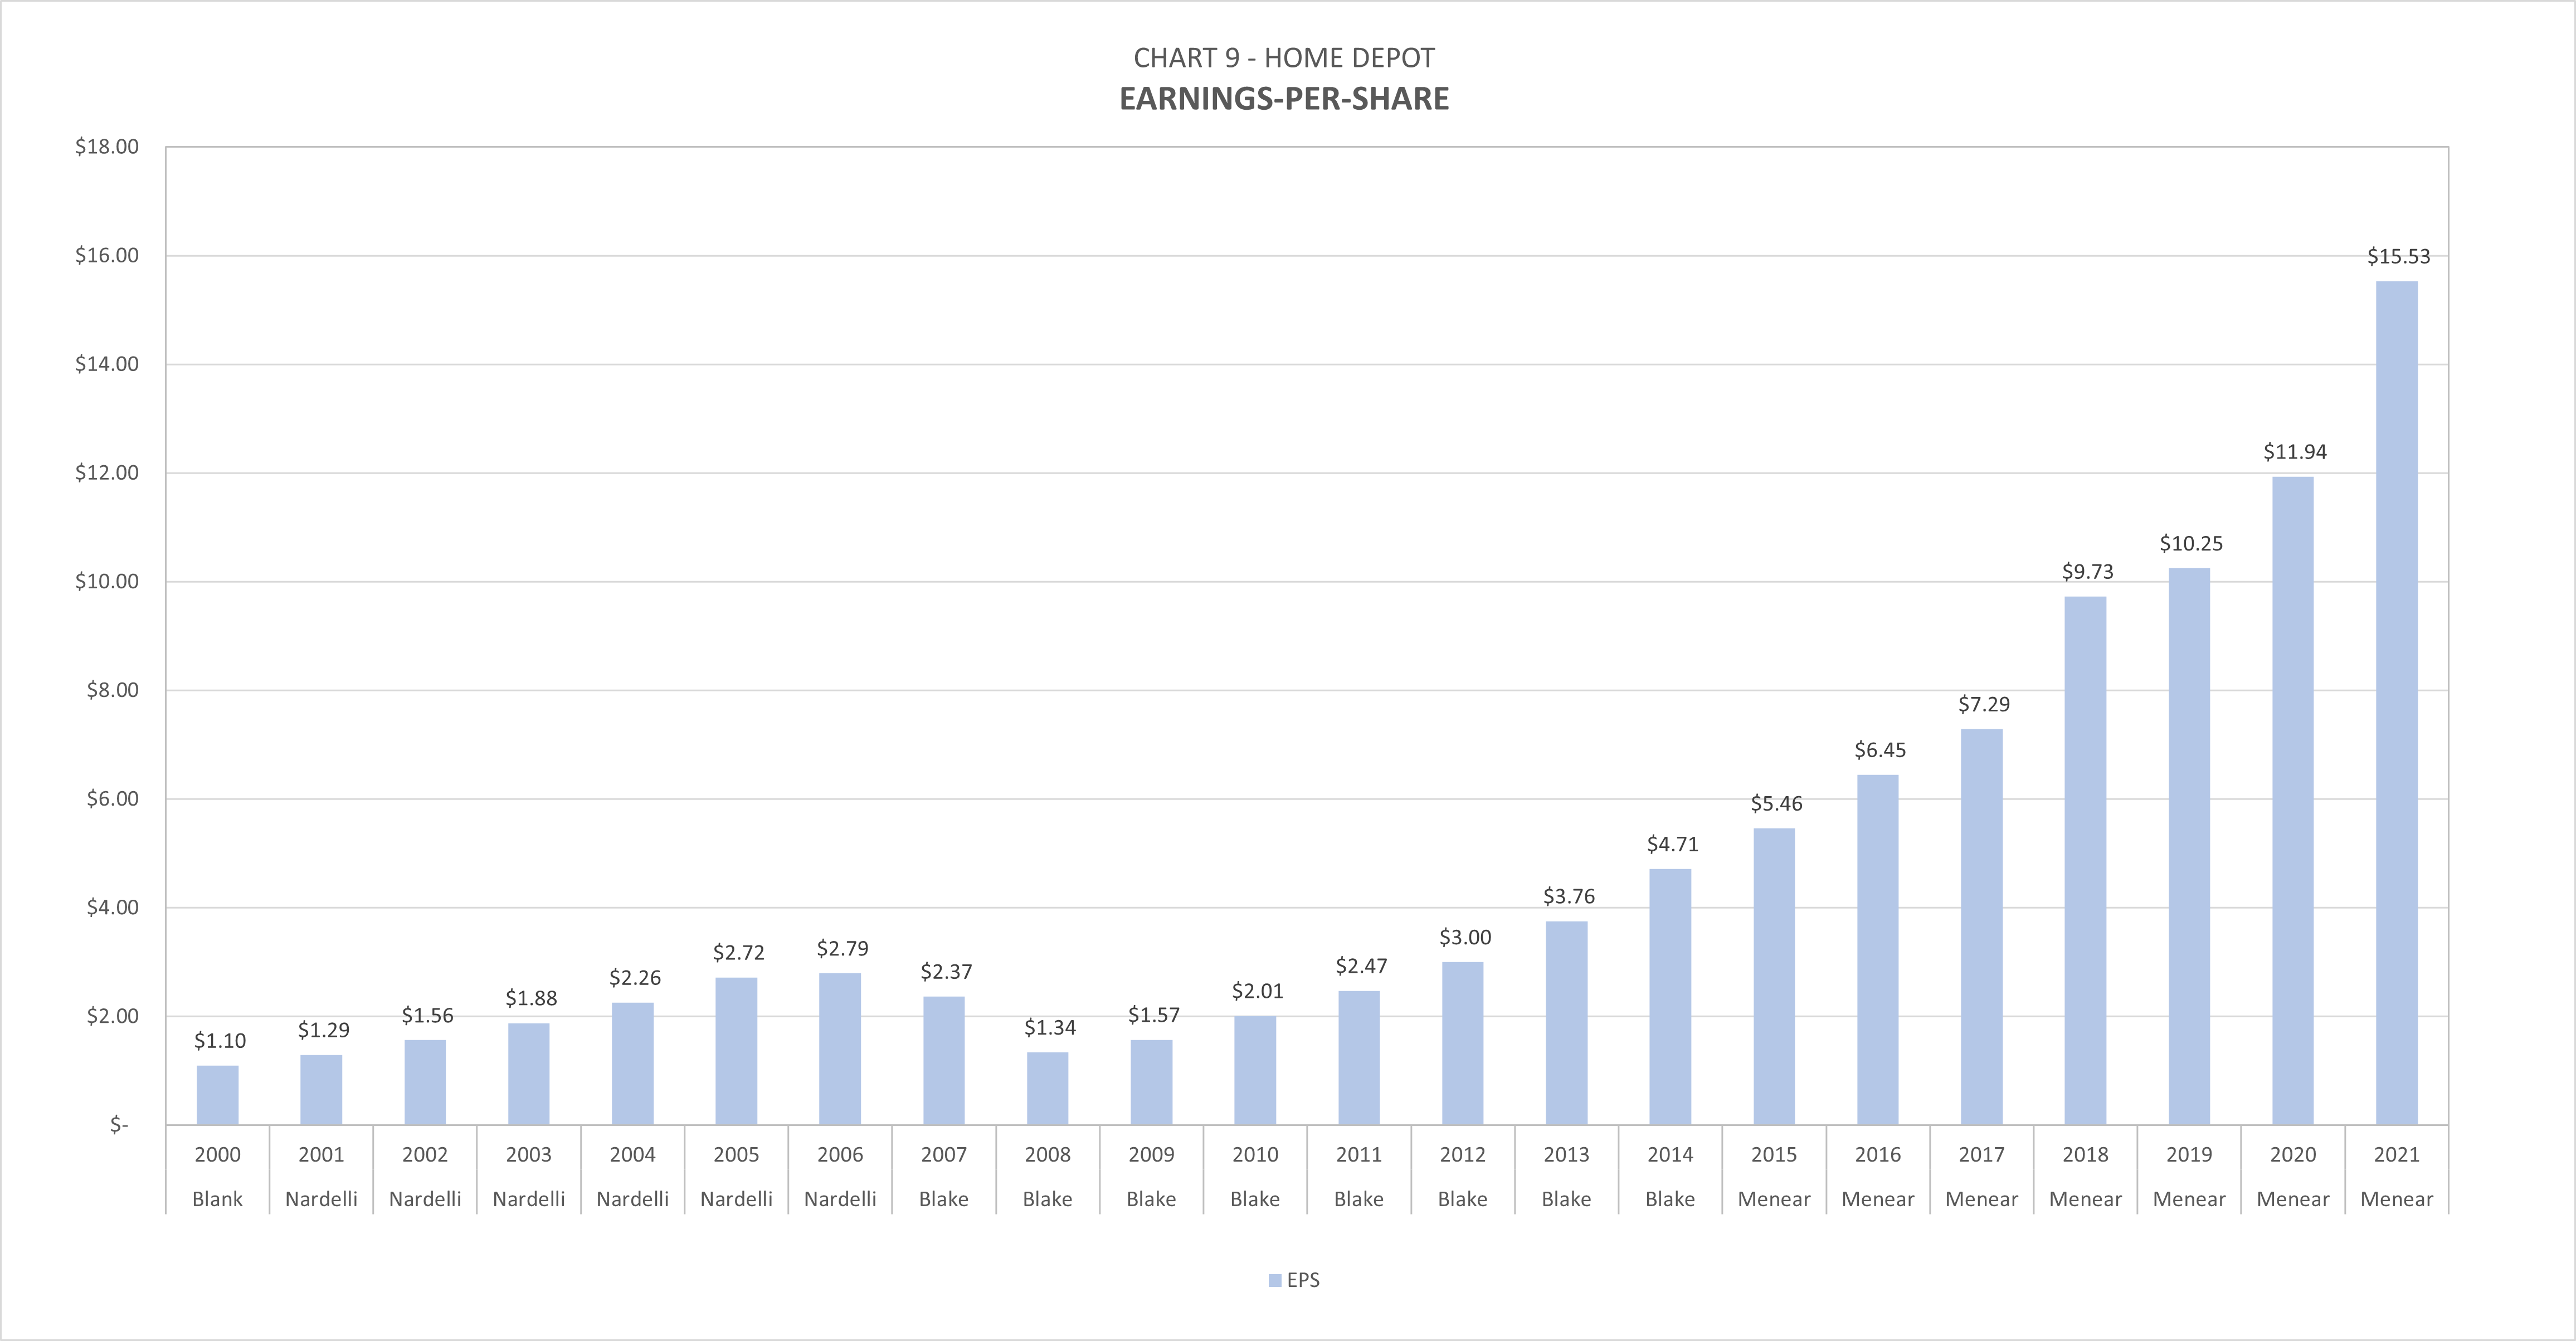
Assets
Author Generated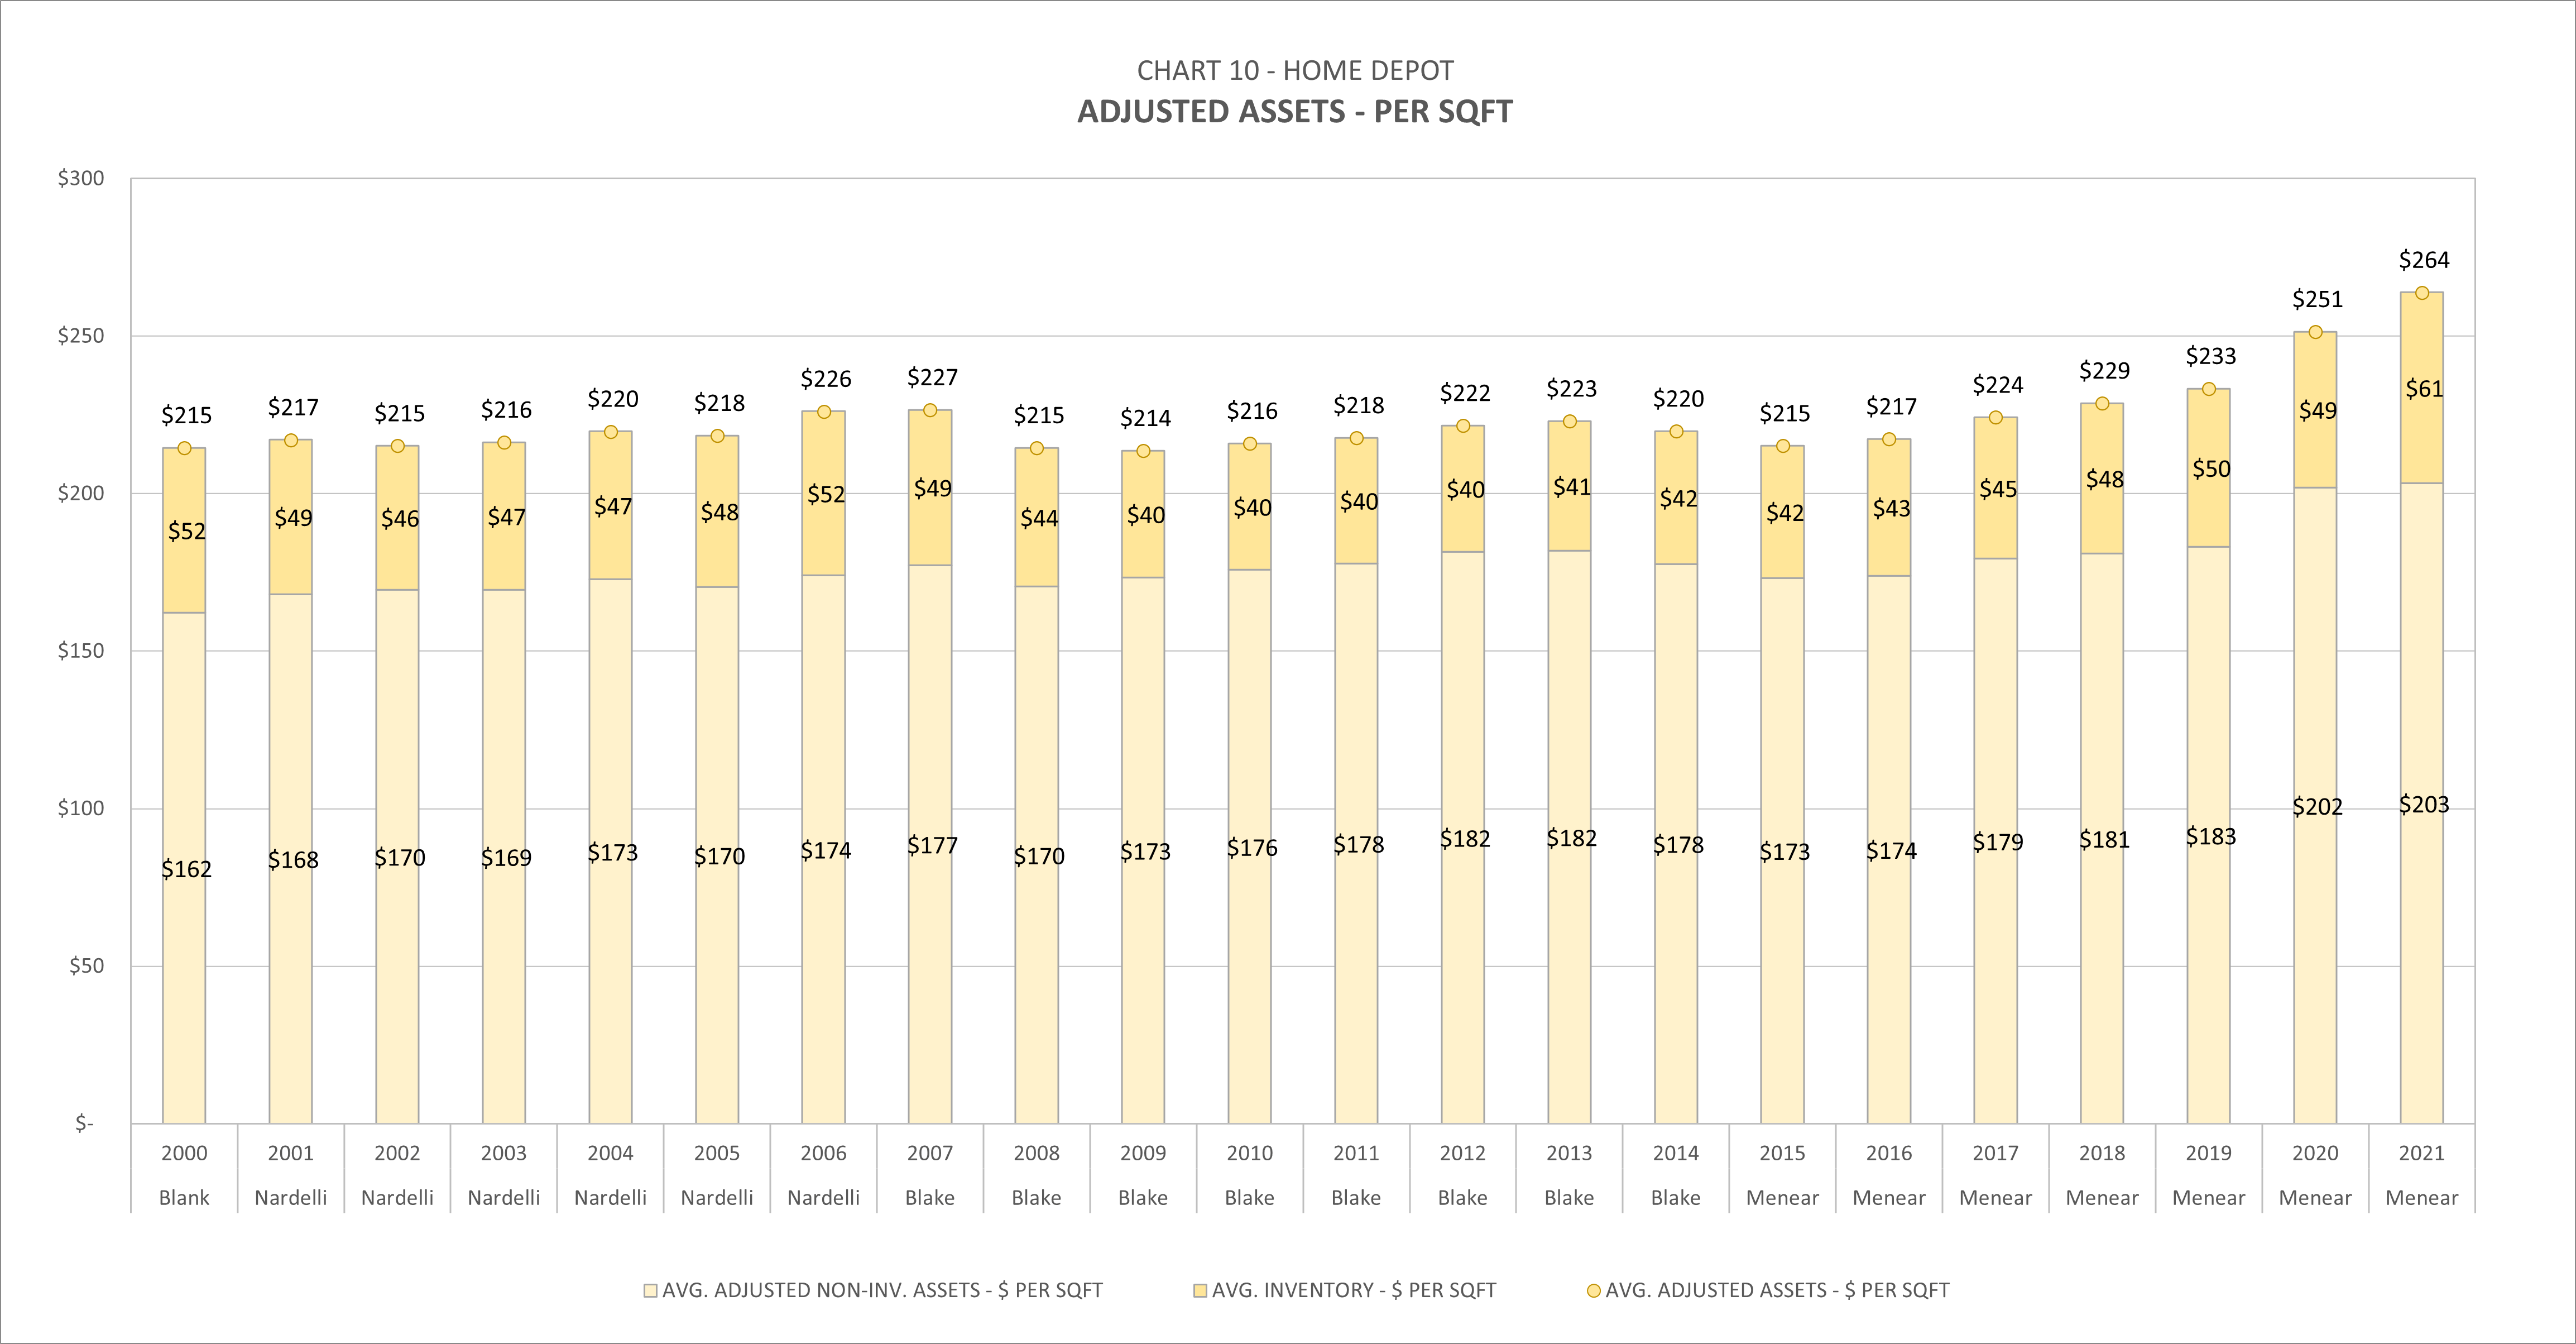
Chart 10 shows The Home Depot’s average adjusted assets over time. It’s useful to break out inventory and non-inventory assets to understand if changes in asset values over time may be inventory related.
Note: Adjusted assets = Average of this year and last year’s Total Assets – Cash – Goodwill – Other Asset + Accumulated Depreciation + Estimated Operating Lease Right-Of-Use Assets (for all years). Using gross PPE will understate ROA, but will also minimizes distortions from aging assets. This allows for a better approximation of capital needed to reproduce a similar asset base, along with a better apples-to-apples comparison against other retail competitors.
Return on Assets
Finally, dividing Net Income (Chart 7 – light blue) by Assets (Chart 10) yields ROA:
Author Generated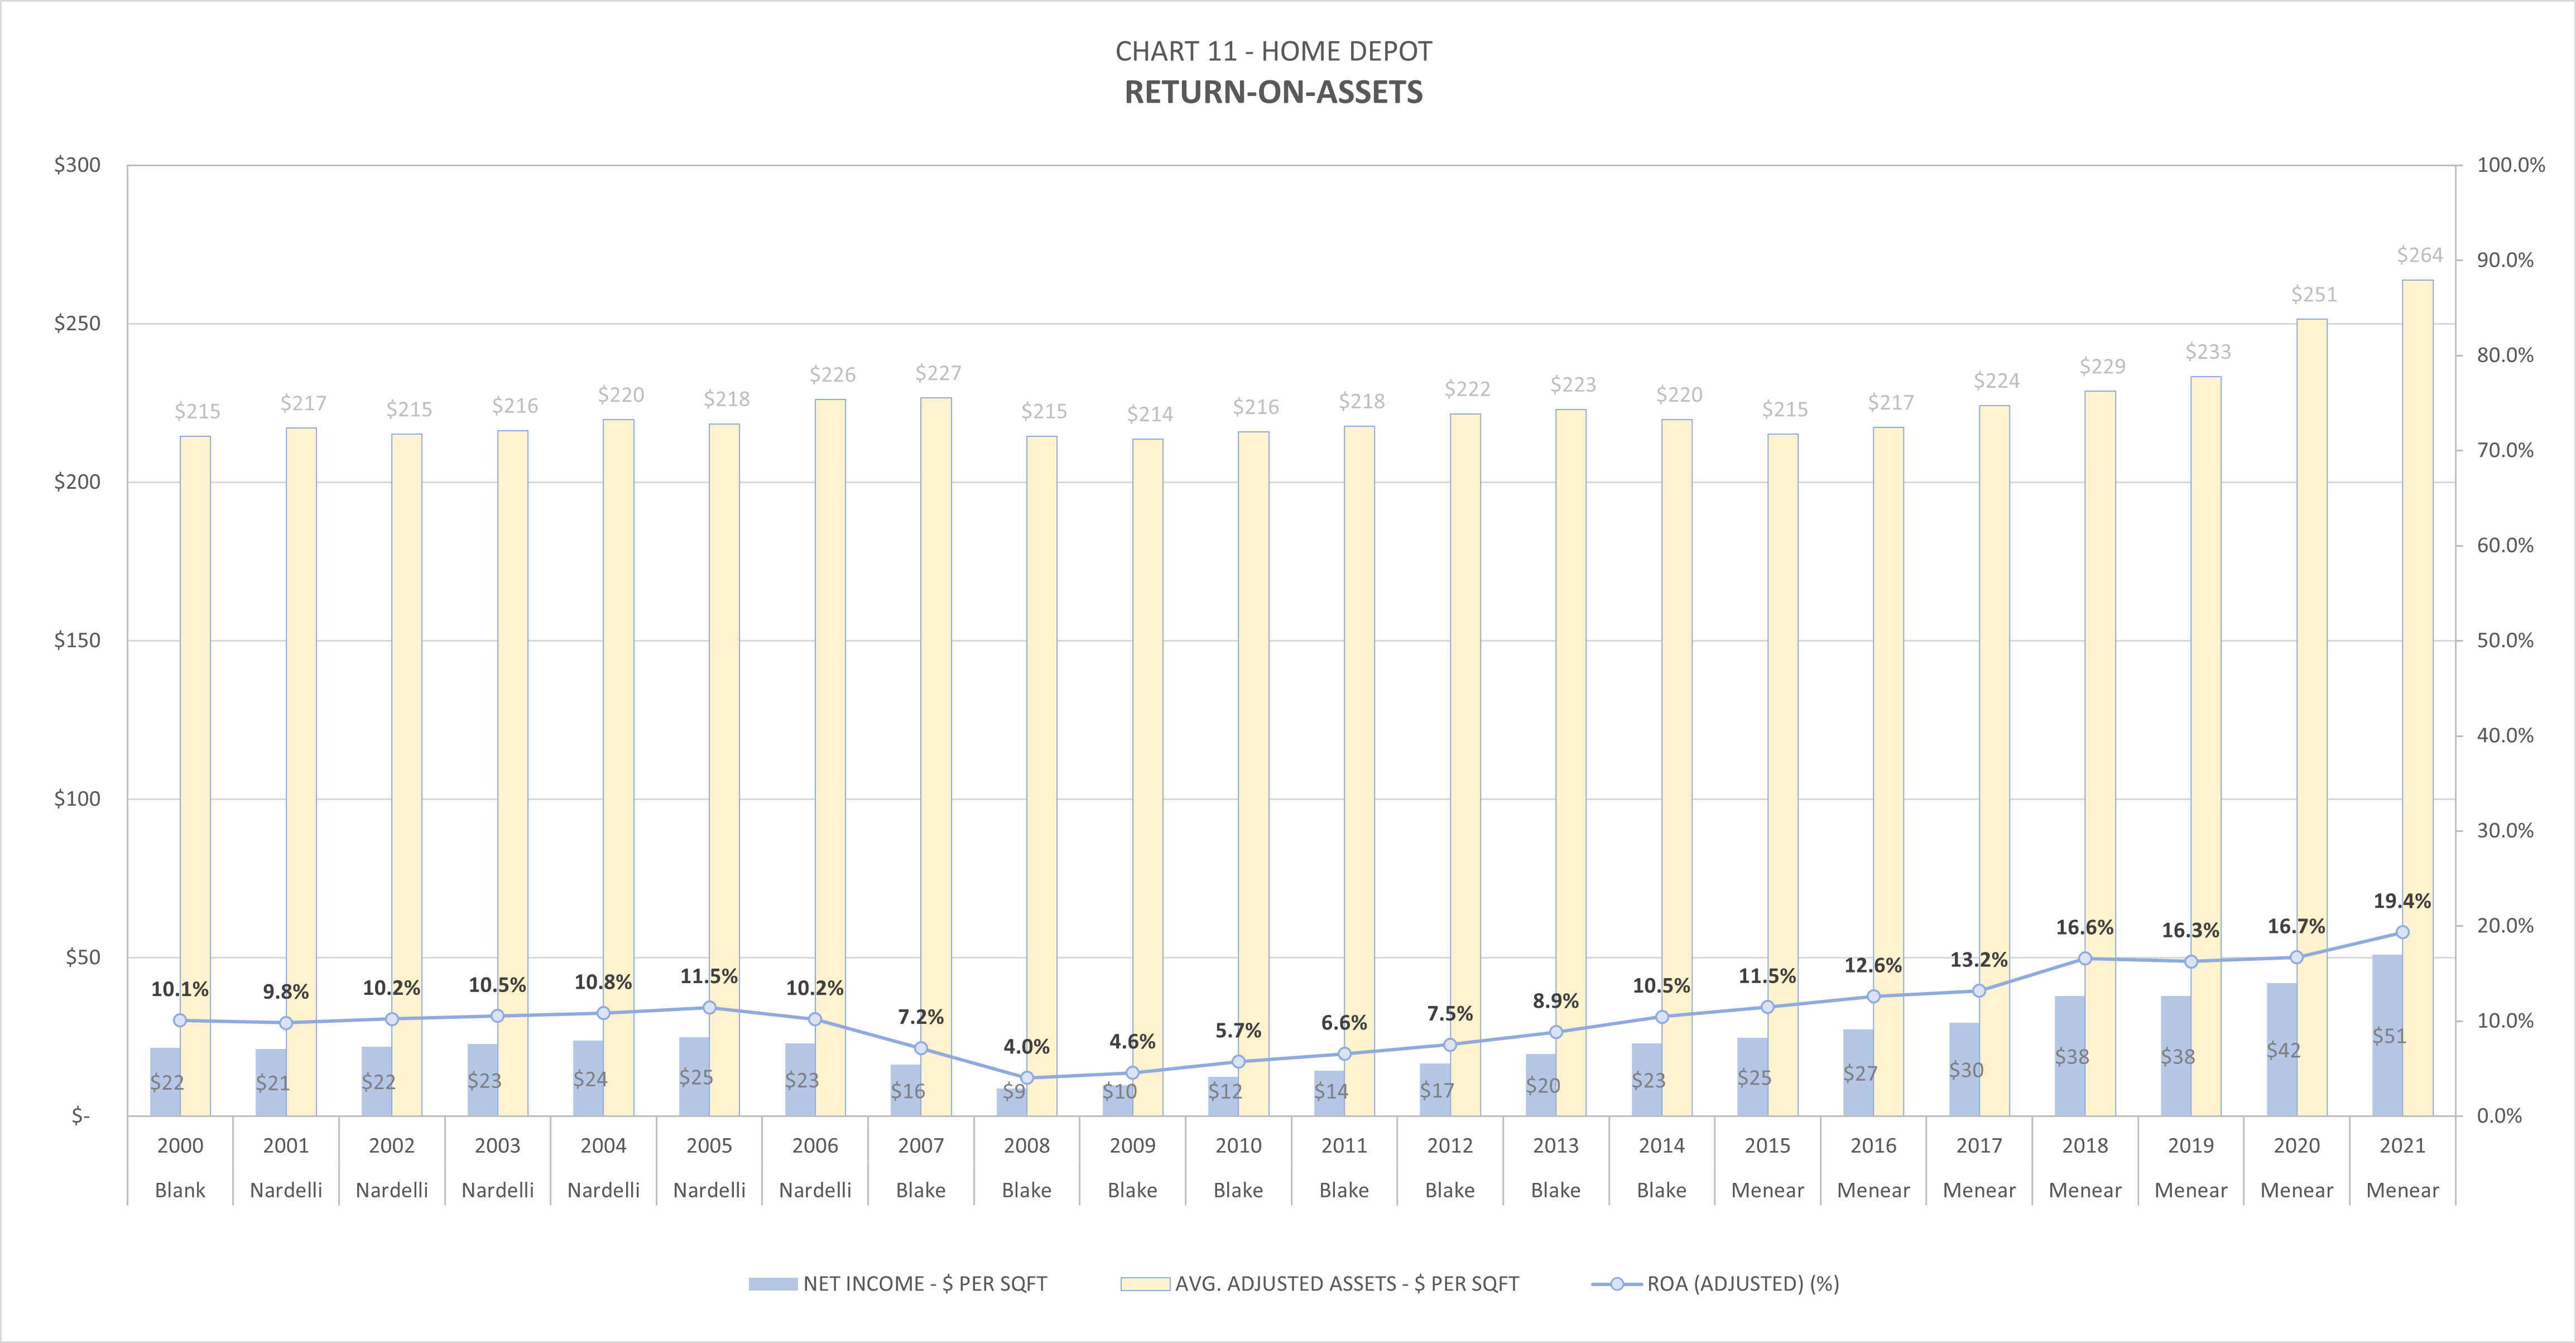
Return on Invested Capital
We can get from ROA to ROIC by converting Net Income to NOPAT and Assets to Capital using the 2 multipliers below.
NOPAT multiplier:
Author Generated
Capital Multiplier:
Author Generated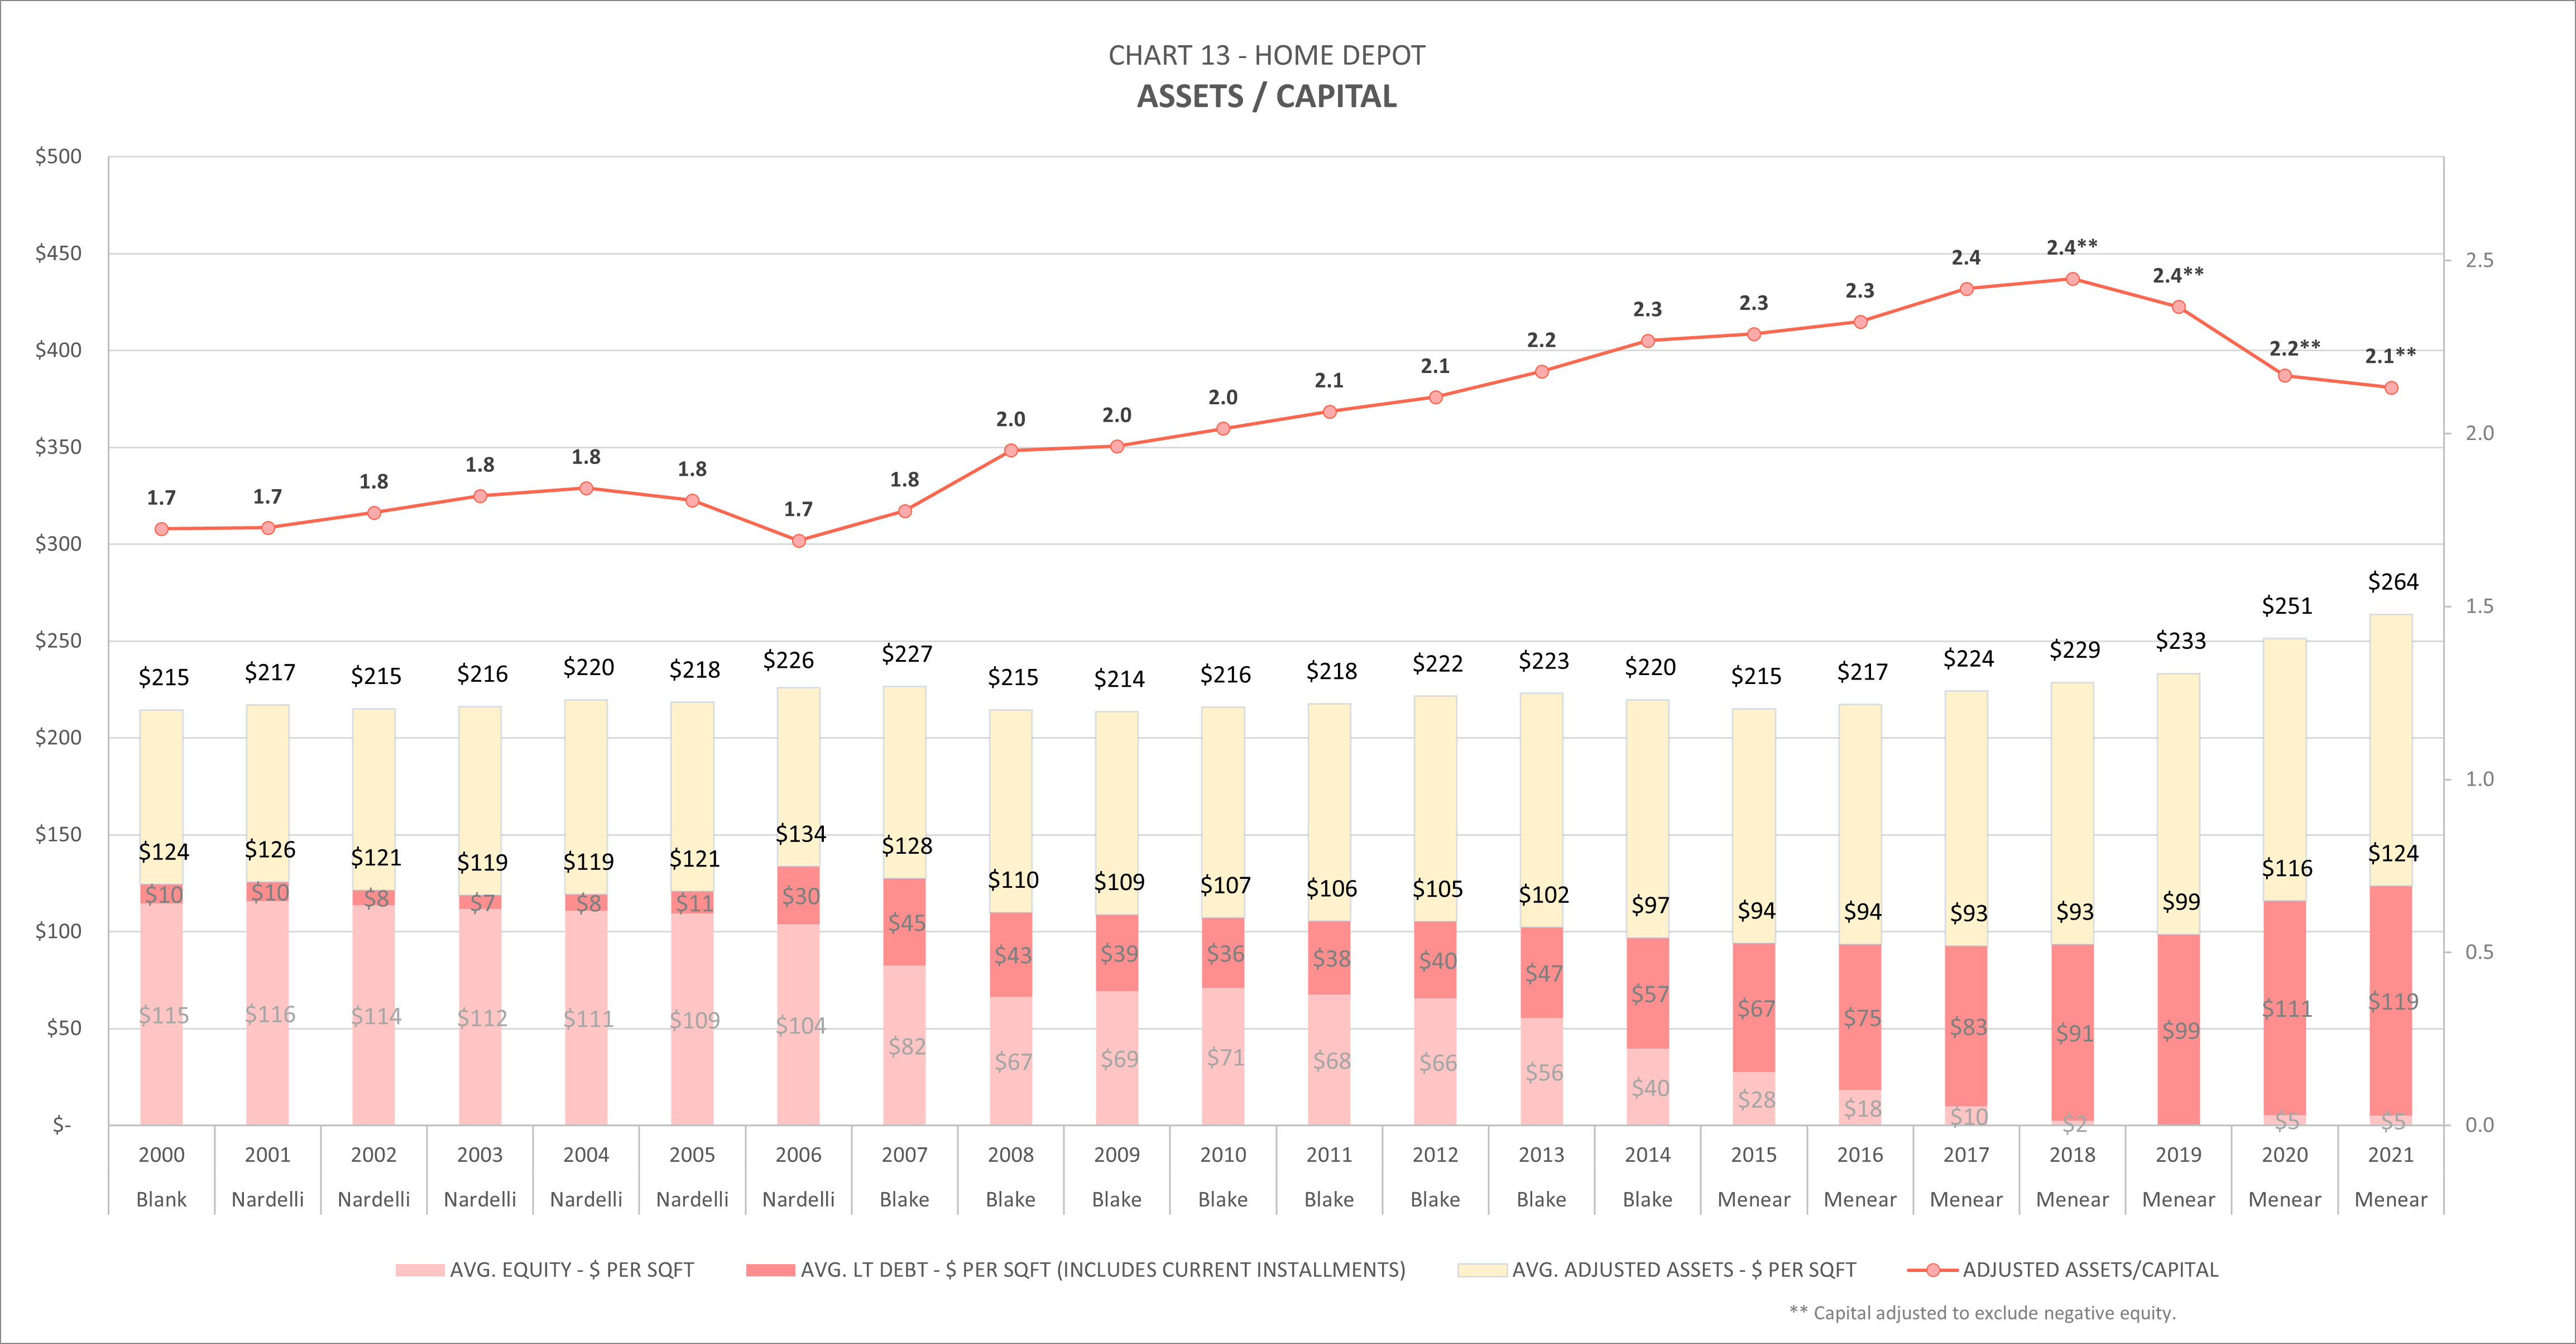
The capital multiplier measures a type of leverage that increases when the company can finance assets using non-interest bearing debt (e.g. net accounts payable). Since assets shown have been adjusted to include accumulated depreciation, the capital multipliers seen here will be higher than ones found using net PP&E.
As you can see from Chart 13, Home Depot has been replacing equity with debt over time by financing a portion of dividends and stock buybacks with debt capital. This has led to lower overall capital costs for the company generally, especially as interest rates have declined. Despite the growth in company debt, it still takes less than 2/10ths of an inventory turn to cover the interest (see Chart 4).
Note:
- Capital = average of this year and last year’s long term debt + equity.
- Long term debt includes current installments.
- Negative equity excluded for 2018, 2019 and 2021.
Multiplying Chart 11 by Chart 12 and 13 yields ROIC:
Repurchases
I’ve argued in the past that repurchases are better viewed as a redeployment of capital, not a return of capital. Instead of investing in PPE, the management is simply using shareholder cash to invest in the future earnings of exiting shareholders. As with any investment, price is important and must be weighed against all other capital allocation options available to that investor.
Using Chart 8, we can reconstruct Home Depot’s share repurchase history on a per-square-foot basis. The Home Depot has spent about $100 billion buying back more than half of its equity base since 2002. Chart 15 below shows the effective price continuing shareholders have been paying for 1 square foot of earnings. Adjusted Assets from Chart 10 are also shown for comparison and can be thought of as the rough price to build 1 additional square foot of store. From the company’s point of view, the cost of repurchasing a square foot of earnings has gotten increasingly unattractive when compared to the cost of building out more square footage. More on this later.
Author Generated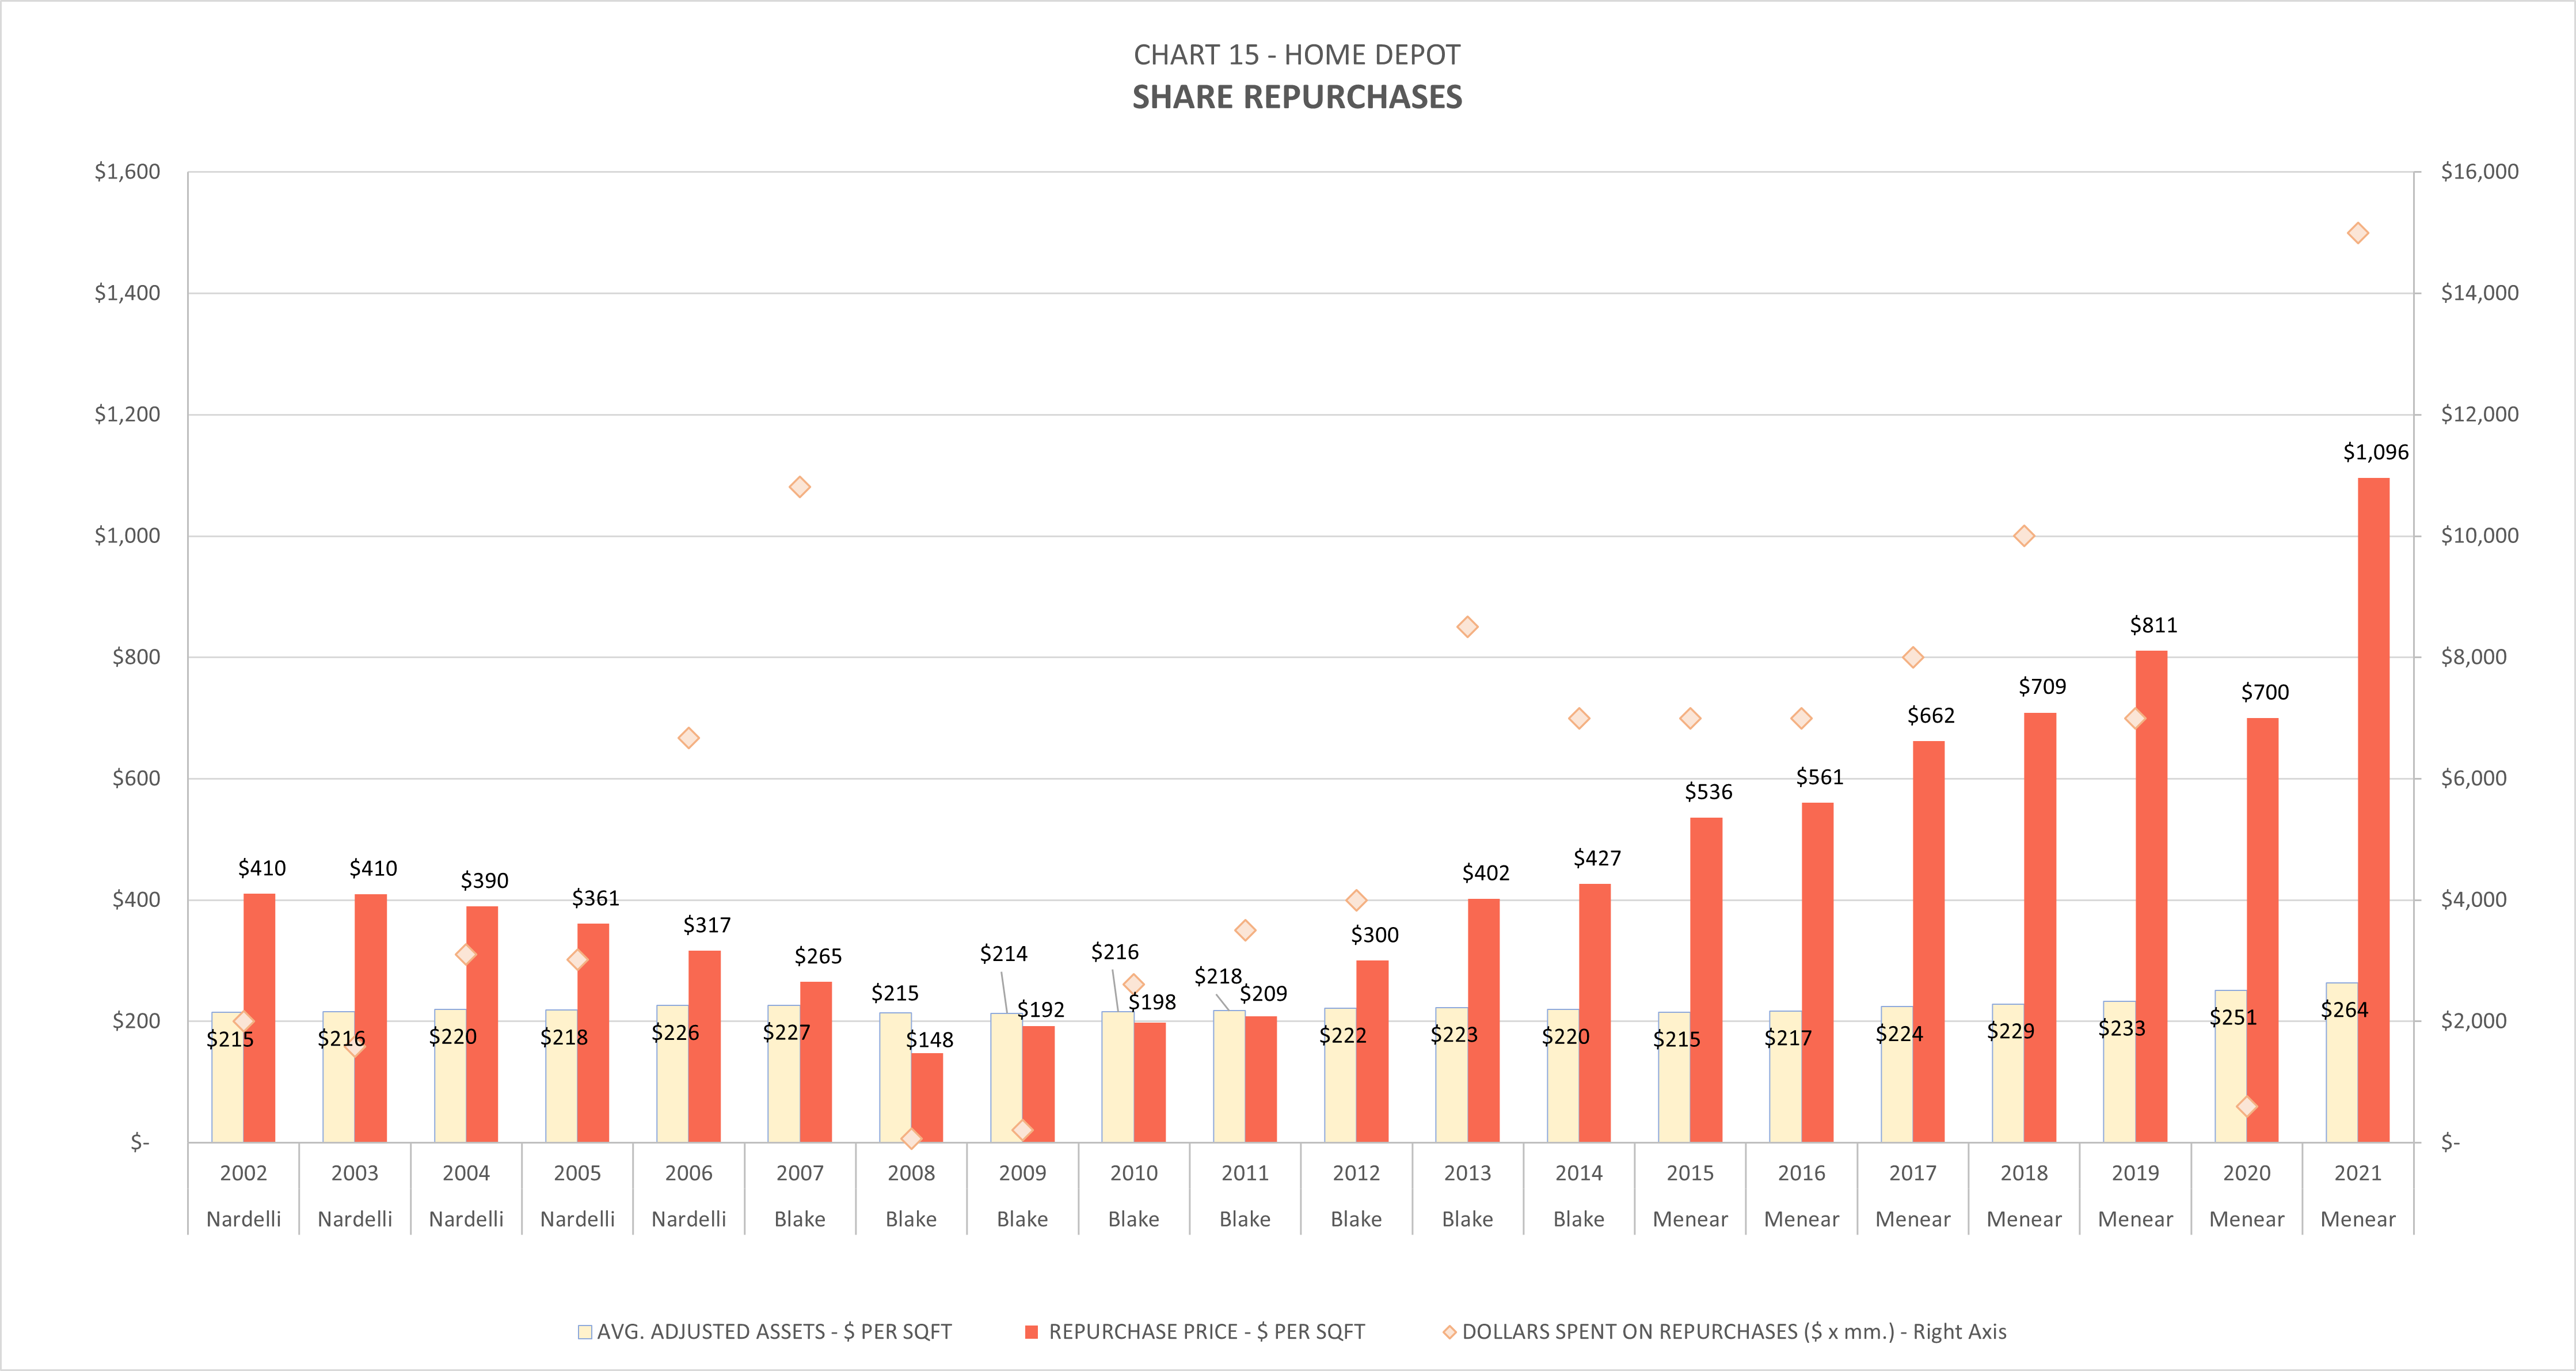
Post-Founder CEOs
Nardelli
One of the focuses of Robert Nardelli’s tenure was to continue the store growth momentum gathered by the company founders. From the end of 2000 to the end of 2006, HD was adding about 1 new store every 2 days. In addition to store growth, Nardelli also made strategic acquisitions to capture additional market share in the Pro and MRO markets.
The first metric that jumps off the page is the rise in inventory markup percentage. Chart 3 shows that gross margin dollars-per-turn increased 20%, from $21.13 in 2001 to $25.38 in 2006. The increase was the result of a general rise in both inventory value per square foot and markup % over time. Nardelli’s margin strategy was summed up in their 2004 Annual Report:
The increase in the gross profit rate was attributable to changing customer preferences and continuing benefits arising from our centralized purchasing group. Improved inventory management, which resulted in lower shrink levels, increased penetration of import products, which typically have a lower cost, and benefits from Tool Rental Centers also positively impacted the gross profit rate
Nardelli went on to say in a 2019 interview:
If you go to Home Depot and you see Rigid, Ryobi, Hampton Bay, Glacier Bay, Husky, Workforce, etc… those are all house brands. And every time we disintermediated one of our suppliers, we picked up 30 points of margin.
The inventory markup rate has stayed elevated since Nardelli left, hovering just around 50%.
During that same period, however, inventory turns decreased by 12% – from a high of 5.4 in 2001, to a low of to 4.7 in 2006. If HD Supply is excluded from the figures, the decrease in turns was closer to -16%. Part of that decrease can be explained by increased inventory value square foot. The remainder was due to lower per-square-foot volumes.
Since the rise in gross margin dollars-per-turn more than offset the volume declines, gross margin dollars per square foot from 2001 to 2006 saw a slight increase (Chart 5). This could be argued as a victory for Nardelli. He successfully turned The Home Depot into a lower cost/ higher margin business while almost doubling its footprint, all with no adverse impact on gross margin dollars per square foot. The problem was, this took place during one of the biggest housing booms in America. The strong housing market along with growth in the Pro and MRO may have helped mask deterioration in the underlying consumer business. This deterioration was believed by many to be a direct result of Nardelli’s approach. Critics cited a growing list of concerns, including:
- Cannibalization of per-square-foot sales from store expansion
- Declining customer satisfaction levels
- Market share loss to Lowe’s
- Lack of store refreshes
- Lower employee morale
- Lower performing EXPO stores
- Lower returns from the wholesale supply business
- Rising inventory levels
In a recent interview, recent CEO Craig Menear said:
You have to stay focused on your customer and your customer’s needs, and when you lose that focus bad things happen. And we lost that focus in the mid-2000s and got way too focused on competition… and candidly, we blew one of the biggest housing booms this country has ever seen.
Among employees, Nardelli had gotten a reputation for being autocratic and arrogant. His management style led to culture shock among legacy associates who were used to a more autonomous environment. Knowledgeable executives had been replaced by GE execs, and full-time store employees complained of an increase in poorly trained part-time associates. Most importantly, Nardelli did not buy into the culture. Then CFO Carol Tomé said this in a 2012 speech:
Our founders Bernie and Arthur also constructed a management construct which we call the inverted pyramid, and we’re at the bottom of the pyramid. We are here to serve the needs of our associates and customers… [and] during one of the tenures of those CEOs, This pyramid got turned the other way, where the CEO was on the top of the pyramid and the associates and the customers were on the bottom… and if you were shopping in our stores during that timeframe you know that we lost our way. You know that our customer service wasn’t where it needed to be. You know that we weren’t making the investments in the store that we needed to make. We weren’t doing the right thing.
Founder Bernie Markus was much more succinct about Nardelli’s leadership, saying that “he came close to destroying this company. He did not buy our values.”
Despite more than double earnings, the stock price didn’t budge under Nardelli’s leadership. Part of this may have been a function of HD’s high P/E when Nardelli started. Lowe’s was also doing a better job impressing customers and the market at the time. Whatever the reasons, Nardelli didn’t help himself with HD shareholders. In 2006, he decided to stop reporting same-store-sales. He then then infamously botched the next shareholder meeting by convincing other board members to stay home and limiting time angry shareholders had to ask questions. With rumors of a leveraged buyout in the air, an activist fund named Relational Investors threatened HD’s board with a proxy battle. After refusal to take a pay cut in early 2007, the board pushed Nardelli out, gave Relational a seat on the board, and brought Frank Blake in.
Blake
Frank Blake was by his own account an unusual pick for the CEO position. Prior to being in the top position, Blake was a real estate lawyer working for HD on M&A deals related to Nardelli’s expansion. Despite being a complete unknown by Wall Street and company employees, he was picked by the board as Nardelli’s successor. After some initial hesitation, Blake took the job in early 2007.
Leading up to the CEO transition, Relational Investors presented analysis suggesting Home Depot’s rapid store expansion was leading to bloated inventory levels, poor customer service, and low employee morale. Blake agreed and responded by halting retail store expansion, selling HD Supply, closing underperforming EXPO stores, and focusing on customer service and store productivity. You’ll see in Chart 2 that retail space flatlined at about 235 mil. square feet after 2007. Despite the halt in store construction, the company was able to stay on their trajectory of increasing per-share square footage. Blake simply replaced store expansion with additional share repurchases. In 2007 he used proceeds from the HD Supply spinoff to make the largest single-year repurchase of shares. The move ended up being an excellent deal for the shareholder given the price of the stock at the time (see Chart 15).
Unfortunately for Blake, the start of his tenure also marked the start of the most painful housing crash in U.S. history. 50% of homeowners’ equity vanished from the balance sheet of Americans over the next 3 years. Home improvement volumes fell off a cliff, dropping to 4 turns in fiscal 2007. Blake found himself trying to restore HD’s culture of treating employee’s well while also having to make large cuts to the SG&A line. Then CFO Carol Tomé said in a later interview:
We, like everyone else, had to make some hard decisions about how to weather this recession. Many companies chose to stop paying their people. In other words, they stopped making merit increases, they stopped making contributions into 401(k) plans, and they stopped paying bonuses. We decided not to do that… and in fact during the recession we continued to pay merit increases, we continued to pay bonuses for our hourly associates, we continued to make contributions into 401(k) plans. Now we had to make some tough decisions. We had to close some stores, we had to exit some businesses, we had to take people out of our store support center… about 1,000 people including 10% of our officer base.
Looking at Chart 5, Frank Blake was able to cut SG&A to a low of $59 per square foot in 2009-11. More impressive still, the SG&A line did not drift up as volumes recovered. The chart below on the left shows SG&A cost vs. store transactions. As you can see, there’s no correlation between SG&A and transaction volume under Blake (yellow). This means that SG&A-per-transaction decreased as transactions increased, something Nardelli or Menear were not able to replicate.
Author Generated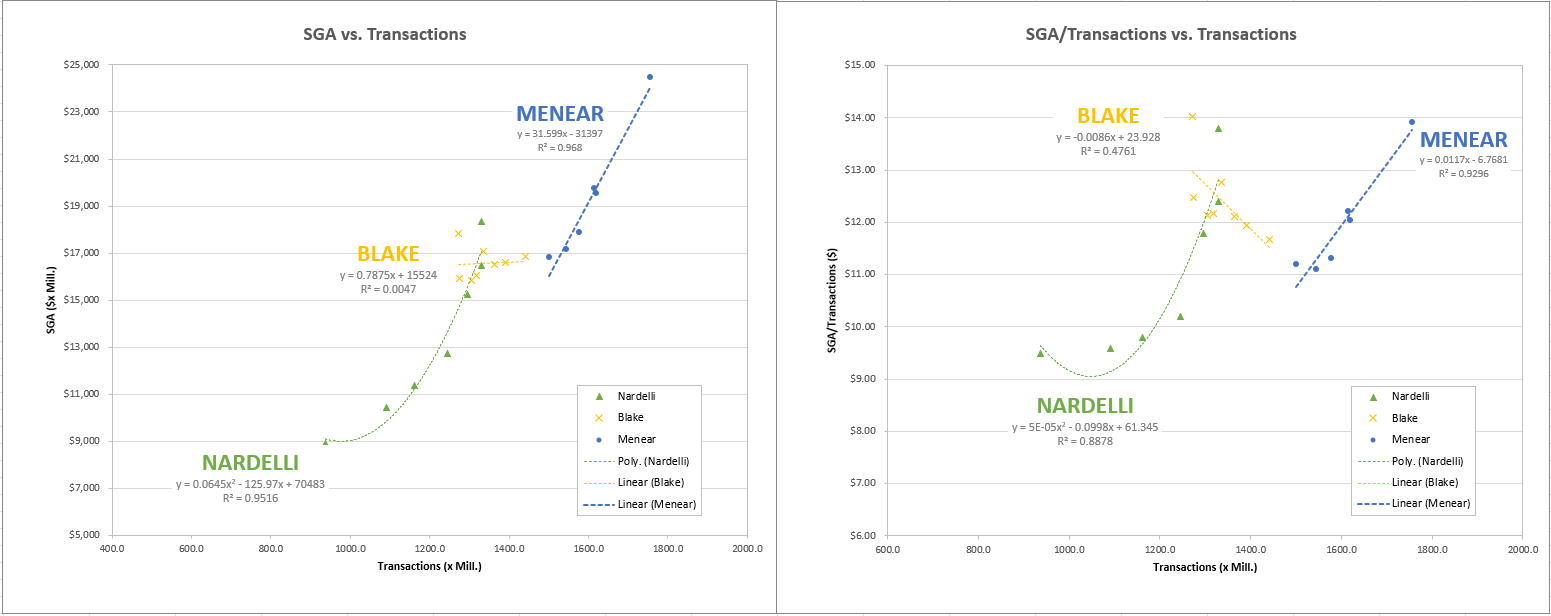
Blake not only ratcheted up operating leverage and employee productivity, he did it without triggering the levels of disdain that Nardelli did. He discussed his approach at the 2012 Global Retailing Conference:
We have an exercise that we call ’60/40′. If you look at the Home Depot of several years ago, 40% of the hours in our store were spent customer facing… 60% was spent tasking. We are on a path – a pretty aggressive path over the last several years – to flip those percentages to 60/40… 60% customer facing, 40% tasking.
By increasing the fraction of employee’s customer facing time at the same pace of 2009-14 traffic, Blake may have been able to keep customer engagement time constant during volume recovery without the need of additional headcount. This would have forced better employee productivity around tasking activities without the negative impact on customer service. To help ease the tasking burden, Blake’s supply chain team built new stock management algorithms to optimize inventory replenishment as well as 3 reverse logistics warehouses designed to centralize return processing. The early projects eventually led to a full supply chain overhaul that continues to this day. By 2014, the company was back to the same inventory turns as 2006, but with $12 per square foot less of SG&A cost.
Blake also utilized then SVP Mark Holifield to upgrade their legacy supply chain. Prior to 2011, 75% of merchandise was being shipped direct from suppliers to retail stores. After the drop in per-store volumes from expansion and the housing decline, stores were finding themselves needing more odd-lot orders from their vendors. Minimum purchase order requirements resulted in stores being either out-of-stock or overstocked in that product. The company solved this problem by utilizing Rapid Deployment Centers (RDCs) described in their 2010 10-K:
RDCs allow for aggregation of store product needs to a single purchase order, and then rapid allocation and deployment of inventory to individual stores upon arrival at the center. This process allows improved transportation, simplified order processing at suppliers and last minute reallocation from the time that product needs at stores are determined to actual replenishment.
By the end of fiscal 2010, the company completed a rollout of 19 RDCs. It led to much improved upstream supply chain efficiency. The RDC buildout can be seen in DC square footage increases from 2007 to 2010.
In early 2014, Blake promoted Holifield to a newly created EVP position called “Supply Chain & Product Development.” With the RDC rollout complete, Blake and Holifield shifted their attention to the overhaul of the company’s delivery network. Competitors like Amazon (AMZN) were causing a rapid shift in consumer expectations around the retail experience. Along with keeping up with their online competition, they needed to integrate their legacy systems into a new and fluid omni-channel business model that blended in store with online. Blake responded by ramping up investment in both IT and direct fulfillment centers DFCs. The newer facility design allowed for increased online SKU assortment for online shoppers while minimizing delivery time and variability. The ultimate objective was to operate an efficient but flexible delivery model by taking a more global view of company inventory and delivery assets. After Blake’s departure in 2014, Craig Menear accelerated investment in the area under the “One Supply Chain” initiative.
Blake’s strategy was undoubtedly a success. He was able to navigate the company through the dual crises of a housing-led recession and a board-led identity crisis. Volumes returned, productivity went up, and return-on-assets went from a low of 4% to a high of 10.8% by the time Blake retired. Most importantly, Blake was able to nurse the company’s culture back to health.
Menear
One of Craig Menear’s first initiatives as CEO was the rollout of the “One Home Depot” experience – Home Depot’s vision of an “interconnected, frictionless shopping experience that enables customers to seamlessly blend the digital and physical worlds.” Under Menear, Home Depot has been positioning to become the Amazon of bigger and bulkier home improvement items.
Crucial to the success if the strategy is completion of their One Supply Chain investments. The goal was – and still is – to give 90% of customers access to same or next-day delivery of all products sold in the store and online. This includes the growing Pro customer, who often need larger quantities of product delivered to a job site in time-specific windows. The objectives were to fortify the upstream supply chain assets already in place, buildout the necessary downstream delivery assets, sync the upstream and downstream product flows, and finalize the back-end IT to create the global view of inventory and delivery assets that Mark Holifield envisioned under Blake. Unfortunately for the company, the IT execution piece saw some headwinds. In a 2019 Investor and Analyst Conference, Meanar said:
Look, I think that we’ve shared with you that some of our investment has been pushed. And so some of the things that we’re doing are harder than what we anticipated. If you think about the underlying changes that we’re making to be able to drive this experience, we have shared that one of the complications that underlies a lot of the work that we’re doing is, if today, you have an item that exists in-store and online, and by the way, in our MRO business, that carries 3 SKUs in our world today. And so we can’t present a consolidated view to the customer until we solve that underlying problem, and the team’s working really hard. And when we solve that underlying problem, then we can drive significantly greater leverage through the supply chain, and we can drive more value for the customer. And I’d say, Eric, we probably — maybe we were just a little bit too ambitious in our thinking as to how fast we could get some of this done, how fast the benefits would come.
The unsolved IT problems appeared to also bring delays in the buildout of physical infrastructure. For instance, the company planned to build 40 (now 30) flatbed delivery centers, or FDCs, by the end of 2022. The flatbed centers are designed to move delivery processing of big and bulky items like lumber and drywall away from the stores and into a facility designed for flatbed delivery. The added capacity is expected to take the pressure off of retail store employees, improve delivery flexibility, and ensure job-lot quantity availability, ultimately increasing the company’s headroom for growth in the Pro market. FDCs can also be built for a fraction of the cost of retail stores, keeping ROIC elevated while selling products that see lower gross margins. As of early 2022, however, they still appear to be stuck in the early innings of that buildout. The 2020 acquisition of HD Supply and recent departure of Mark Holifield may have only complicated matters around supply chain, to say nothing of short-term COVID impacts. Ted Decker, the Home Depot’s next CEO, will most likely have some cleanup work to do in this area.
Notwithstanding the supply chain challenges, Menear did make some positive headway in a number of areas. He purchased share in the MRO market with the 2015 and 2020 acquisition of Interline Brands and HD Supply, respectively. At the time of purchase, HD Supply had already spun off its White Cap construction division to become a pure-play MRO operator specializing in multifamily, hospitality, and healthcare. Menear sees multi-family turnover and refresh periods as another opportunity to grow Pro share. In a June 2021 analyst interview, he said:
[the HD Supply acquisition]… was to really position ourselves to much better serve the multi-family operators which really control about 50 million households out of 130 million occupied households in the country. And we want to be able to not only serve customers that are in multi-family directly… there’s needs that they have, whether that’s cleaning needs or other types of things that they do… but we want to be able to serve those property owners as well, to be able to not only handle their maintenance cycle but actually do their capital refresh work when that is needed.
The main business risk with large acquisitions like HD supply is the loss in focus around the core retail business. In an interview that aired just prior to the acquisition announcement, former CEO Frank Blake talked about his decision to sell HD Supply in 2007:
It’s hard to be excellent. It requires everything you have to be excellent at anything. As you expand and become… you know… for Home Depot we had a retail business… then you say, OK, well, we’re also going to be excellent at commercial distribution, which is what the HD Supply business was… I knew for myself that that was just a hill way too far. It was going to be everything I had and then some to run a great retail. I think that’s a general rule, but you’d have people who say… nope, conglomerates can work and you could be excellent at many things. I happen to believe excellence takes intense focus.
Given such diverging views of the successive CEOs, only time will tell if Home Depot is the right home for the MRO business.
Other successes included the company’s massive investment in the retail store’s look and feel. Upgrades in wayfinding and lighting make the stores more approachable for the everyday DIYer, a direct attack on one of Lowe’s competitive advantages. The front-end digital experience has also improved over time, especially for the Pro user. Pros can even use the mobile app for job lead generation as long as they keep making product purchases at the Home Depot. The program has potential to be a large source of product pull-through if the company can maintain work quality standards and security for DIFM customers as it scales.
Menear also had some good fortune during his seven year run. Chart 7 shows a substantial drop in the company’s tax rate as a result of the Trump tax reforms. Until the tax rules change again, the shareholders can keep another 13% of the company’s pre-tax earnings. Additionally, HD saw a COVID-led boom in DIY home improvement activity as the American workforce got reacquainted with the inside of their homes. With more time for repairs and higher personal savings rates, sales for DIY home improvement soared. Inventory turns reached a high of 5.8 in 2020, a record for the past 20 years. Much of this was due to COVID-induced inventory struggles, but some of the strong performance was probably market share gains from Lowe’s. The company pivoted quickly in 2021, leaving the year with an average inventory of $61 per square foot, a record high for the past two decades. It’s anyone’s guess as to where inventory turns settle out after the pandemic. As people open their homes to contractors again, it’s possible that Pro sales growth can help fill the gap that softening DIY sales will leave behind.
Menear’s good performance has been rewarded by the market. In late 2021 Home Depot’s stock price peaked at over $415/share. The high price is a blessing and a curse for long-term investors, as the company has continued to buy back shares near current market highs. As Chart 15 shows, Home Depot has built out retail stores and DCs for $250 per square foot, but has spent 4x that amount buying that square footage back from selling shareholders. At current market prices, there’s a strong case to be made for decelerating repurchases and increasing Capex above the current rate of 2% of sales. At the moment, building out additional supply chain assets at less than $100 per square foot seems like a much better deal for continuing shareholders and customers than cashing sellers out at $1000+ per square foot (see Chart 15).
Unfortunately, past success may be reinforcing any reluctance to ramp up capital reinvestment. Unlike repurchases, infrastructure investments tend to drag ROIC down in the short term by increasing the capital base. With current ROIC above 40%, there’s a risk that management gets psychologically anchored to that figure over time. If the bar for future capital returns is too high, lower returning projects that may be needed to maintain long-term competitiveness don’t get done. HD has done a good job staying insulated from competitors like Amazon thus far, but they’re going to have to keep their foot on the gas if they want to stay protected. That said, I’ve never actually tried spending $4-$5 billion dollars in a year. I’m sure it’s easier said than done.
Capex decisions aside, HD’s board could do a better job aligning management incentives with long-term shareholder interests. Generally speaking, share repurchases have inherent benefits that make them an attractive option for managing excess cash. Given HD’s capital calculation method, however, management has an additional incentive to keep cash off the balance sheet near the end of a period to keep to minimize the capital base. This means that share repurchases, even ones made at silly prices, help to maximize HD’s ROIC. As shown in Chart 15, the company has been repurchasing increasing amounts of stock at higher and higher prices. At some price point the repurchases start to include a subsidy to exiting shareholders, paid for by continuing shareholders.
The board might consider installing a pressure relief valve by excluding cash from the capital calculation in the same way Target (TGT) does, giving management more flexibility around repurchase timing. If the stock price stays elevated, the company can simply keep the cash on the books or decide to pay an annual special dividend without a hit to executive compensation. I’d bet that most long-term shareholders would rather pay the tax on a juicy distribution than watch exiting shareholders walk away with their money during market highs. If you’re a shareholder, I’d be curious to hear what you think. Feel free to comment below. Also, please leave a comment if you’d like to see a side-by-side with another retail company using this type of analysis.
Be the first to comment