

wdstock
The broader market has seen a substantial decline since the beginning of the year due to several macroeconomic headwinds, including rising interest rates, high inflation, elevated commodity prices, supply chain disruptions, COVID-19 related restrictions, increasing geopolitical tension in the Eastern European region and a declining consumer confidence in the United States.
Some firms, however, have remained relatively unaffected by these macroeconomic challenges, and one of them is AT&T (NYSE:T).
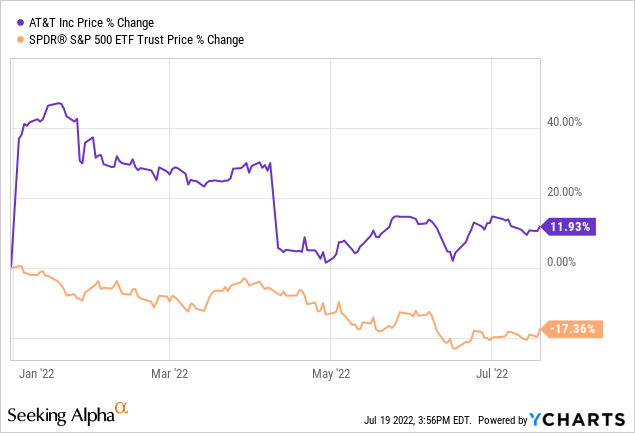
While the broader market has declined by as much as 17% year-to-date, AT&T’s share price is up by about 12%.
In this article, first we will be evaluating how T is expected to perform in the current market environment, based on its historic stock price performance during time periods characterized by low consumer confidence. Then, we will also establish a range of fair values for T’s stock using the Gordon Growth Model and identify a range of justifiable price to earnings ratios.
Performance during periods of low consumer confidence
Consumer confidence is a leading economic indicator, which is often used to predict near term changes in the spending behavior of the consumer. A low or declining consumer confidence is an indication that people are not sure about their financial outlook and therefore are likely to start reducing their spending and start increasing their savings. Such a behavior is expected to have a more pronounced impact on firm’s that manufacture and sell durable, discretionary, non-essential goods. Services may also be impacted, as people are likely to start reducing costs by choosing lower cost alternatives.
Consumer confidence in the United States had already seen a sharp drop in 2020, when the pandemic started, however in 2022 the decline has continued. The current U.S. consumer confidence is even lower than the levels observed during the 2008-2009 financial crisis. Although consumer spending has remained strong in the first half of 2022, we believe that the low confidence is eventually going to result in slowing spending.
U.S. Consumer confidence (Tradingeconomics.com)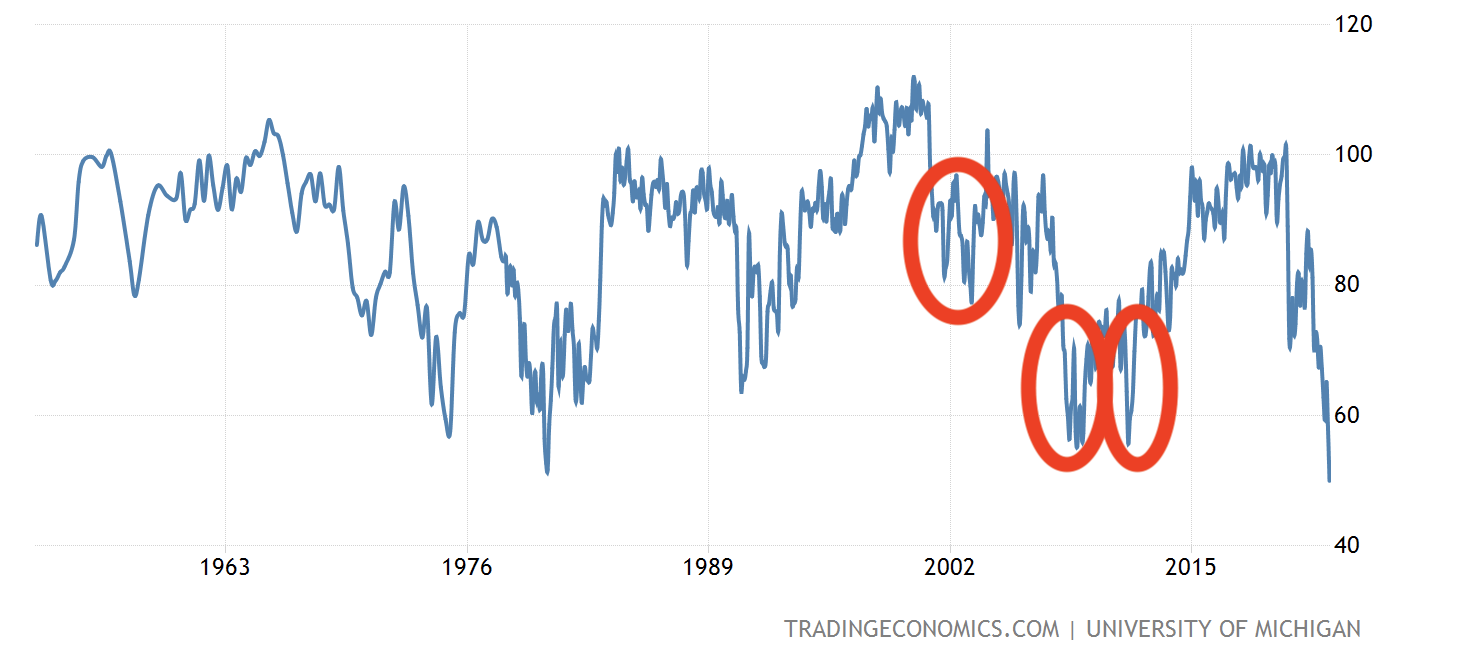
Let us now take a look at how AT&T has actually performed during times of low consumer confidence in the last 20 years. Our periods of interest are marked by the red circles.
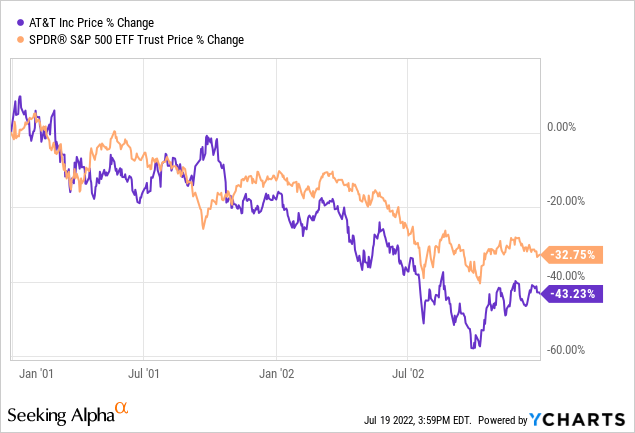
2001-2003
In this period, T underperformed the S&P500 by about 10%, losing more than 43% of its market value in this two year period.
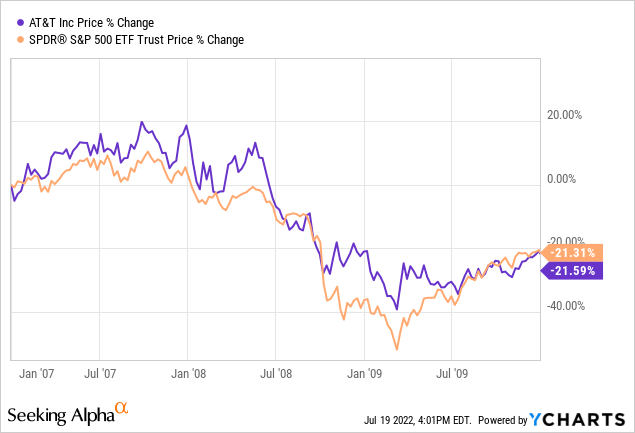
2007-2010
Between 2007 and 2010, the firm performed in line with the broader market during the entire period. Both the SPY and T declined by about 21% in this three year time frame.
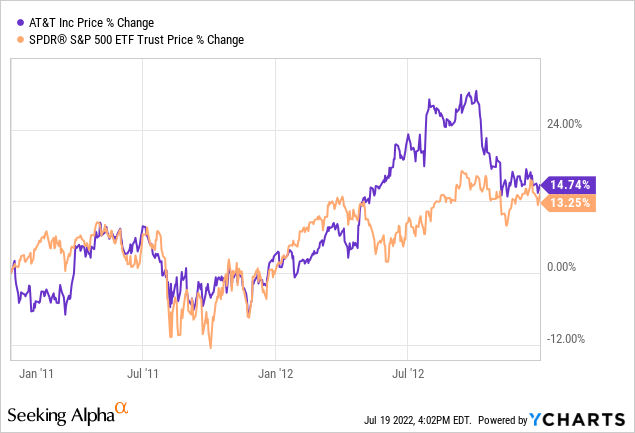
2011-2013
In this time period, both the broader market and AT&T closed in the positive territory. And once again the firm performed in line with the broader market.
Although past performance is not always indicative of future performance, we expect that based on these three time periods, AT&T’s stock may not be a safe haven during periods, characterized by low consumer confidence levels. In our opinion, the Integrated Telecommunication Services industry is in general very competitive. The pricing power of the firms is limited and the switching cost between providers is relatively low. For these reasons, we believe that the stock’s outperformance may continue in the short term, but are not likely to be sustainable in the longer run.
Let us take a look now at the firm from a valuation point of view. To value the firm, we will be using the Gordon Growth Model.
Valuation
Gordon Growth Model
The Gordon Growth Model is a simple dividend discount model, which can be applied to determine the fair value of equity of dividend paying stock. For the Gordon Growth Model to be applicable, the firm should fulfill a set of criteria:
- The company pays a dividend
- Stable dividend growth is expected at a constant rate in perpetuity
- The firm is relatively unaffected by the business cycle fluctuations
Also a plus, if a firm has a strong track record of steadily increasing dividend payments.
AT&T has been paying a safe and sustainable dividend for the last 38 years, and even increasing the payout in most of the years. The current annual dividend is $1.11 per share. We believe that it is a suitable candidate to be valued by using this dividend discount model.
Dividend history (Seekingalpha.com)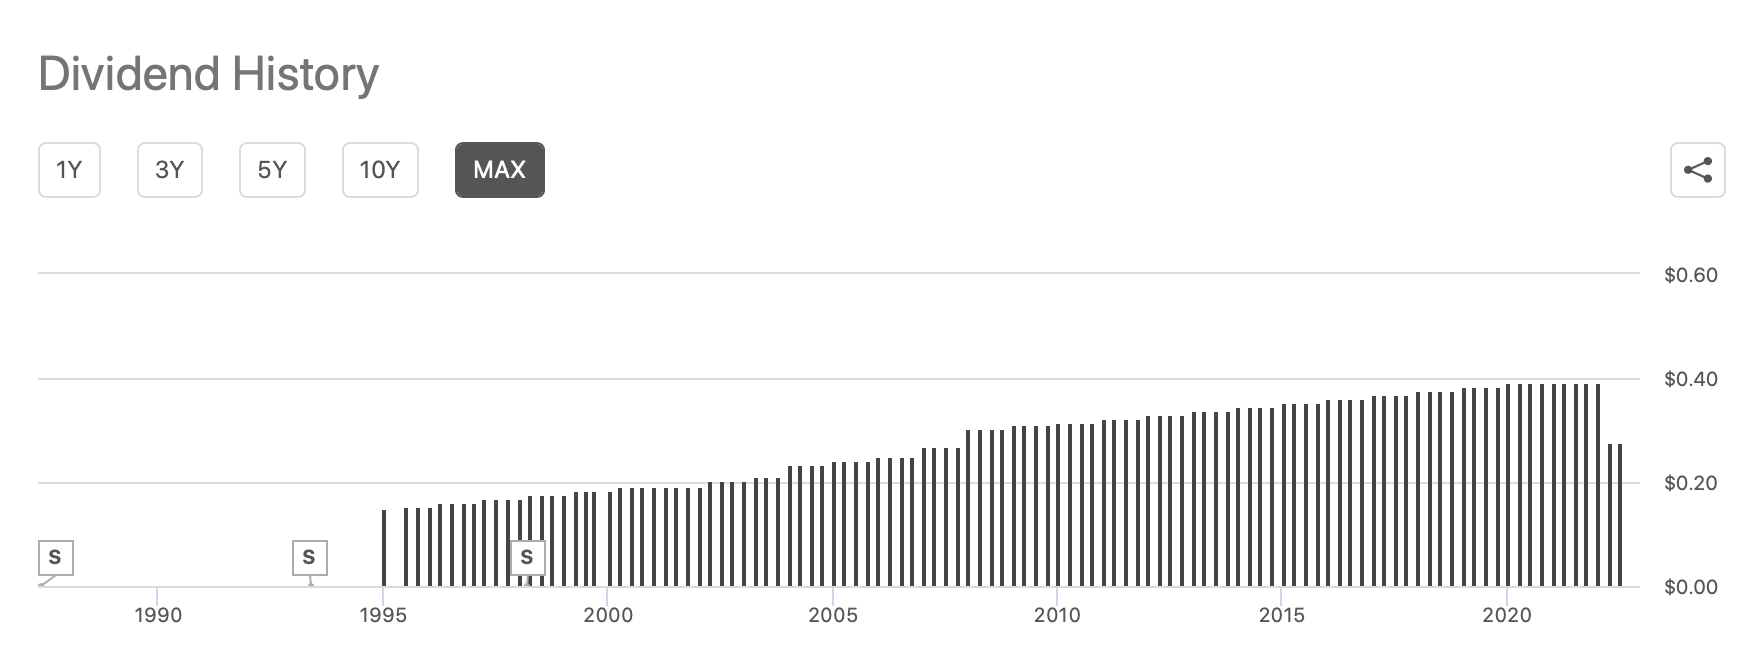
The following formula describes the mathematics behind the GGM.
Gordon Growth Model (wallstreetprep.com)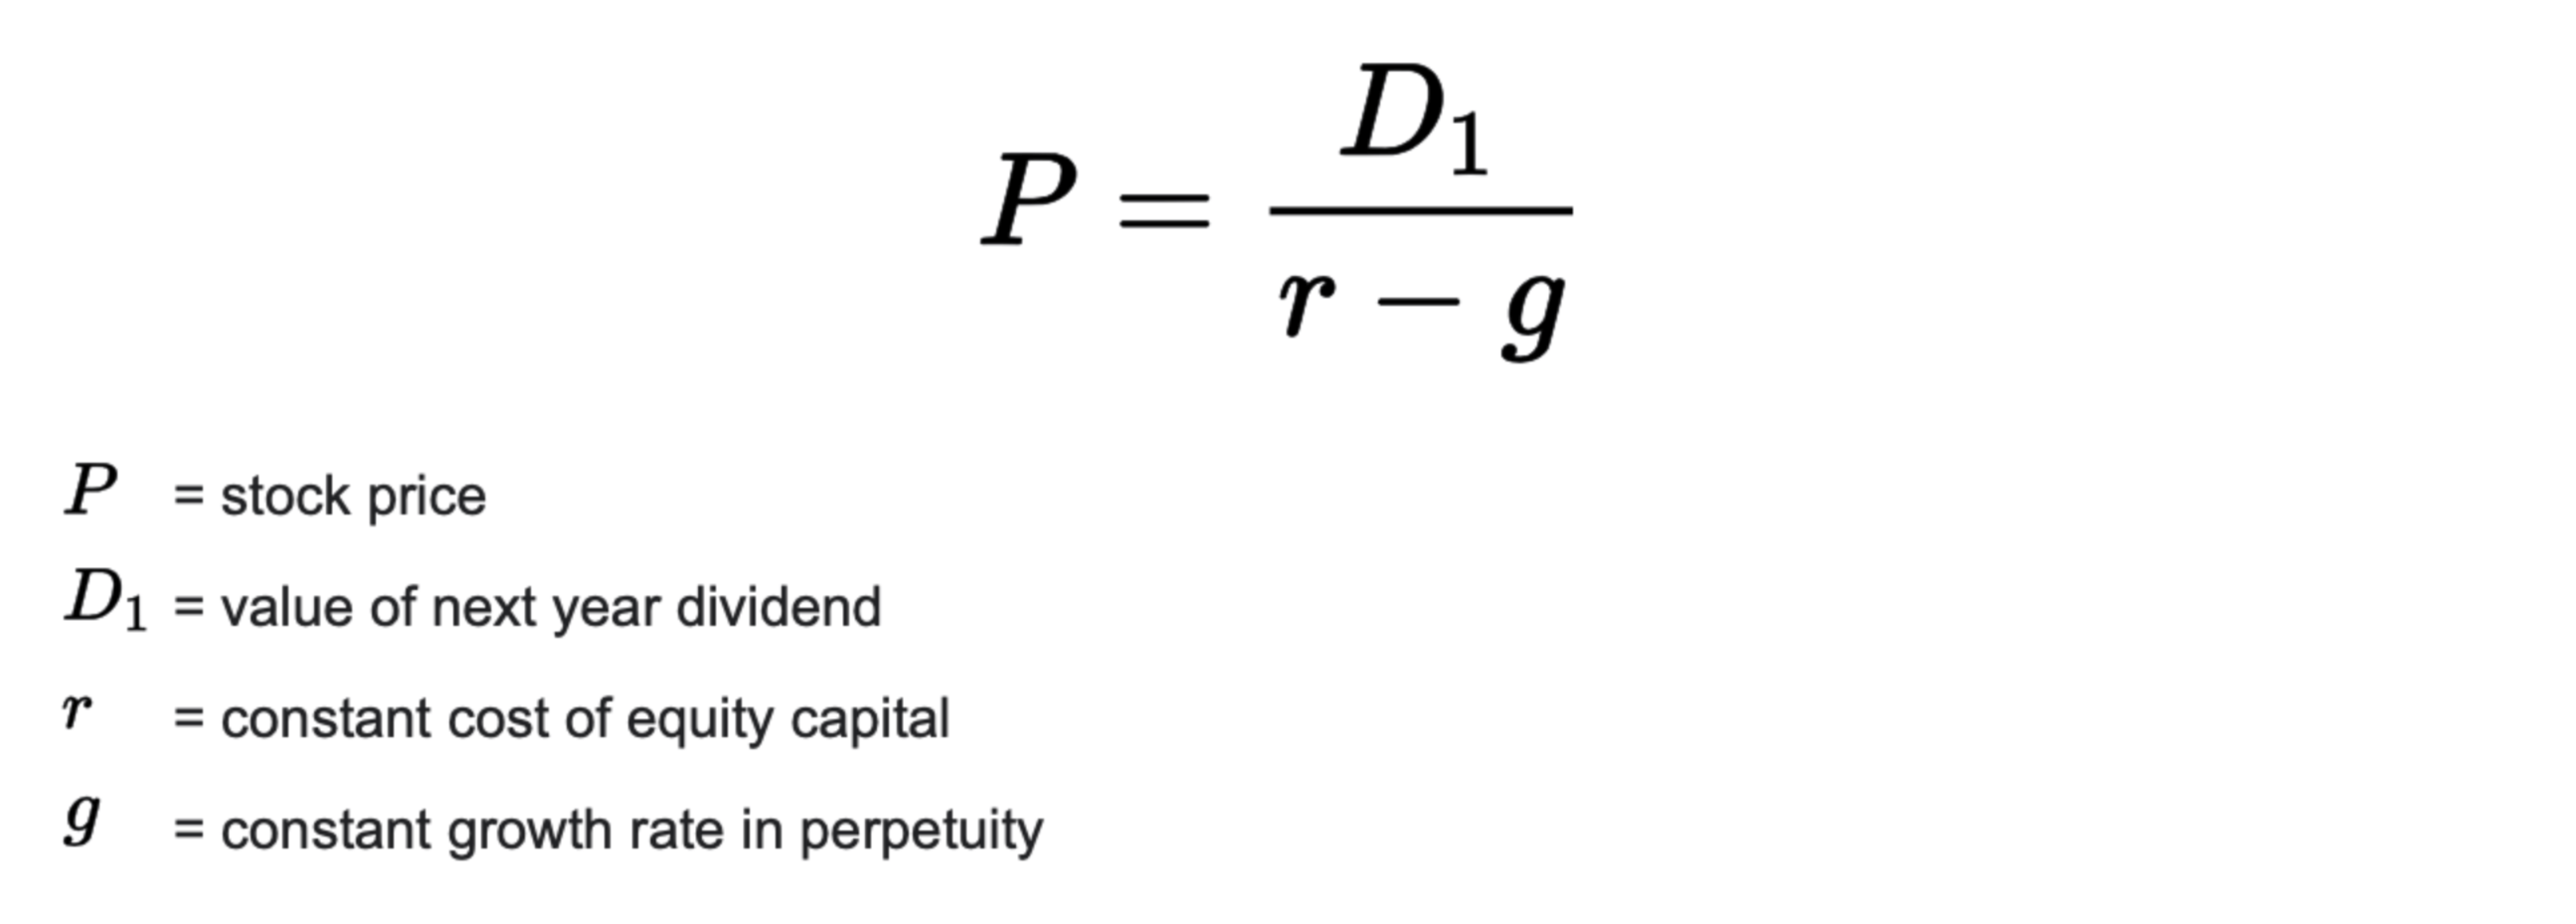
In order to determine a fair value, we have to make two assumptions:
- What is our required rate of return?
For the required rate of return, we usually like to use the weighted average cost of capital (‘WACC’) of the firm. The WACC of AT&T is in the range of 7% to 8.3%.
WACC (Finbox.com)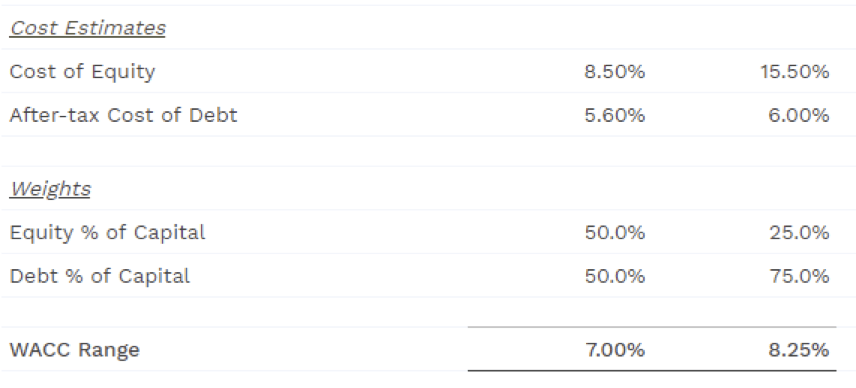
To stay relatively conservative in our analysis, we will be using a required rate of return from the higher end of this spectrum, 8%.
2. What is a reasonable assumption for the stable and constant dividend growth rate in perpetuity?
The following table summarizes the dividend growth rate for several different periods. In our opinion, these figures may not be the most representative because of the recent dividend cut in 2021.
Dividend growth (Seekingalpha.com)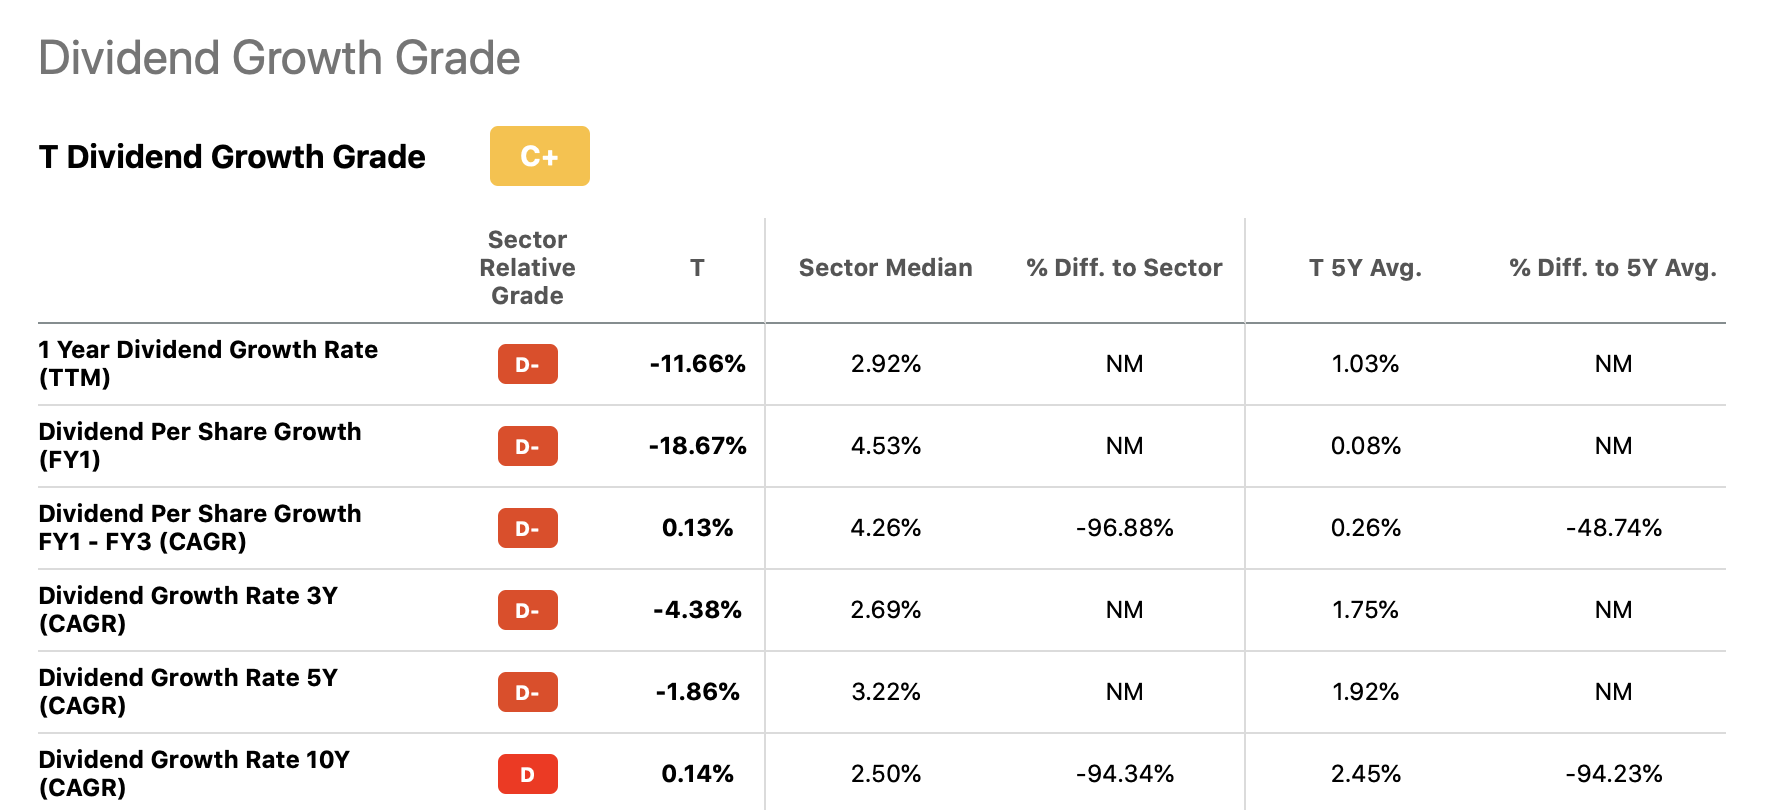
Between 2010 and 2020, the dividend has increased by an average of about 2%, we will be using it as our most likely case. However, to account for uncertainty, we will conduct our analysis using a range of 1% to 3%.
Results (Author)
As the stock is currently trading around, $21 per share, it is in the upper end of our fair value range. Although T may be fairly valued, based on this measure, the stock is not likely to offer significant upside potential.
Let us see, what the justified P/E ratio of the stock could be.
Justified price-to-earnings ratio
Price multiples are often given little weight, as many claim that it is a backward looking measure. However, using the Gordon Growth Model, present value calculations could be combined with the P/E ratio, resulting in the so-called justified P/E.
The following formula is the basis for our evaluation.
Justified P/E (Corporatefinanceinstitute.com)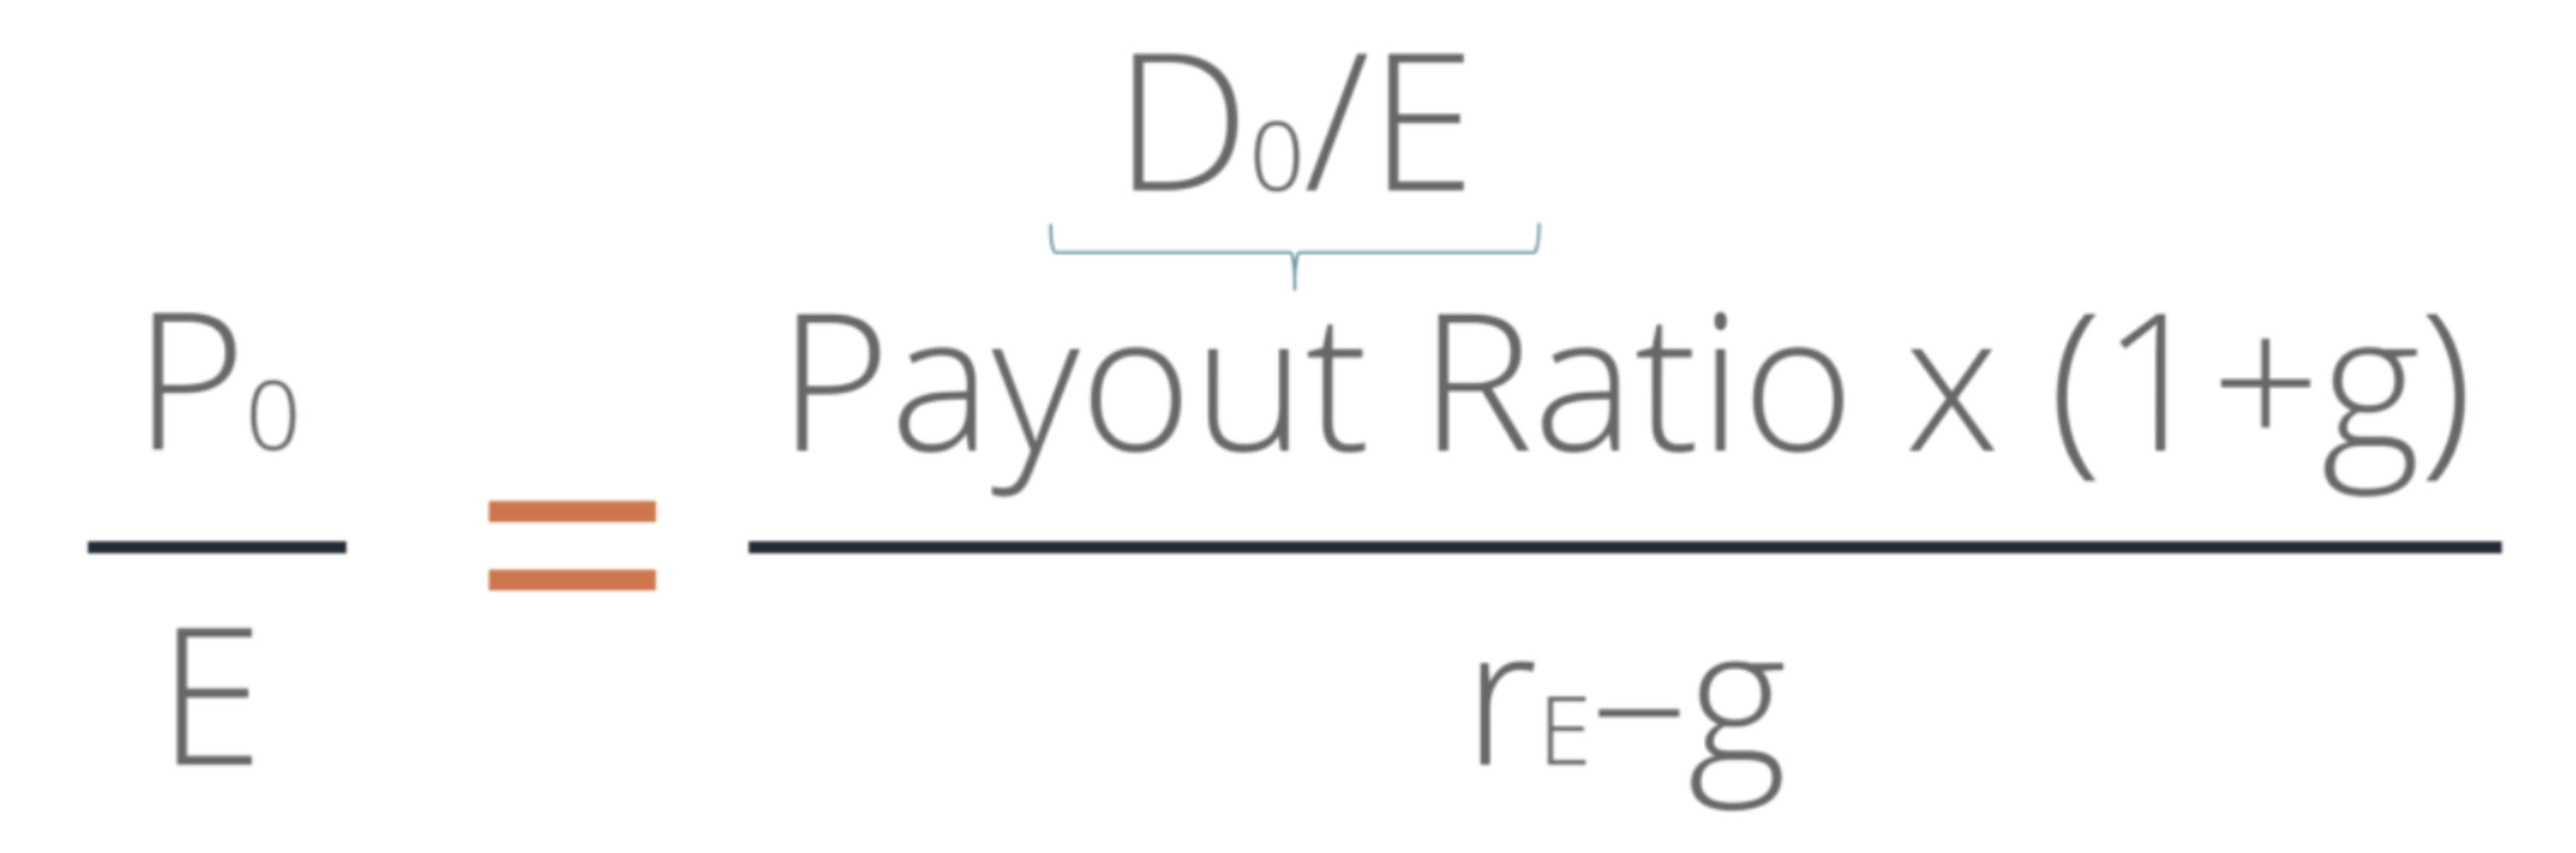
For this calculation, we will keep the previous established assumptions of required rate of return and dividend growth. However, to proceed further, we have to define a reasonable range of dividend payout ratios, which could be sustained in perpetuity.
Dividend payout (Seekingalpha.com) Dividend payout (Seekingalpha.com)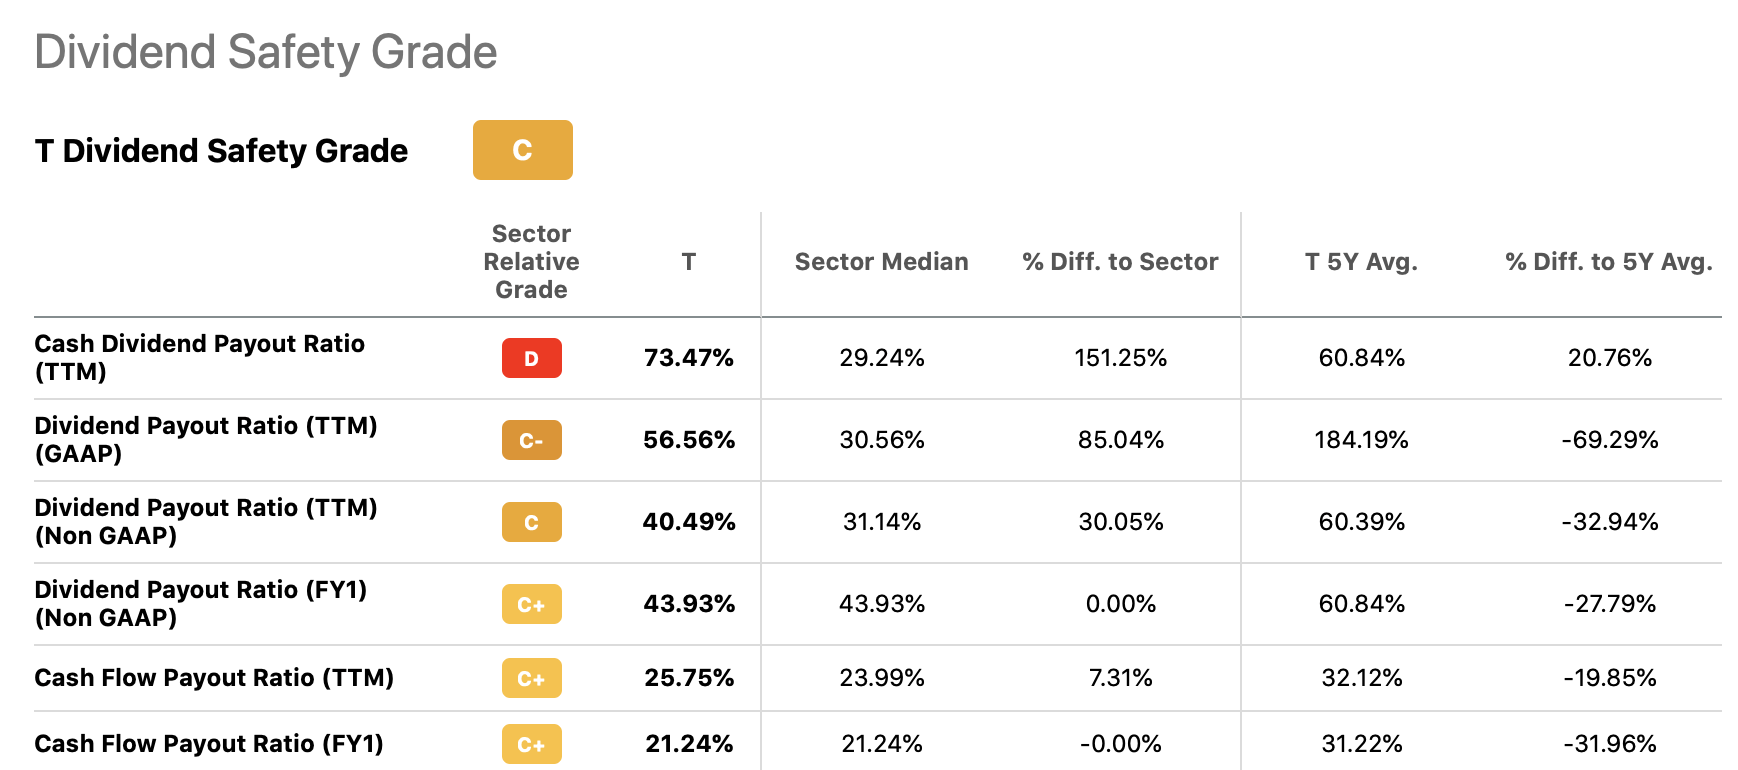
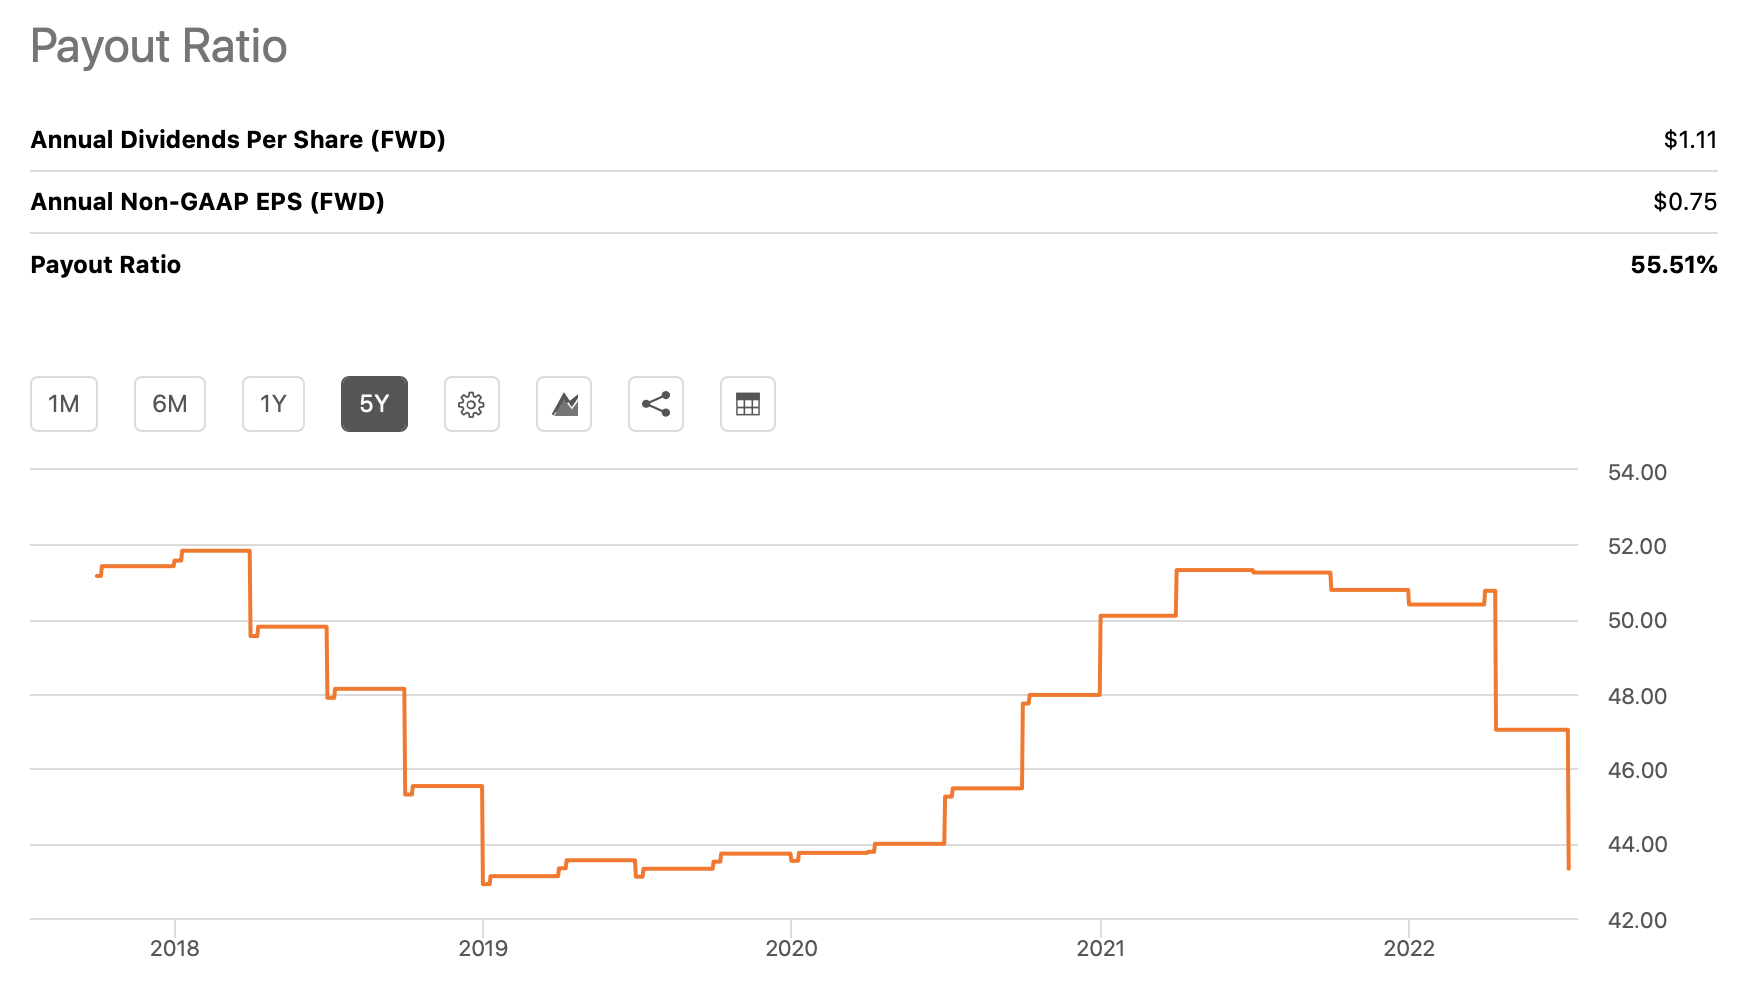
By looking at the historic dividend payouts of AT&T, a payout ratio between 40% to 55% seems to be appropriate.
The following table summarizes the justified P/E ratios for AT&T’s stocks using our assumptions.
Results (Author)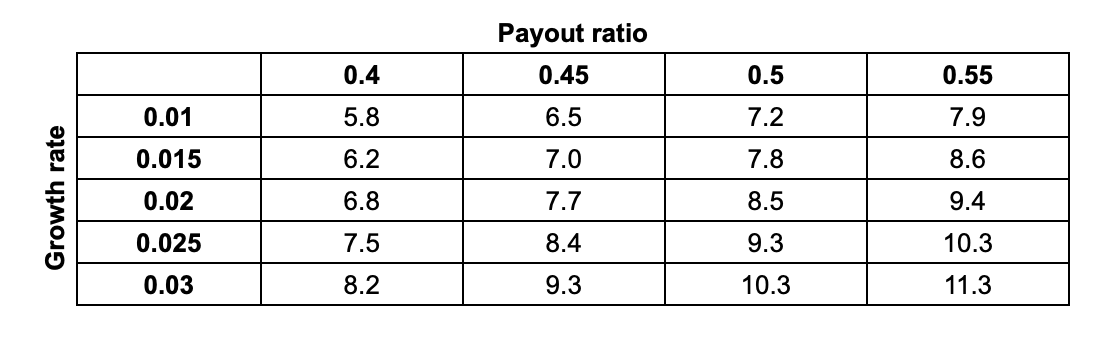
AT&T has a P/E ratio (‘TTM’) of about 6.2x and a P/E ratio (‘FWD’) about 8.1x. Based on our calculation, the justified P/E ratio is estimated to be in the range of 5.8x to 11.3x, meaning that there could be some upside potential for the stock.
Key takeaways
AT&T’s stock has historically underperformed or performed in line with the broader market during times of low consumer confidence. Although, the stock has so far performed better than the SPY in 2022, we believe further downside risk may be ahead.
Because of AT&T’s long history of growing dividend payments, the stock is a suitable candidate to be valued using the Gordon Growth Model, which can also help to establish a justified P/E ratio.
Based on the GGM and the justified P/E, AT&T’s stock currently looks fairly valued or slightly undervalued.
For these reason, our rating on T is currently “hold“.
Be the first to comment