

Pgiam/iStock via Getty Images
Strategy Shares NASDAQ 7 HANDL Index ETF (NASDAQ:HNDL) claims to be a first-of-its-kind target distribution exchange traded fund (“ETF”) designed to pay investors a consistent monthly distribution and aims a payout of 7 percent. Such a yield is quite attractive in the current low-interest-rate environment, with long-term U.S. Treasuries generating a yield below 2 percent. However, delivering such a yield on a consistent basis for an ETF which has huge investments in fixed income securities raises certain doubts. I’d like to understand whether such a distribution is sustainable in the long run.
Strategy Shares Nasdaq 7HANDL™ Index ETF
Strategy Shares NASDAQ 7 HANDL Index ETF was formed by Strategy Shares on January 16, 2018 and is domiciled in the United States. This ETF is a fund of funds, and invests in funds which invest in public equity and fixed income markets of the United States. For its equity portion, it invests in funds which invest in stocks of mid-cap and large-cap companies in diversified sectors. More than 30 percent of the entire portfolio is invested in large cap stocks, while 14 percent is invested in mid-caps.
For its fixed income portion, it invests in funds which invest in U.S. aggregate bonds of any maturity or duration that are rated higher than BBB- by S&P. HNDL fully replicates the performance of the Nasdaq 7HANDL™ Index. The ETF has adopted a policy to pay monthly distributions on Fund shares at a target rate that represents an annualized pay-out of approximately 7 percent on the Fund’s per-share net asset value (NAV). All or a portion of a distribution may consist of a return of capital from the original investment and the distribution rate may be modified at any time.
HNDL’s Investment Strategy
According to the company’s factsheet, the index consists of ETFs that are split into a Core Portfolio and a Dorsey Wright Explore Portfolio. The Core Portfolio consists of a 70 percent allocation to U.S. aggregate fixed income ETFs and a 30 percent allocation to U.S. large cap equity ETFs. The Dorsey Wright Explore Portfolio consists of an allocation to ETFs in various U.S. asset categories that have historically provided high levels of income, using a tactical asset allocation methodology developed in consultation with Nasdaq Dorsey Wright Investment Research & Analysis that seeks to incorporate momentum, yield and risk. This index of 19 ETFs represents an estimated 20,000 individual underlying securities.
HNDL website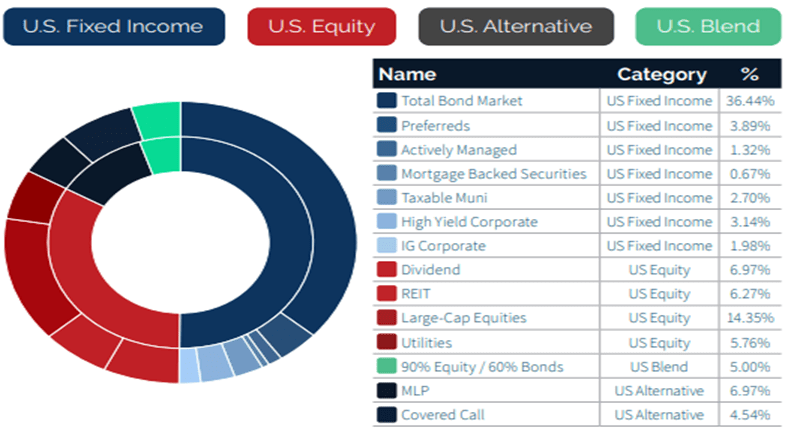
The Nasdaq 7HANDL™ Index represents an allocation to a balanced portfolio of U.S. equities, bonds and alternative investments that employs leverage in an amount equal to 23 percent of the portfolio. Managers of the fund utilize leverage as a means of boosting return. The index is broadly diversified and seeks to offer the potential for high monthly distributions while maintaining a stable net asset value over time. As a result, HNDL’s investors can expect a consistent monthly distribution with a high yield for the time being. However, HNDL will have risk characteristics similar to the broad U.S. capital markets and will generally rise and fall with prevailing market conditions.
HNDL’s Portfolio
More than 60 percent of HNDL’s funds are invested in 7 funds, namely Vanguard Total Bond Market ETF (BND), SPDR Portfolio Aggregate Bond ETF (SPAB), iShares Core U.S. Aggregate Bond ETF (AGG), Invesco QQQ ETF (QQQ), Alerian MLP ETF (AMLP), Utilities Select Sector SPDR ETF (XLU), Vanguard Dividend Appreciation ETF (VIG). Another 10 percent of HNDL is held in cash. Thus, the performance of these seven ETFs will primarily drive the performance of HNDL. Unfortunately, these seven ETF combined doesn’t project a rosy picture. HNDL also has a much higher gross expense ratio of 1.12 percent, which eats out the return to its investors. This expense ratio is higher than those of comparable ETFs, such as 0.8 percent of that of First Trust Multi-Asset Diversified Income Index Fund (MDIV).
XLU delivered double digit price growth for most of the time, with a yield of more than 3 percent. VIG also had similar growth in the range of 10 to 15 percent, but with a yield less than 2 percent. AGG, BND and SPAB had a negative price growth for the past 10 years and generated a yield of less than 3 percent. AMLP has been generating a yield of almost 8 percent, but the price growth has been negative. Only QQQ generated huge price growth in the range of 25 to 30 percent in the medium and long run. However, in 2022 the fund has lost almost 18 percent of its value. Moreover, the fund has a negligible yield of just 0.5 percent.
Investment Thesis
Strategy Shares Nasdaq 7HANDL™ Index ETF is heavily invested in seven ETFs, which deliver mixed performance. XLU, VIG and QQQ generated impressive price growth, which had been wiped away by the negative price performance of AMLP, AGG, BND and SPAB. When it comes to yield, only AMLP generates sufficient yield. All other funds had a yield between 0.5 to 3 percent. Thus, it is quite clear that HNDL is paying a dividend out of its capital. This should not be surprising, as the fund has a stated policy of distributing a part of the dividend out of its capital.
The fund may also modify its distribution rate at any point of time. In absence of any price growth, this Fund of Funds will become unattractive. For the past 4.5 years, the fund has failed to generate positive price growth. The only good thing is that most ETFs it has invested in pay monthly distribution. However, this distribution may not be sustained in the long run due to HNDL’s policy of paying out dividends out of its capital. Thus, despite such a strong yield and monthly distribution, Strategy Shares Nasdaq 7HANDL™ Index ETF is better to be avoided.
About the TPT service
Thanks for reading. At the Total Pharma Tracker, we offer the following:-
Our Android app and website features a set of tools for DIY investors, including a work-in-progress software where you can enter any ticker and get extensive curated research material.
For investors requiring hands-on support, our in-house experts go through our tools and find the best investible stocks, complete with buy/sell strategies and alerts.
Sign up now for our free trial, request access to our tools, and find out, at no cost to you, what we can do for you.

Be the first to comment