

tupungato
Investment Thesis: Hilton Worldwide Holdings Inc. (NYSE:HLT) could see a rebound in upside from here as a result of potentially resilient revenue performance by the Waldorf Astoria hotel brand during the winter months.
In a previous article back in June, I made the argument that Hilton Worldwide Holdings might see downward pressure over the summer months This would be as a result of a downturn in demand across China due to ongoing lockdowns earlier in the year, as well as travel disruptions over the summer months as flight cancellations became an issue due to a sudden rebound in demand.
While the stock did show some resilience over the summer months, Hilton Worldwide Holdings is down by just over 14% since my last article:
NYSE:HLT chart by TradingView as displayed on Seeking Alpha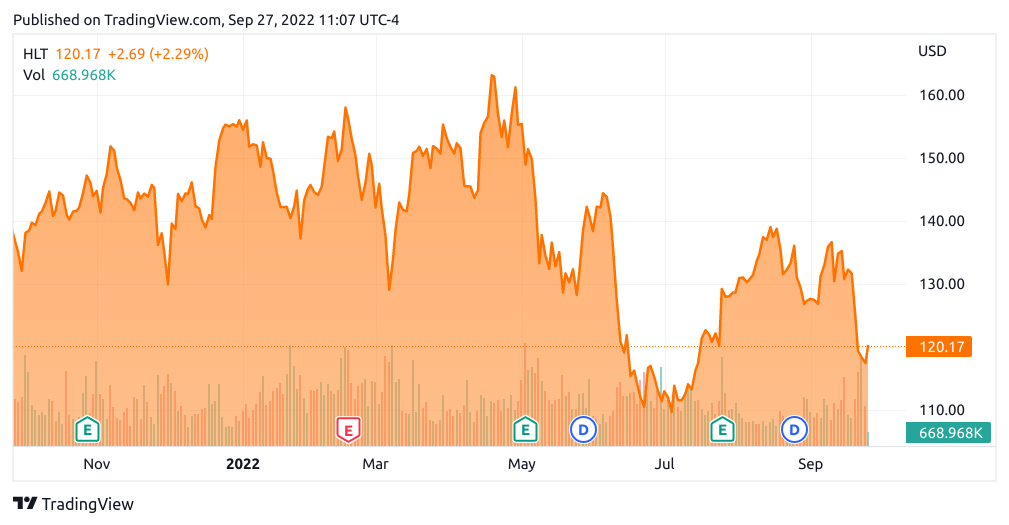
The purpose of this article is to further analyze Hilton’s RevPAR (revenue per available room) performance across Hilton’s hotel brands – and determine whether there could be a case for a rebound in upside from here.
Seasonality of RevPAR (revenue per available room)
When it comes to the hotel industry, the traditional line of thinking is that seasonal demand tends to peak in the summer and decline in the winter months.
However, an analysis of RevPAR trends across Hilton’s hotel brands suggests that this may not necessarily be the case across all brands. Particularly, it could be the case that luxury brands which cater to less price-sensitive customers may still see robust demand in the winter months.
Here is the average RevPAR by hotel brand for Hilton Worldwide Holdings from Q1 2019 to Q2 2022 (the RevPAR figures were sourced from historical quarterly reports and the average RevPAR by brand was calculated using SQL – original calculations can be found here).
| Brand | Average RevPAR from Q1 2019 to Q2 2022 |
| Tru by Hilton | 65.58 |
| DoubleTree by Hilton | 66.54 |
| Tapestry Collection by Hilton | 69 |
| Canopy by Hilton | 70.26 |
| Hampton by Hilton | 71.26 |
| Hilton Garden Inn | 72.57 |
| Home2 Suites by Hilton | 81.26 |
| Hilton Hotels & Resorts | 83.66 |
| Embassy Suites by Hilton | 90.71 |
| Homewood Suites by Hilton | 93.25 |
| Curio Collection by Hilton | 104.53 |
| Conrad Hotels & Resorts | 121.9 |
| Waldorf Astoria Hotels & Resorts | 214.83 |
Source: Average RevPAR calculated by author using SQL using data sourced from historical quarterly reports – Q1 2019 to Q2 2022.
It is interesting to note that brands at the opposite ends of the scale with respect to RevPAR appear to show different seasonality patterns.
For instance, we can see that for the Tru by Hilton brand (which showed the lowest average RevPAR from Q1 2019 to Q2 2022), the highest RevPAR figures came in Q2 and Q3 – during the spring and summer months:
Figures sourced from previous Hilton Quarterly Reports. Heatmap generated by author using Python’s seaborn library.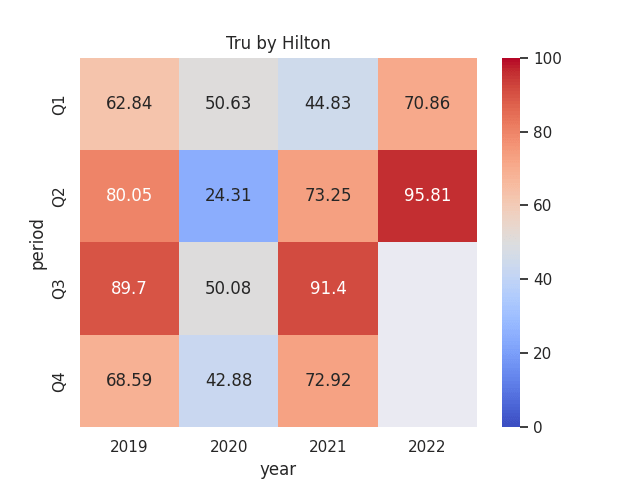
However, when analyzing RevPAR trends for the Waldorf Astoria Hotels & Resorts brand (which showed the highest average RevPAR from Q1 2019 to Q2 2022), the highest RevPAR figures were actually in Q1 and Q4 – the autumn and winter months:
Figures sourced from previous Hilton Quarterly Reports. Heatmap generated by author using Python’s seaborn library.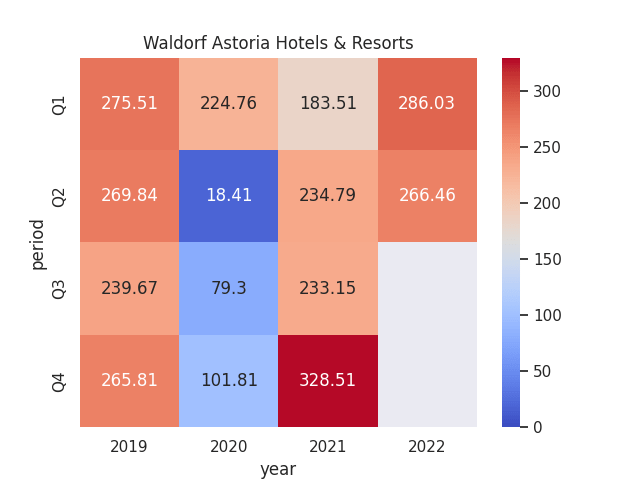
We can also see that while RevPAR was understandably down in 2020 as a result of the COVID-19 pandemic – RevPAR in Q4 2021 actually exceeded levels achieved during any quarter in 2019.
This data is encouraging, as it seems to suggest that Hilton Worldwide Holdings is in a good position to bolster revenues across the Waldorf Astoria Hotels & Resorts brand during the winter months. This would make up for the drop in RevPAR across its lower-priced brands – which include more price-sensitive customers and appear to be more sensitive to seasonal trends (i.e., see less booking demand in the winter months).
In this regard, should we see an uptick in RevPAR for the Waldorf Astoria brand during the winter months in spite of higher inflation – then I would see this as a catalyst for potential upside, as it would indicate that the hotel chain as a whole is able to withstand seasonal dips in revenue across its other brands.
Valuation and Risks
When comparing the P/E ratio for Hilton Worldwide Holdings for Q1 2019 and Q2 2022, we can see that the stock traded at a lower P/E ratio in the most recent quarter as compared to Q1 2019 – which indicates that the stock may be trading at a more attractive price relative to earnings at the current time.
| Quarter | Price | Earnings per share (diluted, three months ended) | Quarterly P/E Ratio |
| Q1 2019 | 83 | 0.54 | 153.7 |
| Q2 2022 | 113 | 1.32 | 85.6 |
Source: Price figures sourced from investing.com (end of March 2019 and end of June 2022). Earnings per share figures sourced from Hilton Worldwide Holdings Q1 2019 and Q2 2022 Earnings Releases. P/E Ratio calculated by author.
The main risk for Hilton Worldwide Holdings at this time is that the prospect of an inflationary-induced recession potentially leads to a decline in booking demand across higher-end brands as well. In addition, investors may still tread cautiously with stocks in the travel industry as a whole – and we could see the stock decline further in the short to medium term, even if revenue performance remains strong. Additionally, inflation is also likely to place further pressure on Hilton’s cost base – meaning that the company will need to continue seeing strong revenue growth to bolster earnings in the face of rising costs.
With that being said, the company has been seeing an encouraging rebound in earnings overall – and has been able to significantly reduce its net debt relative to earnings.
For instance, Hilton’s net debt to adjusted EBITDA ratio for Q2 2022 was 3.5x. This is significantly down on the ratio of 8.7x as seen in Q4 2020, and just slightly higher than the ratio of 3.2x seen in Q1 2019. In this regard, investors are likely to be encouraged by the fact that earnings have been rising significantly to cover net debt, and a continued long-term reduction in this ratio could be a catalyst to push the stock higher.
Conclusion
To conclude, Hilton Worldwide Holdings has seen encouraging revenue growth and a reduction in net debt to adjusted EBITDA.
While the stock might see some market-related downside due to recessionary fears – I take the view that continued strong revenue performance for the Waldorf Astoria brand during the winter months could be a catalyst for longer-term upside in 2023 – and a relatively lower P/E ratio in the most recent quarter as compared to Q1 2019 indicates that the stock could be trading at attractive value relative to earnings.
Additional disclosure: This article is written on an “as is” basis and without warranty. The content represents my opinion only and in no way constitutes professional investment advice. It is the responsibility of the reader to conduct their due diligence and seek investment advice from a licensed professional before making any investment decisions. The author disclaims all liability for any actions taken based on the information contained in this article.
“Editor’s Note: This article was submitted as part of Seeking Alpha’s best contrarian investment competition which runs through October 10. With cash prizes and a chance to chat with the CEO, this competition – open to all contributors – is not one you want to miss. Click here to find out more and submit your article today!”
Be the first to comment