

Darren415
This article was first released to Systematic Income subscribers and free trials on Oct. 4.
Recent market volatility has opened up discount valuation divergences between very similar CEFs. This offers income investors an opportunity to pick up additional yield, adopt a more defensive stance and generate alpha in their portfolios. In this article we highlight a number of switches in the High-Yield, Multisector and Preferred CEF sectors. The funds we highlight are not only attractive as switch choices but also attractive on their own terms.
Relative Value Rotation Recap
CEF switches or relative value rotations, as we call them, are a way for investors to get exposure to assets they may be already holding at a cheaper valuation. The point isn’t to find the fund with the widest discount or to find the “cheapest” fund there is but to provide the same type of allocation investors are already comfortable with but at a better price.
Relative value rotations have a number of advantages for income portfolios. First, they can provide an additional margin of safety in the portfolio by providing exposure to very similar assets as other funds but at a cheaper valuation. Periods of market weakness tend to see significant weakness in high premium funds while funds already trading at cheaper valuations tend to be more resilient.
Second, relative value rotations can enhance portfolio yield by giving investors access to very similar assets but at a greater discount. The wider the discount, the higher the yield on the same set of assets, all else equal.
Third, relative value rotations can deliver alpha – or an additional return over and above a static allocation.
Finally, switching into a similar but more attractively valued fund can also provide tax-loss harvesting opportunities, particularly relevant after a significant drawdown this year.
What To Watch Out For
Relative value switches might seem obvious, however, there are a number of things to watch out for.
First, relative value switches make most sense for a pair of very similar funds. For instance it makes a lot of sense to look at relative value in the PIMCO taxable suite where there are a lot of similar funds than to seek relative value between a BlackRock Municipal fund and a Nuveen Preferred fund.
Second, investors should keep in mind the fair-value of discounts. This is because some funds carry higher management fees than other similar funds. In this case the higher management fee fund deserves a wider discount which offsets the lower level of income going to investors. In other words, just because fund A is trading at a wider discount than fund B it doesn’t make fund A more attractive. Fund B could still be more attractive if its tighter discount does not fully reverse the benefit of its lower fee.
Third, this may sound obvious but investors should keep an eye on any fund’s absolute and risk-adjusted total NAV returns over time. Valuation is an important component of CEF allocation; however, the last thing investors should aim for is to get stuck with a portfolio of value traps.
Current Opportunities
In this section, we highlight a number of relative value opportunities in the current CEF market. Specifically, we identify a pair of pretty similar funds – those holding fairly similar assets, often managed by the very same manager with a similar mandate – whose valuations have diverged from its historic pattern.
In the High Yield sector we prefer the Credit Suisse High Yield Bond Fund (DHY) over the Credit Suisse Asset Management Income Fund (CIK). We made this rotation in our High Income fund earlier. Both funds have been standout performers in the sector, besting the sector by 2% and 1% per annum over the last 5 years in total NAV terms.
As the chart below shows CIK has moved up to an unusually tight discount relative to DHY with the differential between the two growing to 10%.
Systematic Income CEF Tool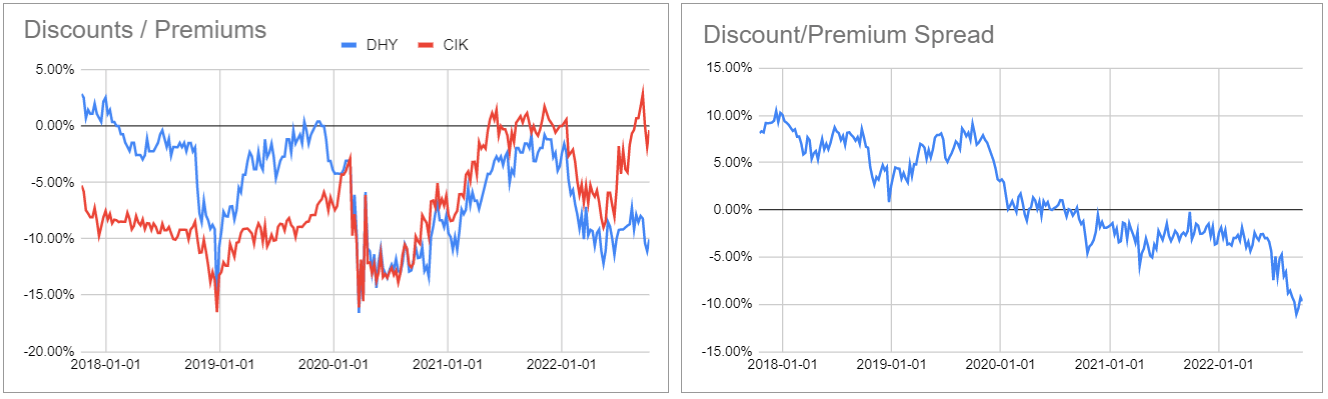
CIK should indeed trade at a tighter discount than DHY (as well as versus the sector) due to its unusually low management fee, however, at this point DHY can deliver a higher level of yield despite its higher fee due to its significantly wider discount. DHY is trading at a 10% discount and a 10.4% current yield.
We can see this in the yield disaggregation chart below which shows that DHY can deliver a nearly 0.4% higher yield at the current discount even though it does carry a higher management fee than CIK.
Systematic Income CEF Tool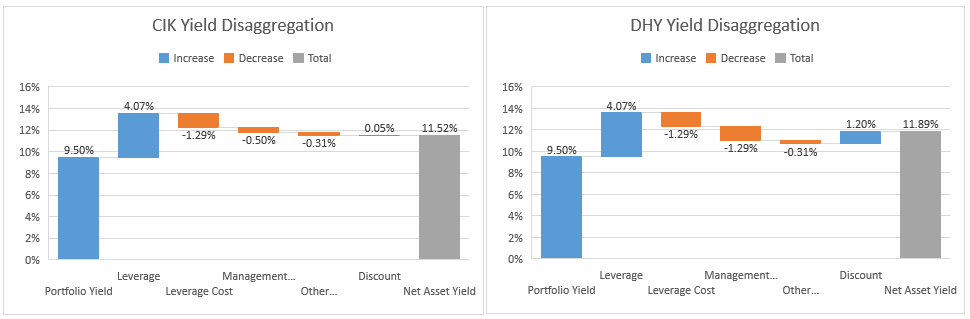
We find CIK a very attractive allocation when its discount trades near the sector average – a level which allows it to generate a significantly higher level of yield for investors owing to its low fee, all else equal. For more analysis have a look at the earlier article on CIK.
In the Preferreds sector we like the Limited Duration Preferred & Income Fund (LDP) over the Tax-Advantaged Preferred Securities & Income Fund (PTA).
We continue to find the Cohen & Steers family of preferreds CEFs very attractive in this environment due to their interest rate hedges and lack of leverage mandate, something we discussed in our PTA article here.
LDP rarely trades at a wider discount than PTA but it is as of this writing. It is now at a 8.3% discount and a 8.75% current yield.
Systematic Income CEF Tool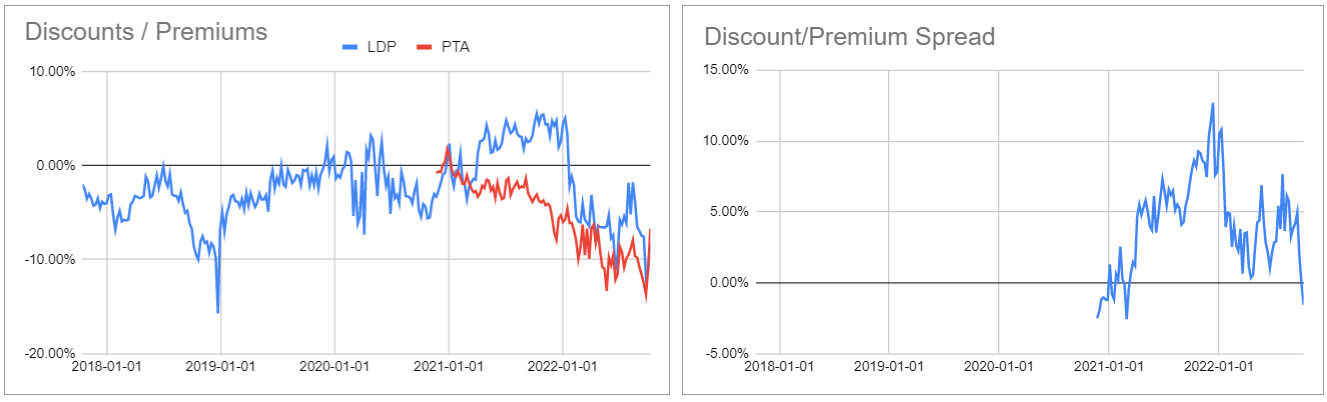
The yield disaggregation charts show that at the same level of leverage LDP generates a slightly higher level of yield. And although PTA does carry a higher leverage level at the moment, we would expect the two funds to normalize leverage levels in the future.
Systematic Income CEF Tool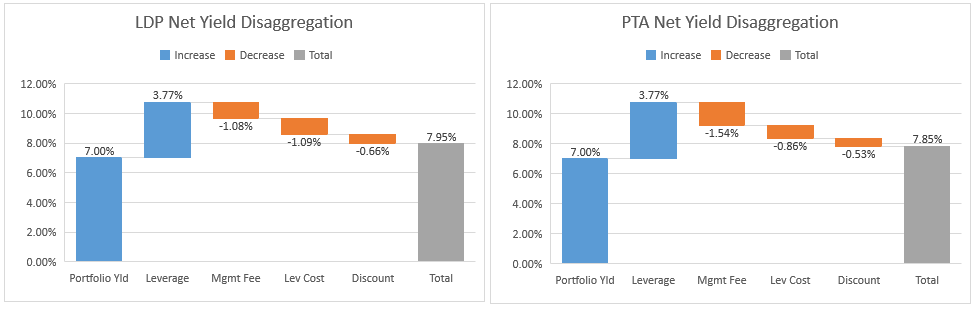
In the PIMCO taxable suite we like the PIMCO Dynamic Income Opportunities Fund (PDO) over the PIMCO Access Income Fund (PAXS). PAXS recently caught a bid by increasing its distribution which has caused its discount to tighten below that of PDO. Because of its higher management fee, PAXS should trade at a wider discount to PDO on a fair-value basis. PDO trades at a 7.6% discount and a 11.4% current yield.
The yield disaggregation chart below shows that PDO can generate a higher underlying yield for investors than PAXS owing to its lower fee and wider discount.
Systematic Income CEF Tool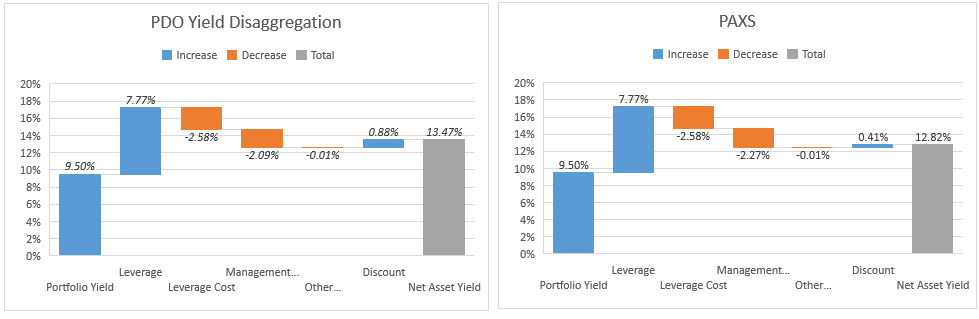
Finally, it’s important to mention that investors should also watch out for potential switches which can look compelling but are not in fact opportunities. One such idea is the switch between two Nuveen preferreds funds (JPS) and (JPI) which are fairly similar. The chart below shows that the two funds have tended to trade at a similar historic discount but have recently diverged with JPS moving out to a wider discount.
Systematic Income CEF Tool
What’s important to realize is that JPI is a term fund with an expected termination date in 2024. This will anchor its discount closer to zero than perpetual funds like the other 3 Nuveen preferreds funds. This term feature actually makes JPI more attractive in our view despite its tighter discount as it should generate a real performance tailwind into 2024 when the fund is likely to hold a tender offer at NAV as has happened with other Nuveen funds.
Takeaways
Recent volatility has pushed around discount valuations of pretty similar funds – a common dynamic which offers a number of attractive switch opportunities for CEF investors. Pursuing CEF rotations can provide additional margin of safety, while generating additional alpha and enhancing portfolio yield. This slow-but-steady focus on both defense and offense can keep income portfolio income levels and returns on a surer footing over the longer-term. The funds highlighted in this article are also worth a look on a standalone basis for investors who are not holding the more expensive fund of the pair.
Be the first to comment