

Gerville/iStock via Getty Images
There’s nothing controversial about the headline of this piece. It doesn’t take exceptional insight to come to the conclusion that a rate-sensitive sector like homebuilding would be adversely impacted by higher interest rates. Nonetheless, there are nuances in today’s real estate landscape driving an overly optimistic outlook, as reflected by the stock prices of homebuilders. What will unfold over the coming quarters will likely be far worse than what is priced in, and in this piece, I will explain why.
The basic argument for this adverse outlook is as follows: In the pandemic money-printing bonanza, homebuilders took on an excess of projects in reaction to abnormally high demand. These projects take time to complete, but they are now more than what can be absorbed by current levels of demand. And if that weren’t enough, the lengthening timeline to complete homes during the pandemic limited homebuilders’ ability to react to shifting trends in demand. And to compound the issue, as the economy weakens, demand will fall even further, and homebuilders will be left with inventory for which there will be no good options.
That’s a wrap, folks. If that’s all you need to short the iShares U.S. Home Construction ETF (BATS:ITB), you can stop here. If not, let’s get into the details.
As seen in the chart below, the inventory of new homes for sale has dramatically increased in the past two years, driven by a rapid increase in new home construction:
fred.stlouisfed.org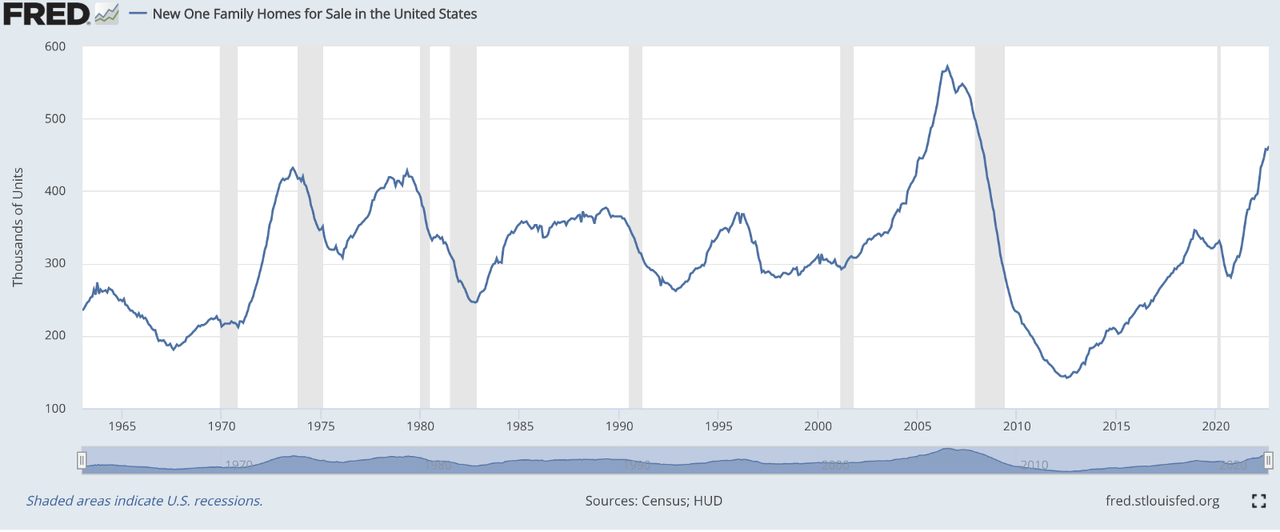
High inventories aren’t a bad thing in and of itself. It all depends on demand – the rate at which inventory is being absorbed. Up until Q2 of this year, the elevated levels of inventory were tracking with demand. But then, seemingly overnight, demand began to fall off while inventory continued to grow, as reflected in the below chart showing months of supply (new homes for sale/new homes sold), which spiked in Q2 and continued climbing in Q3 of 2022:
fred.stlouisfed.org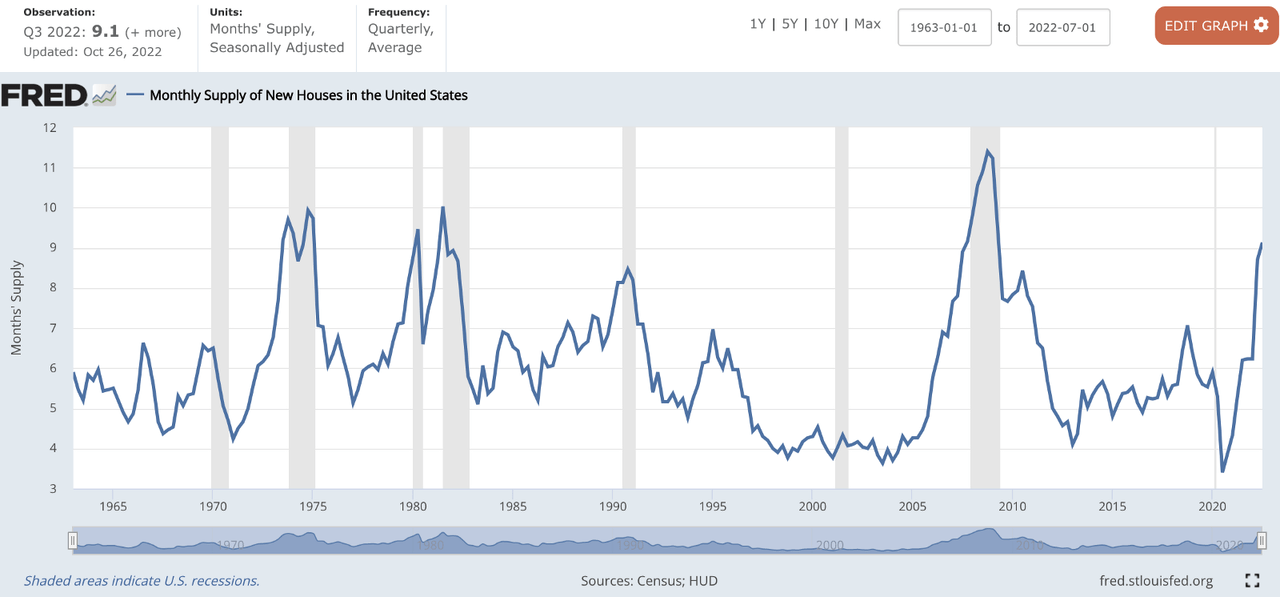
Every time this metric has climbed to current levels (above 9), a housing recession (and general economic recession) followed, but this time will likely be worse than usual.
Sidenote: This is largely the result of the nature of the monetary easing/tightening cycle of 2020-2022, one which has no historical parallel due to its magnitude in both directions over such a short window of time. It’s not surprising that homebuilders would have difficulty navigating this.
One reason it will be worse than usual is supply shows no sign of letting up. Units under construction hit an all-time high in September. While homebuilders know they’re beginning to have trouble selling finished homes, they still have a massive pipeline of new supplies on the way.
fred.stlouisfed.org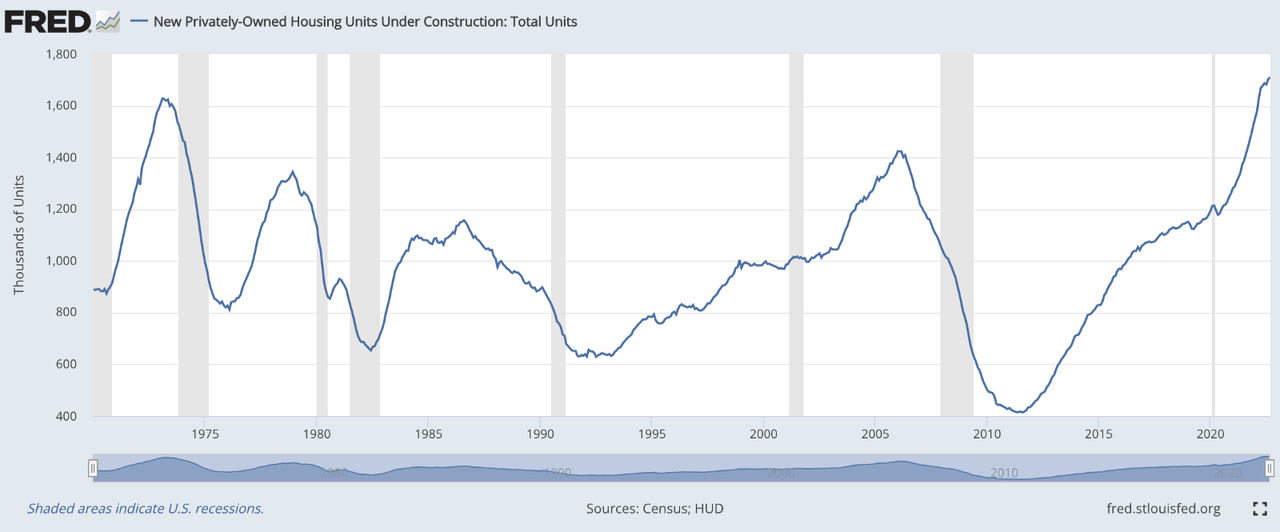
And while the outlook for supply doesn’t give much reason to be bullish, the outlook for demand looks far worse. As interest rates rise, mortgage payments have skyrocketed out of affordability for most Americans:
redfin.com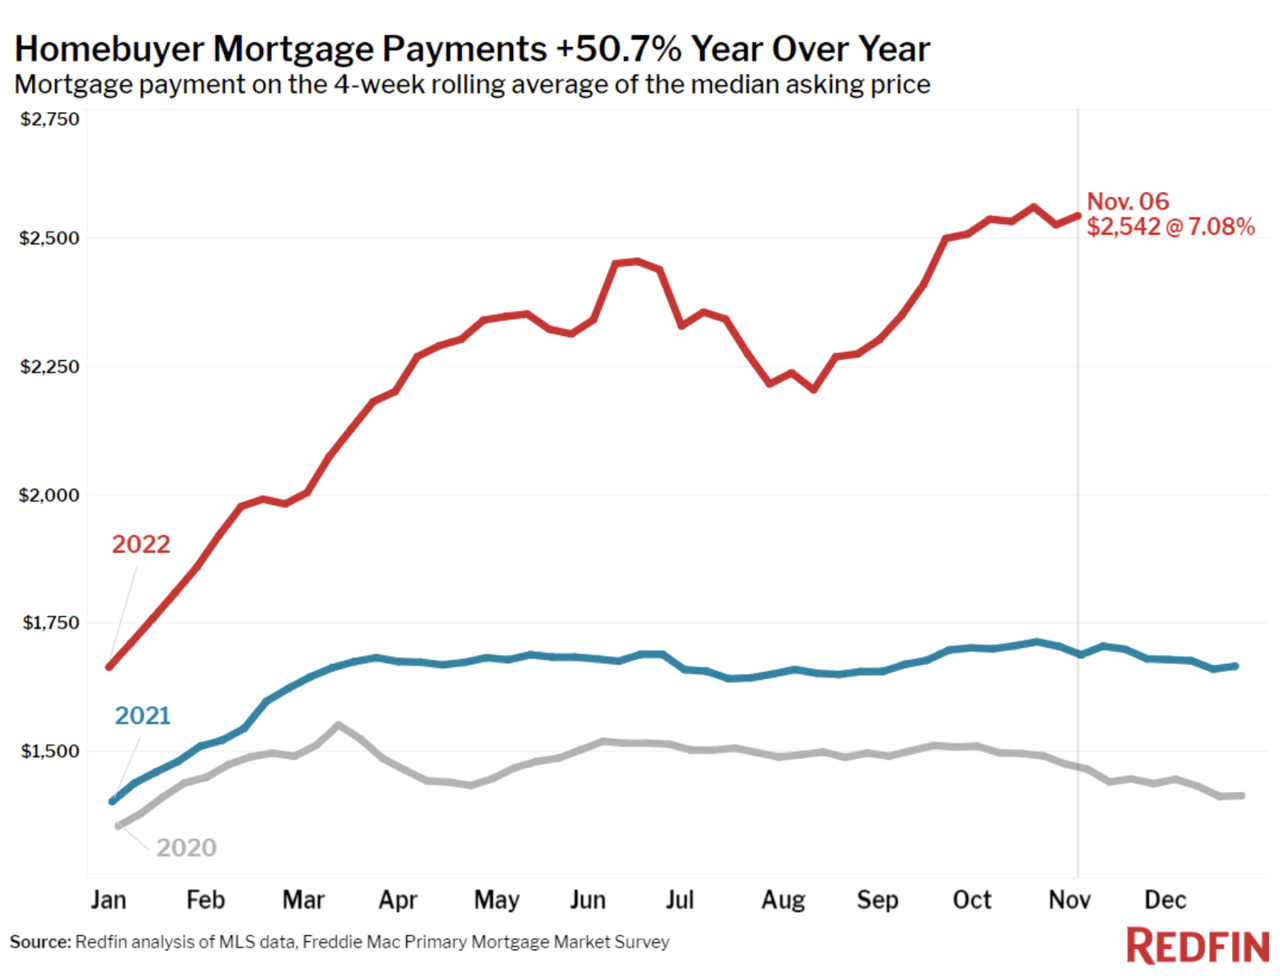
And mortgage applications have understandably fallen off a cliff in response:
tradingeconomics.com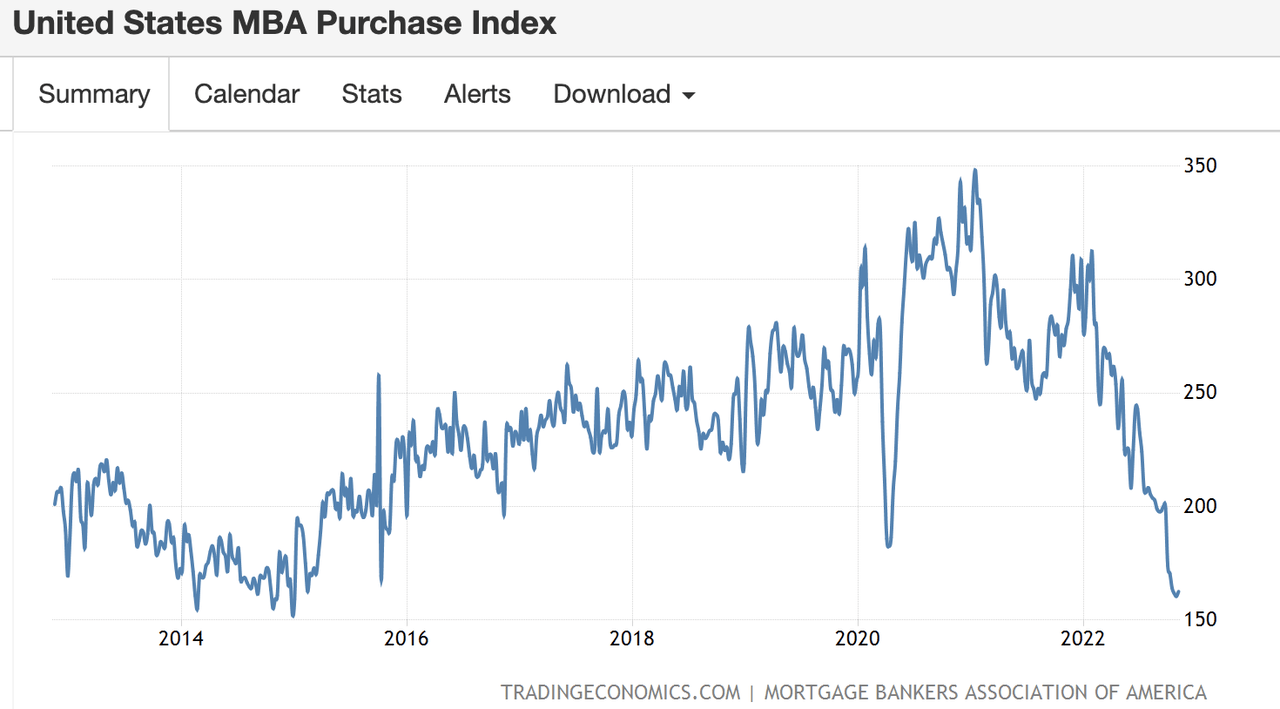
And this has all been despite us being in what is maybe the strongest labor market in history, one which has recently shown signs of easing as monetary tightening begins to kick in:
fred.stlouisfed.org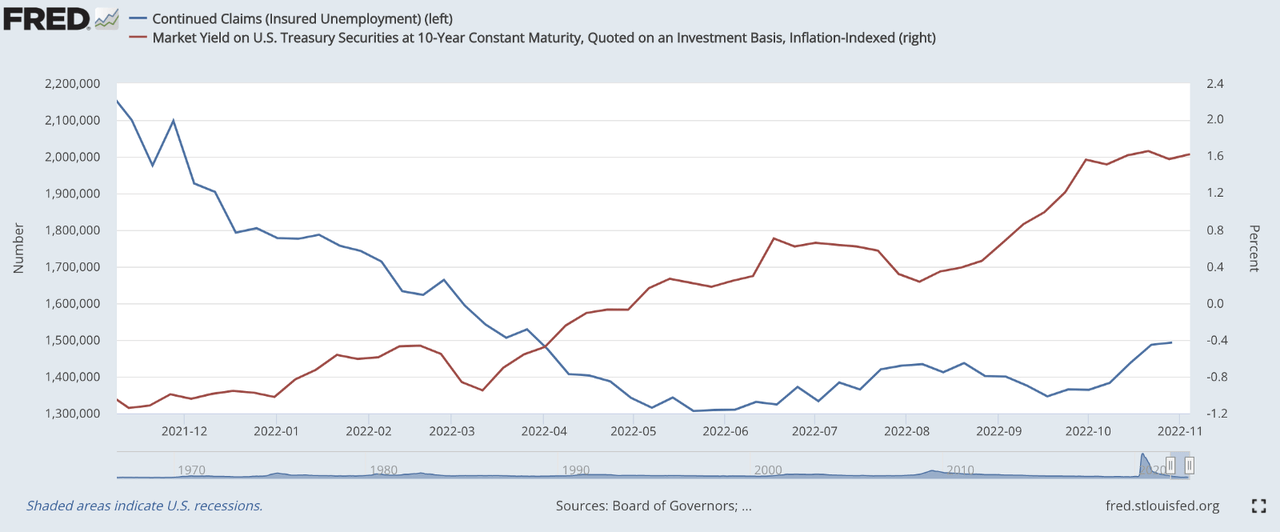
So with that backdrop, of both supply and demand showing worrying outlooks, why aren’t homebuilders crashing in value? Sure, they’re down about 25% from their peak, but they’re still comfortably above pre-pandemic levels and the drawdown has been nothing like the ones experienced in prior housing recessions:
google.com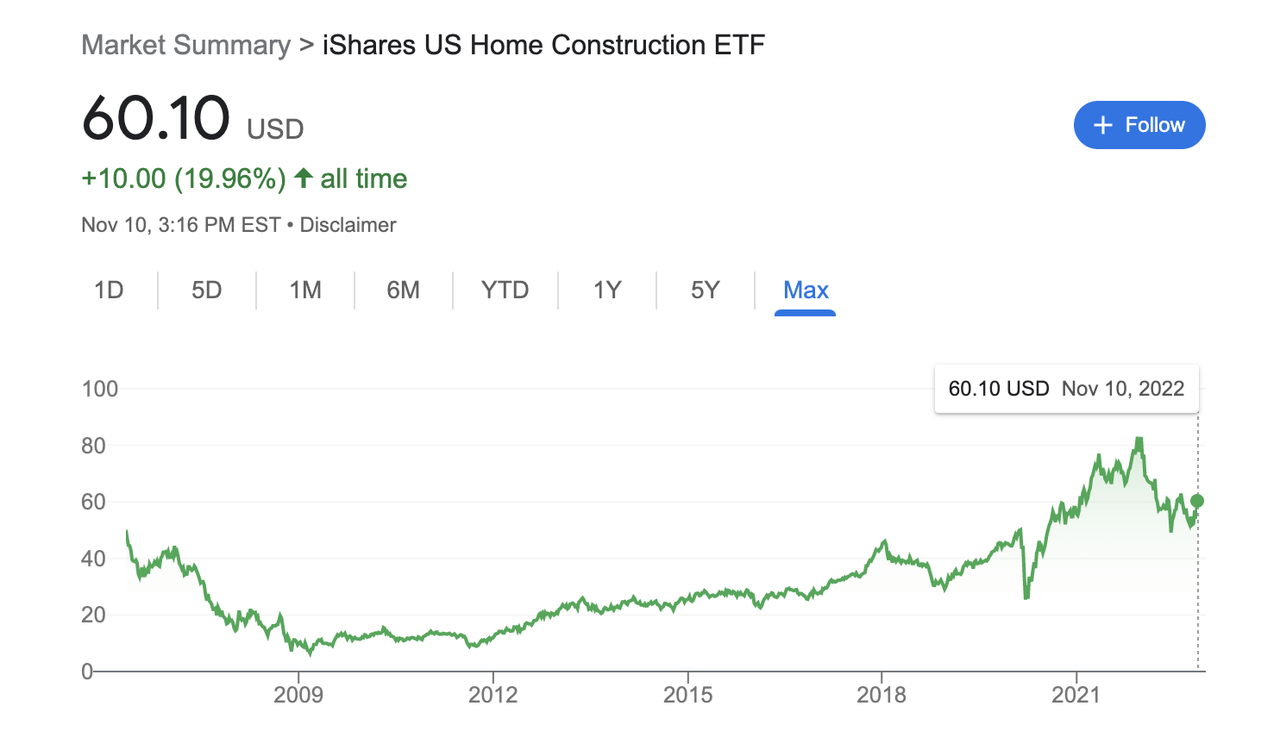
It’s certainly not reflective of how homebuilders themselves are feeling; an index of homebuilder confidence is down ~55% from its peak, despite us still having a strong labor market and growing economy:
tradingeconomics.com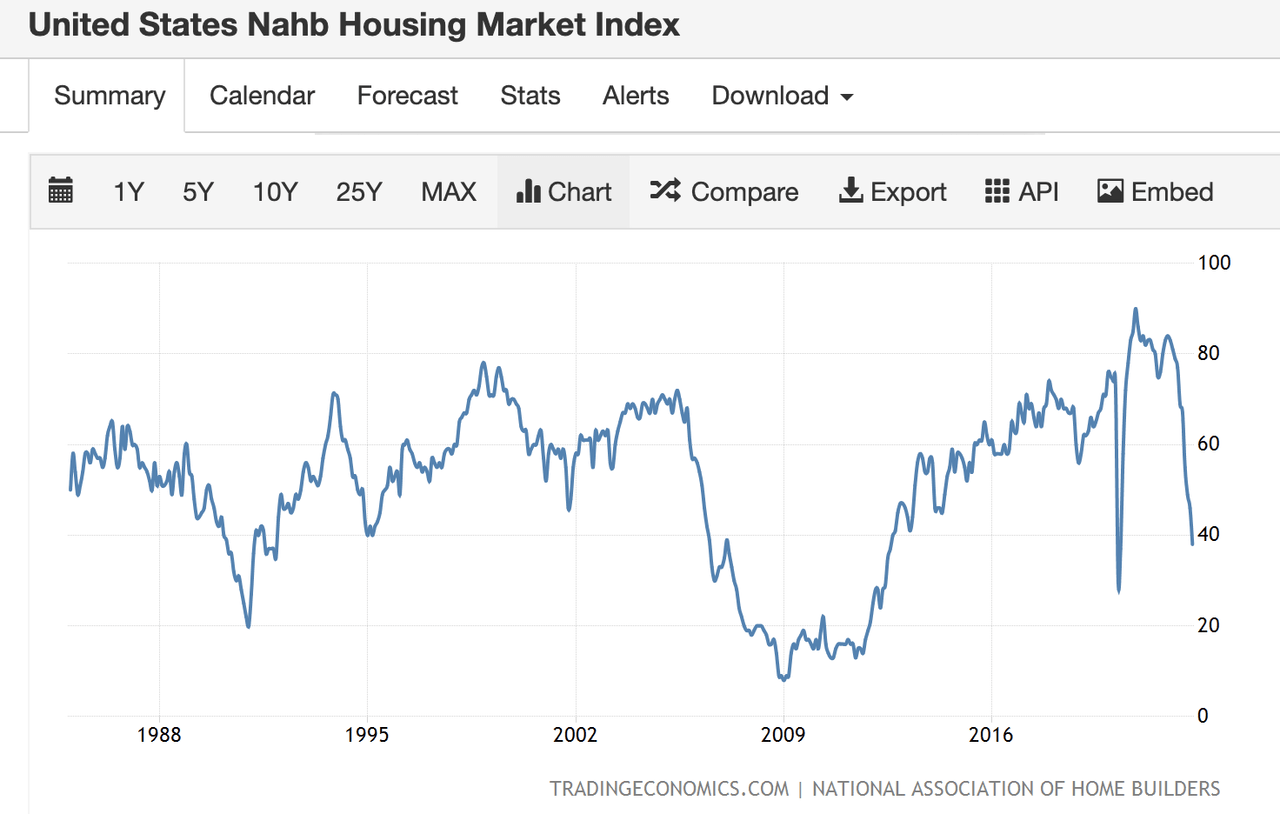
This can largely be explained by the chart below. In prior cycles, activity largely tracked with demand. As demand fell, homebuilding fell alongside it. This cycle is unique in that while demand is more than 40% below its peak, construction activity has yet to fall, giving the illusion of strength:
fred.stlouisfed.org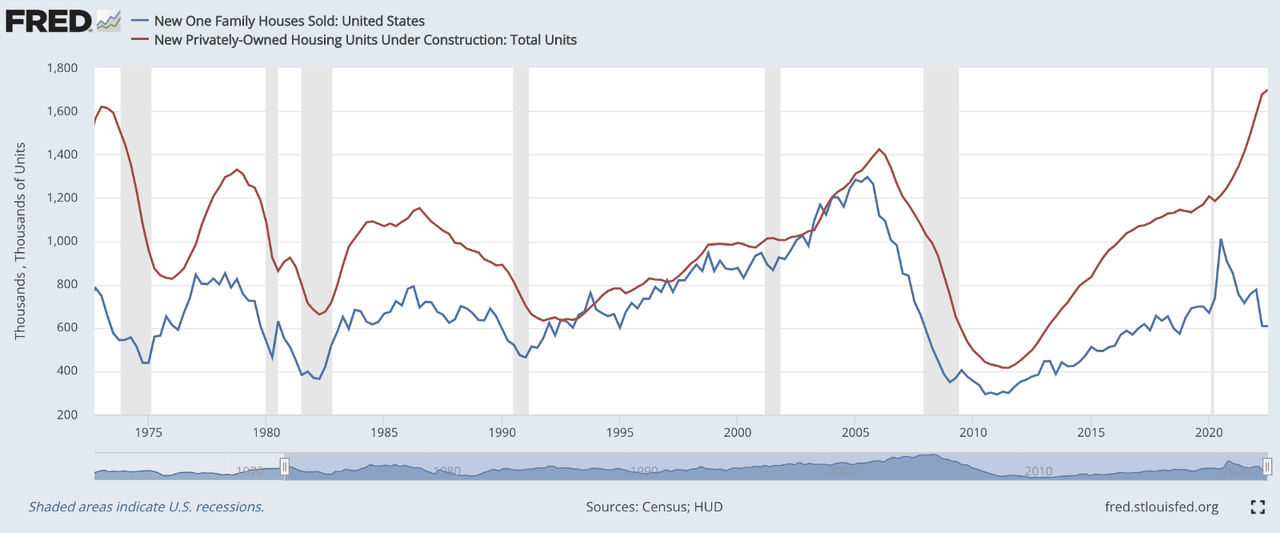
However, this is indeed an illusion, generated by homebuilders struggling to plan through unprecedented shifts in macroeconomic conditions. Healthy housing data (housing starts, permits, units under construction) is actually a bearish signal for homebuilders. It exhibits the inability of homebuilders to respond to rapidly shifting trends in demand, and I believe it will serve as the catalyst for a deeper housing correction than usual, as a cloud of excess inventory prevents a quick recovery.
Be the first to comment