

undefined undefined
One of the biggest challenges facing Americans today is maintaining their standard of living in the face of the highest inflation that we have seen in more than forty years. This has forced some people to take on second jobs just to earn the money that they need to keep themselves or their families fed. Fortunately, as investors, we have other ways to increase our incomes to support our lifestyles. One of the best ways that we can accomplish this is by purchasing closed-end funds (“CEFs”) that specialize in the generation of income. These funds are nice because they provide exposure to a professionally managed portfolio that can use a variety of strategies to deliver a higher yield than most other things in the market.
In this article, we will discuss the John Hancock Preferred Income Fund (NYSE:HPI), which is one fund that falls into this category. This is evident by the fund’s 9.31% yield, which is substantially higher than most other assets can deliver. I have discussed this fund before, but more than a year has passed since that time, so obviously a great many things have changed. This article will, therefore, focus specifically on those changes as well as provide an updated analysis of the fund’s financial performance as we try to determine its potential as an investment.
About The Fund
According to the fund’s webpage, the John Hancock Preferred Income Fund has the stated objective of providing investors with as high of a current income as possible while still preserving capital. This is not exactly surprising considering that this is a fixed-income fund. Fixed-income securities by their very nature deliver most of their investment return in the form of direct payments to investors.
These securities have relatively limited potential for capital gains, which can actually be an advantage in certain situations. This is because they tend to be somewhat insulated from the effects of a weak economy. After all, companies will generally continue to pay the interest on their debt unless they are on the verge of collapse.
With that said, the Federal Reserve will usually lower interest rates in weak economies. The value of fixed-income securities tends to go up when interest rates decline so in some ways, these securities can act as a hedge against the bear market that will usually accompany a recession. This is the reason why most financial advisors recommend keeping a certain portion of your portfolio invested in fixed-income assets.
The John Hancock Preferred Income Fund does not significantly invest in bonds, however. Rather, as the name suggests, the fund invests primarily in preferred stock:
CEF Connect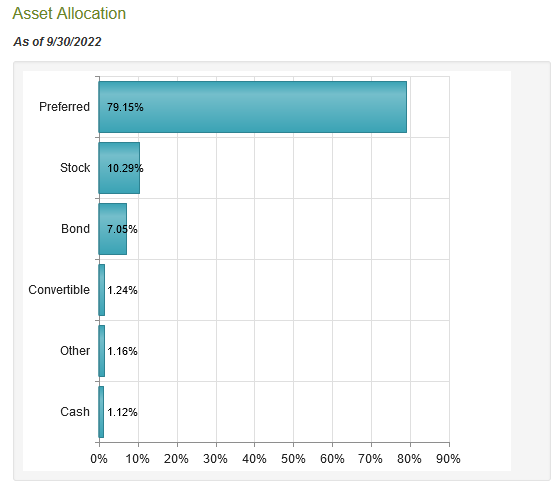
This is not necessarily a bad thing, though, as preferred stock shares exhibit some of the qualities of both common stocks and bonds. They tend to trade much like bonds, as the dividend payment that is made to investors does not vary based on the performance of the underlying company. As is the case with common stock, though, missing a dividend payment will not push the company into bankruptcy. However, most companies will do anything in their power to make their promised preferred dividend payments as the company cannot pay a dividend to the common stockholders unless it also pays the preferred shareholders.
In many cases, the company must pay any preferred dividends in arrears before making a dividend payment to the common stockholders. As preferred stock does not typically appreciate because of the growth of the underlying company, these shares usually deliver much higher yields than the common stock of the same company. They also have significantly higher yields than bonds issued by the same company because they are slightly riskier due to the optional dividends. As such then, this type of stock may offer the most attractive tradeoff between risk and reward for an income-focused investor.
As was the case the last time that we looked at this fund, the majority of its largest positions are in two sectors. These are financial services and utilities:
John Hancock Funds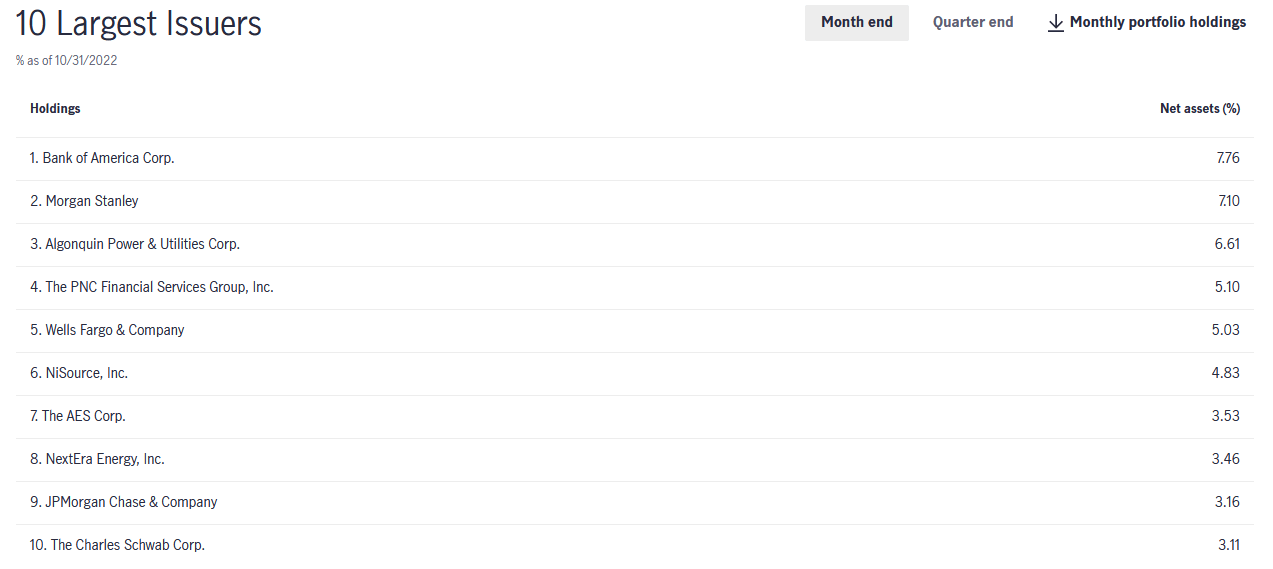
This will likely seem to be a very unusual combination, since banks and utilities have very little in common. In fact, the only thing that they have in common is the extensive use of preferred stock. However, we can see that the majority of the largest positions held by the fund are banks. This is not surprising, as banks are by far the largest issuers of preferred stock in the market due to international regulations.
In short, banks are required to back a certain percentage of their assets with Tier one capital. Tier one capital is a term that refers to that capital held by a bank that is the bank’s own money and not money that is also a liability to someone else, such as a depositor. There are two ways for a bank to increase its Tier one capital, which it is required to do if it takes on more deposits or regulations change. Its options to do this are issuing either common stock or preferred stock and most banks will opt to issue preferred stock in order to avoid diluting the common stockholders too much.
The utility sector also issues significant amounts of preferred stock but nowhere near the amount that banks do. The reason for this is that it is incredibly expensive to construct and maintain utility-grade infrastructure over wide geographic areas. While a utility will usually finance these expenditures through the issuance of debt, it might also opt to issue preferred stock in order to prevent its debt from getting too high. The use of preferred stock is much less common than in the banking sector though because debt is cheaper. The fact that debt is cheaper is also the reason why we do not normally see it outside of the utility or banking sectors.
Many of the largest positions in the fund are the same as the last time that we looked at it, although several of the weightings are different than a year ago. There have been a few changes, however. The most notable of these are U.S. Cellular (USM), DTE Energy (DTE), CenterPoint Energy (CNP), and Dominion Energy (D) being replaced by PNC Financial (PNC), The AES Corp. (AES), JPMorgan Chase (JPM), and Charles Schwab (SCHW) among the fund’s largest positions.
The fact that generally few positions have changed may lead one to believe that this fund has a relatively low annual turnover. This is indeed the case as the fund has a 21.00% annual turnover, which is fairly low even for a fixed-income fund. The reason that this is nice to see is that it costs money to trade assets and these costs are billed to the fund’s shareholders. As such, these expenses create a drag on the fund’s performance that management must earn back in addition to delivering a return that shareholders find acceptable.
This is one of the reasons why index funds have become so popular, as they only do limited trading and have low expenses. This does not necessarily mean that a fund that does a lot of trading will underperform, but it does make things more difficult for management. As we can see, this fund does not really have a problem with being too active, however.
This may be one reason why the fund managed to outperform in 2021. During that year, the John Hancock Preferred Income Fund’s portfolio delivered a 10.55% total return compared to the 3.42% return of the ICE BofA All Capital Securities Index as well as the 8.84% average return of the universe of preferred stock funds. Naturally, past performance is no indication of future results but this is a great place to start.
Leverage
Earlier in this article, I stated that closed-end funds like the John Hancock Preferred Income Fund are able to use a variety of strategies that allow them to deliver higher returns than most other things in the market. They are also able to deliver higher yields than the underlying assets in the fund. One of the strategies that this fund utilizes to accomplish this is the use of leverage. Basically, the fund borrows money in order to purchase assets such as preferred stock. As long as the yield on the purchased assets is greater than the interest rate on the borrowed funds, the strategy works quite well to boost the effective yield of the portfolio. As the fund can borrow at institutional rates, which tend to be much lower than retail rates, this will usually be the case.
Unfortunately, the use of leverage is a double-bladed sword as the use of leverage increases both gains and losses. Therefore, we want to ensure that the fund is not using too much debt as that would expose us to too much risk. I do not normally like to see a fund have a leverage of more than a third as a percentage of assets for that reason.
The John Hancock Preferred Income Fund is admittedly a bit above that level at 37.90% leverage as a percentage of its assets. This is quite a bit higher than the 31.30% leverage that the fund had the last time that we looked at it, which was probably caused by the rising interest rate environment over the past year suppressing the value of the fund’s preferred stocks. I’m willing to allow this fund to be a bit over the 33% threshold considering that the assets that it holds are preferred stocks so they are by definition less volatile than common stocks but we still want to keep an eye on this as the leverage will still amplify its losses.
Distribution Analysis
As stated earlier in this article, the primary objective of the John Hancock Preferred Income Fund is to provide its investors with a high level of current income. In addition, the fund primarily invests in preferred stocks, which deliver their returns primarily through direct payments to investors. As such, we might expect that the fund would boast a relatively high distribution yield. This is indeed the case as the fund currently pays a monthly distribution of $0.1235 per share ($1.482 per share annually), which gives the fund a 9.31% yield at the current price. The fund has generally been consistent about its distribution over time and it has maintained the same distribution since 2019:
CEF Connect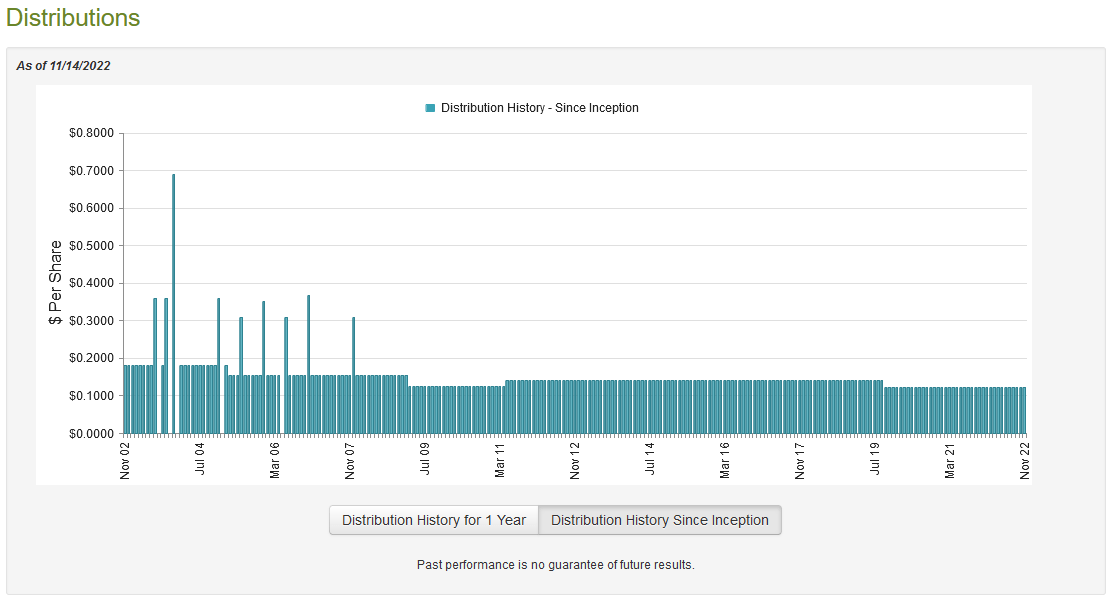
This is something that will undoubtedly appeal to anyone that is seeking a reliable and consistent source of income with which to pay their bills. However, these same investors may be concerned by the fact that some portion of the distributions is considered to be a return of capital:
Fidelity Investments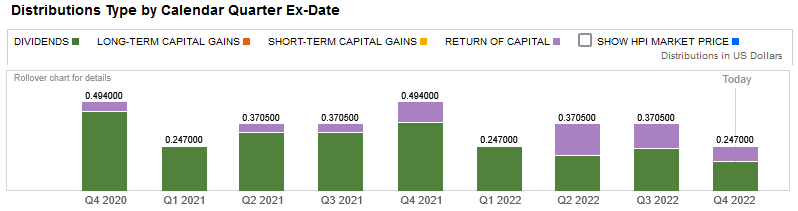
The reason why this may be concerning is that a return of capital can be a sign that the fund is returning the investors’ own money back to them. This is obviously not sustainable over any sort of extended period. There are other things that can cause a distribution to be considered a return of capital though, such as the distribution of unrealized capital gains. As such, we should investigate to see exactly how the fund is financing these distributions so that we can determine how sustainable they are likely to be.
Fortunately, we have a fairly recent document that we can consult for that purpose. The fund’s most recent financial report corresponds to the full-year period ending July 31, 2022. As such, it should provide us a great deal of insight into how well the fund performed throughout the rather volatile market that characterized the first half of the year as well as give us some insight into the cause of the return of capital distributions in the fourth quarter of 2021 and the second quarter of 2022.
During the full-year period, the fund received a total of $31,655,642 in dividends and $13,072,245 in interest from the assets in its portfolio. After we net out the fund’s foreign withholding taxes, the fund had a total income of $44,651,281 during the year. The fund covered its expenses out of this amount, which left it with $35,444,645 available for investors. This was not enough to cover the $39,002,968 that it actually paid out in distributions during the period, although the fund did get pretty close.
Naturally, there are other ways through which the fund can generate the income that it needs to cover its expenses. The most significant of these is capital gains. As might be expected because of the Federal Reserve’s interest hiking campaign that started in March, the fund did not enjoy much success here. It had total net realized gains of $8,488,927 but this was more than offset by $79,267,666 total net unrealized losses. Overall, the fund’s assets declined by $72,361,066 after accounting for all inflows and outflows. Although this may not be encouraging, the fund did manage to cover its distributions through its income and realized capital gains.
It is also important to keep in mind that the yields on preferred stock and bonds tend to go up when interest rates do so any new additions to the portfolio will have respectable yields. In addition, some preferred stock actually has a floating yield that increases with interest rates. As such, this distribution is probably sustainable because, while the rising interest rates did decrease the value of the fund’s portfolio, they did not have an adverse impact on its actual income.
Valuation
It is always critical that we do not overpay for any asset in our portfolios. This is because overpaying for any asset is a surefire way to generate a suboptimal return on that asset. In the case of a closed-end fund like the John Hancock Preferred Income Fund, the usual way to value it is by looking at the net asset value. The net asset value of a fund is the total current market value of all the fund’s assets minus any outstanding debt. It is therefore the amount that the fund’s shareholders would receive if the fund were immediately shut down and liquidated.
Ideally, we want to purchase the shares of a fund when we can acquire them at a price that is less than the net asset value. This is because such a scenario implies that we are acquiring the fund’s assets for less than they are actually worth. That is unfortunately not the case with this fund. As of November 14, 2022 (the most recent date for which data is currently available), the John Hancock Preferred Income Fund had a net asset value of $15.97 per share but the shares actually trade for $16.12 per share. This gives the shares a 0.94% premium to net asset value at the current price. This is admittedly a lot more attractive than the 4.57% premium that the shares traded at on average over the past month but it still represents a premium. It is possible that if we wait a little bit, we may be able to acquire the shares at a slight discount, which would be preferable.
Conclusion
In conclusion, the John Hancock Preferred Income Fund looks like a very good way for an income-focused investor to obtain a very attractive and reasonably secure source of income to help them cover the rising costs of daily living. As the HPI fund primarily invests in preferred stock, we can assume that the fund’s income is likely to be quite safe, but it may admittedly see more capital losses as interest rates continue to rise. This is one reason why it might be advisable to wait until the shares trade at a discount before buying in. Otherwise, though, the John Hancock Preferred Income Fund has a lot to like about it.
Be the first to comment