

Joe Raedle
 Introduction
U.S.-based independent oil and gas producer Hess Corporation (NYSE:HES) released its third-quarter 2022 results on October 26, 2022.
Important note: This article is an update of my article published on August 8, 2022. I have followed HES on Seeking Alpha since 2017, with 19 articles published and counting.
1 – 3Q22 results Snapshot and sale completion of interests in Libya.
HES reported an adjusted third-quarter 2022 earnings per share of $1.89, beating again analysts’ expectations this quarter. It compared to $0.27 per share a year ago.
The quarterly revenues rose to $3,157 million from $1,811 million last year.
Production, including Libya, was 368K Boep/d in 3Q21. Production from Guyana reached 98K Bop/d this quarter. Net cash provided by operating activities was $1,339 million in the third quarter of 2022, up from $615 million in the third quarter of 2021.
Cash and cash equivalents, excluding the Midstream segment, were $2.384 billion on September 30, 2022
The midstream business generated adjusted net earnings of $68 million in 3Q22, up from $61 million a year ago.
Hess Corp. announced its 8th and 9th discoveries this year in the Stabroek block called Yarrow-1 and Sailfin-1. These two discoveries add to the previous gross discovered recoverable resource estimate for the Block of approximately 11 billion BOE.
This is a total of 30 discoveries, with two phases producing 360K Bop/d gross. The company expects achieving first oil with its third phase, called Payara, in late 2023.
HES The Stabroek Block discoveries presentation (Fun Trading)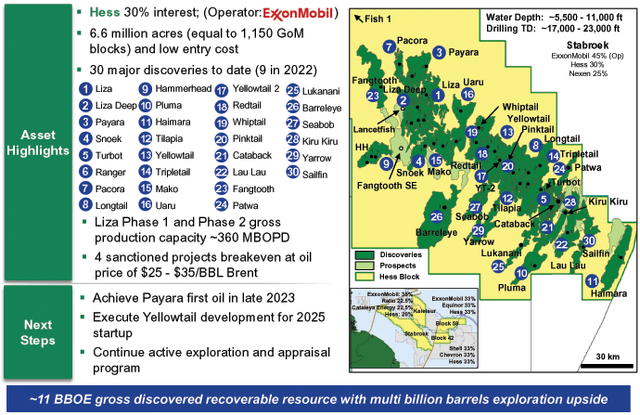
Four sanctioned Guyana developments have breakeven prices of $25- $35/BBL Brent. Two phases are producing and two phases with the first oil in late 2023 and 2025, respectively.
HES Guyana four phases presentation FPSOs (HES Presentation)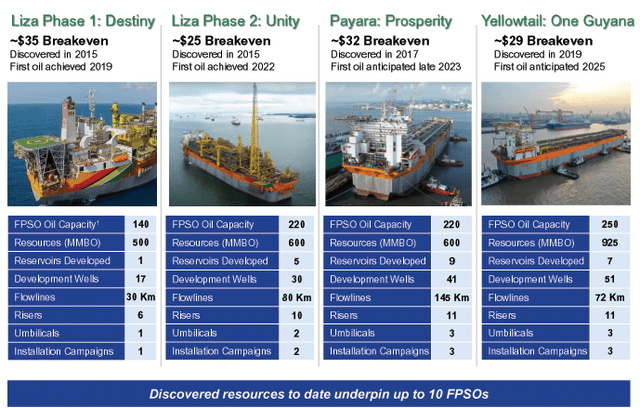
CEO John Hess said in the conference call:
On the Stabroek Block in Guyana, where Hess has a 30% interest and Exxon Mobil is the operator, we continue to see the potential for six floating production storage and offloading vessels or FPSOs in 2027 with a gross production capacity of more than one million barrels of oil per day and up to 10 FPSOs to develop the discovered resources on the block.
Furthermore, in Suriname, HES (33%) and Shell recently drilled the Zanderij-1 well in Block 42, located north of the TTE/APA block 58.
The well demonstrated a working petroleum system and encountered oil pay. The well results are being evaluated, and further exploration activities are being considered.
HES Suriname blocks MAP (BnAmericas)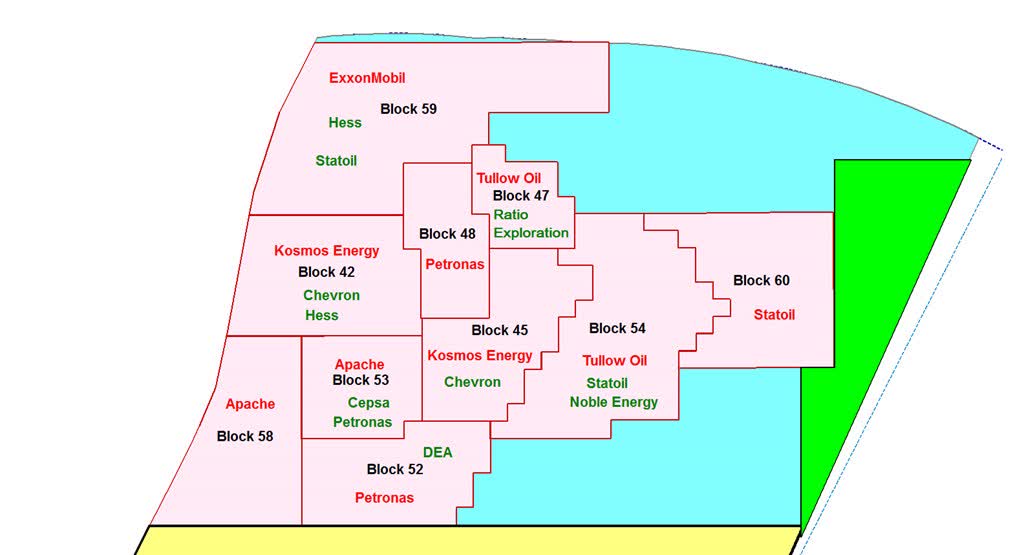
In 2016, Hess acquired a one-third non-operated interest in the Block from Kosmos Energy. Chevron and Shell – the operator – each have a one-third interest in Block 42.
Note: Shell holds a 33.33% interest in Block 42, acquired from Kosmos Energy in December 2020.
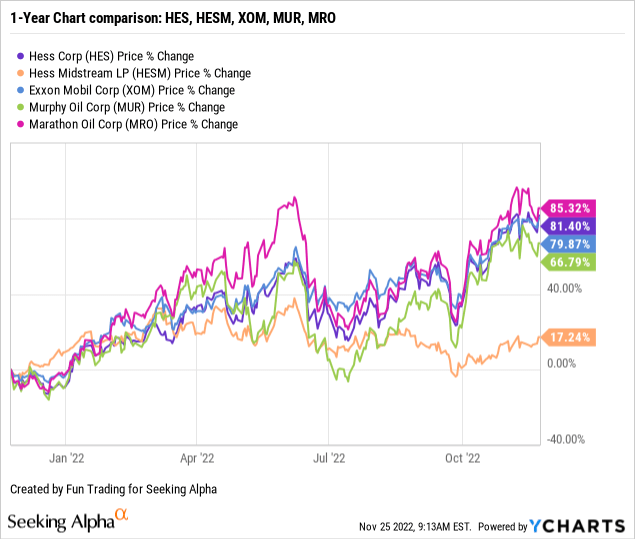
2 – Stock Performance
HES is doing very well on a one-year basis. The stock is now up 81% on a one-year basis. HESM is not doing as well and is lagging behind its peers, with an increase of 17% on a one-year basis.
Hess Corp. 3Q22 Balance Sheet and Trend – The Raw Numbers
| Hess Energy | 3Q21 | 4Q21 | 1Q22 | 2Q22 | 3Q22 |
| Total Revenues and others in $ Billion | 1.81 | 2.26 | 2.37 | 2.99 | 3.16 |
| Net income available to common in $ Million | 115 | 265 | 417 | 667 | 515 |
| EBITDA $ Million | 804 | 1,087 | 1,162 | 1,594 | 1,484 |
| EPS diluted in $/share | 0.37 | 0.85 | 1.34 | 2.15 | 1.67 |
| Cash from operations in $ Million | 615 | 899 | -156 | 1,509 | 1,339 |
| Quarterly CapEx in $ Million | 498 | 509 | 546 | 663 | 723 |
| Free Cash Flow in $ Million | 117 | 390 | -702 | 846 | 616 |
| Cash and cash equivalent $ Billion | 2.42 | 2.71 | 1.37 | 2.16 | 2.38 |
| Long-term debt (consolidated) in $ Billion | 8.51 | 8.46 | 7.96 | 8.33 | 8.30 |
| Dividend per share in $ | 0.25 | 0.25 | 0.375 | 0.375 | 0.375 |
| Shares outstanding (diluted) in Million | 308.1 | 308.3 | 308.9 | 311.26 | 308.90 |
| Oil Production | 3Q21 | 4Q21 | 1Q22 | 2Q22 | 3Q22 |
| Oil Equivalent Production in K Boep/d (incl. Libya) | 284 | 316 | 297 | 322 | 368 |
| Global liquids price ($/b) | 63.17 | 71.04 | 86.75 | 99.16 | 85.32 |
| Global Natural gas price ($/M Btu) |
4.71 |
4.77 |
5.28 |
6.45 |
5.85 |
Source: Company material
Analysis: Revenues, Generic Free Cash Flow, and Oil and Gas Production Worldwide
1 – Quarterly total revenues were $3,122 million in 3Q22
HES Quarterly Revenues history (Fun Trading)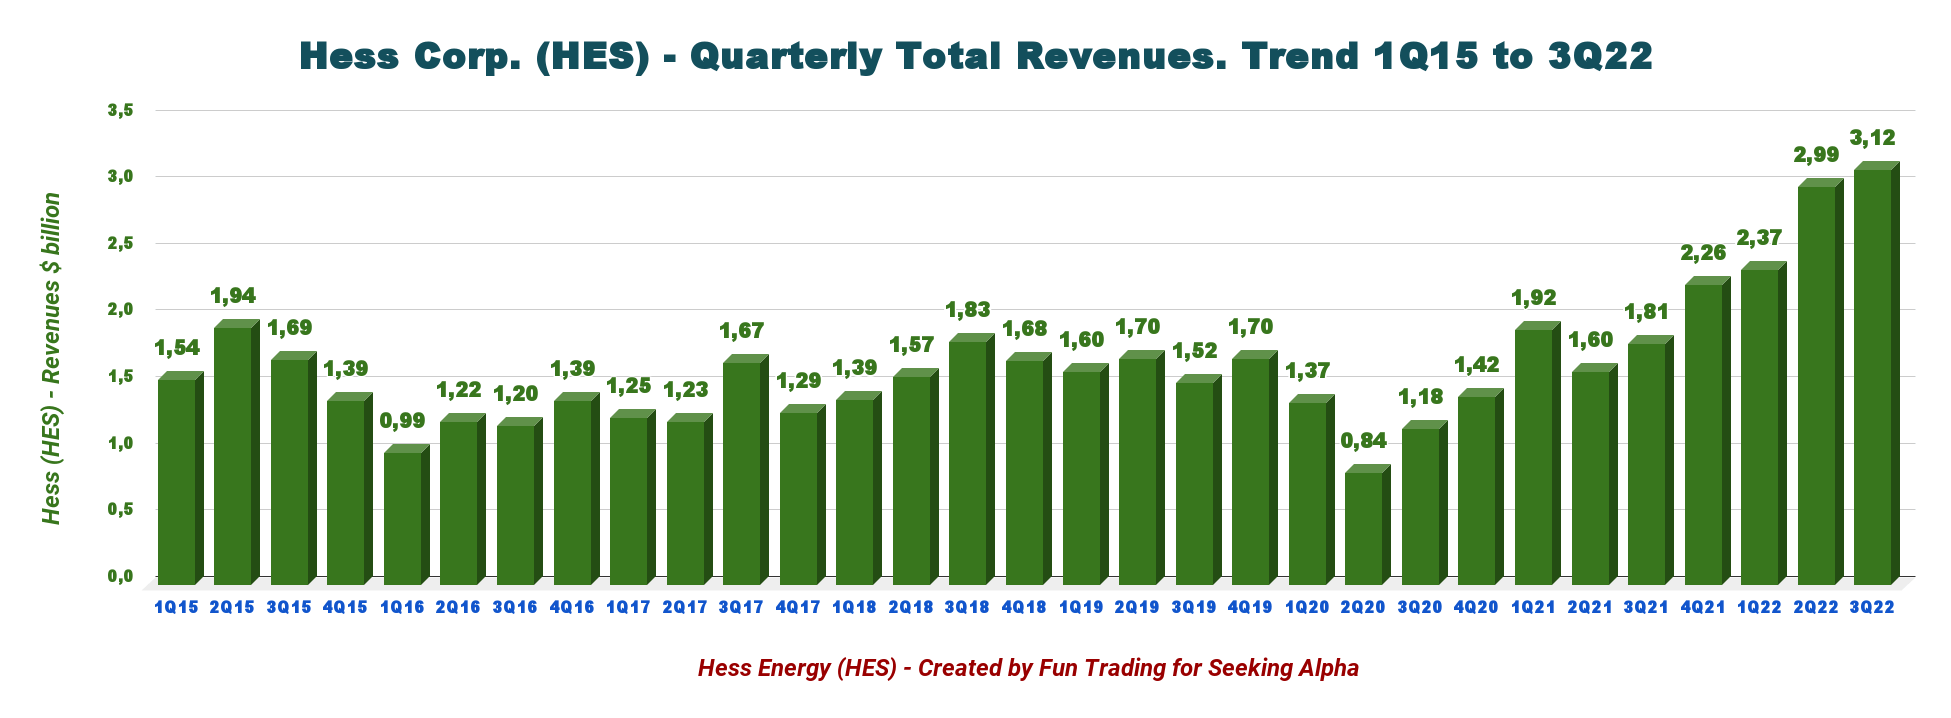
Hess’ oil revenues increased to $3,122 million in the third quarter of 2022 from $1,759 million in the same quarter a year ago. Total revenues were $3,157 million.
The quarterly income was $515 million or $1.67 per diluted share, compared to $0.37 per diluted share in 3Q21.
The adjusted net income was $583 million or $1.89 per share compared with an adjusted net income of $86 million in the prior-year quarter.
The midstream business generated adjusted net earnings of $65 million, down from $76 million a year ago.
2 – Free cash flow (not including divestiture) and net debt
HES Quarterly Free cash flow history (Fun Trading)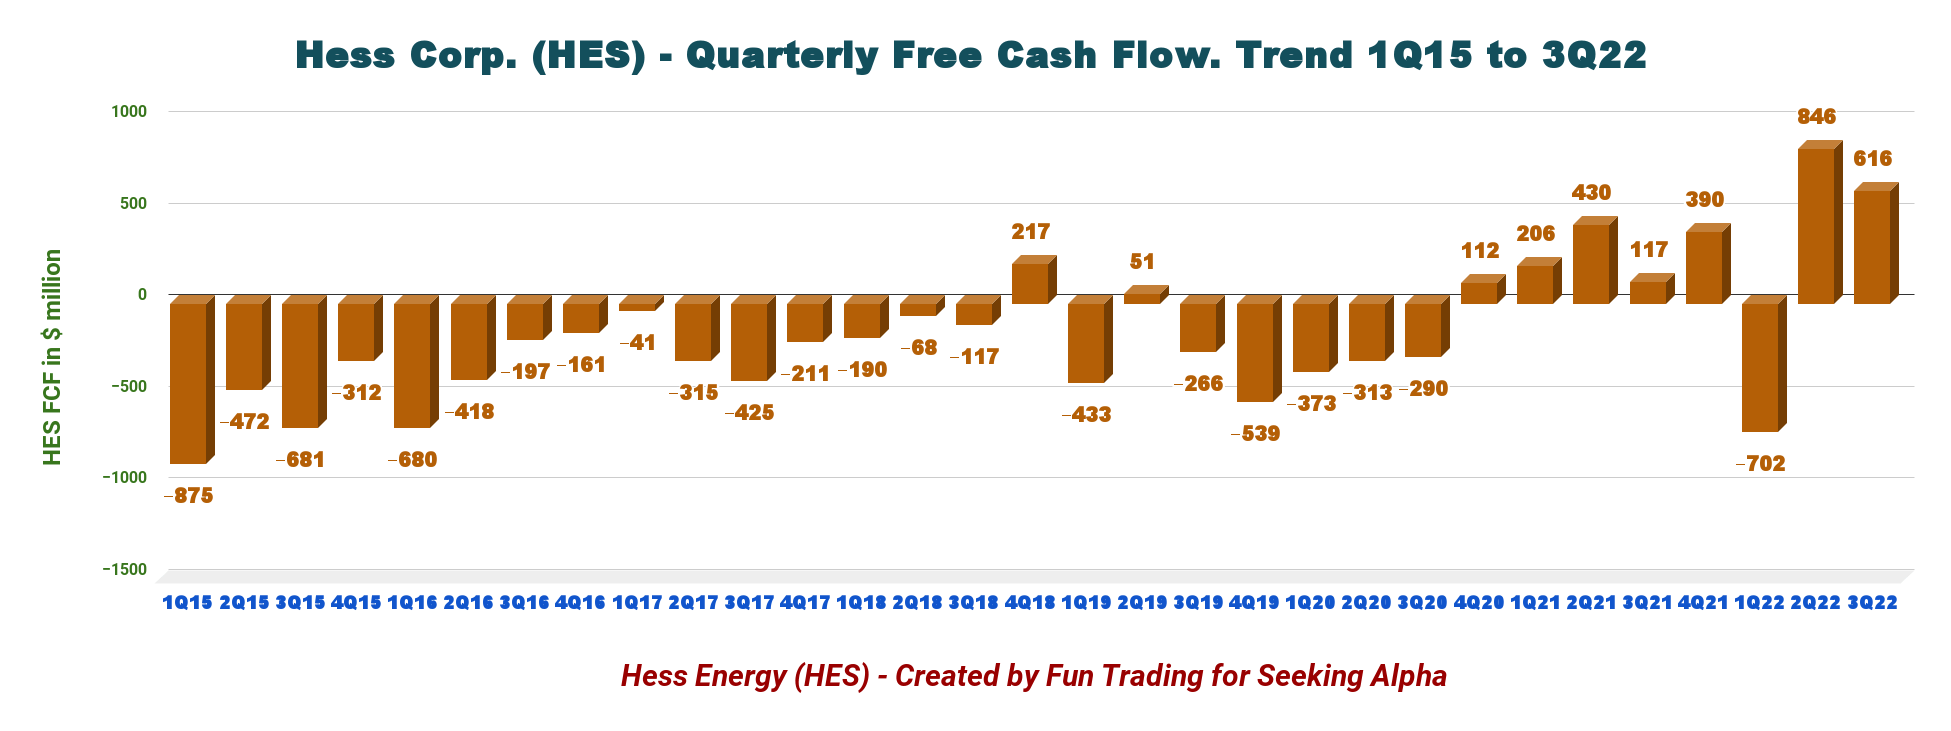
Note: The generic free cash flow is the cash flow from operation minus the CapEx.
HES’s trailing 12-month free cash flow jumped to $1,150 million, with a free cash flow of $616 million in 3Q22, up significantly from 3Q21 of $117 million.
The company declared a quarterly dividend of $0.375 per share this quarter.
HES plans to repurchase $650 million of common stock in 2022 and allocate up to 75% of annual free cash flow to shareholders through dividend increases and share repurchases.
3 – Net Debt and Cash on Hand
HES Quarterly Cash versus Debt history (Fun Trading)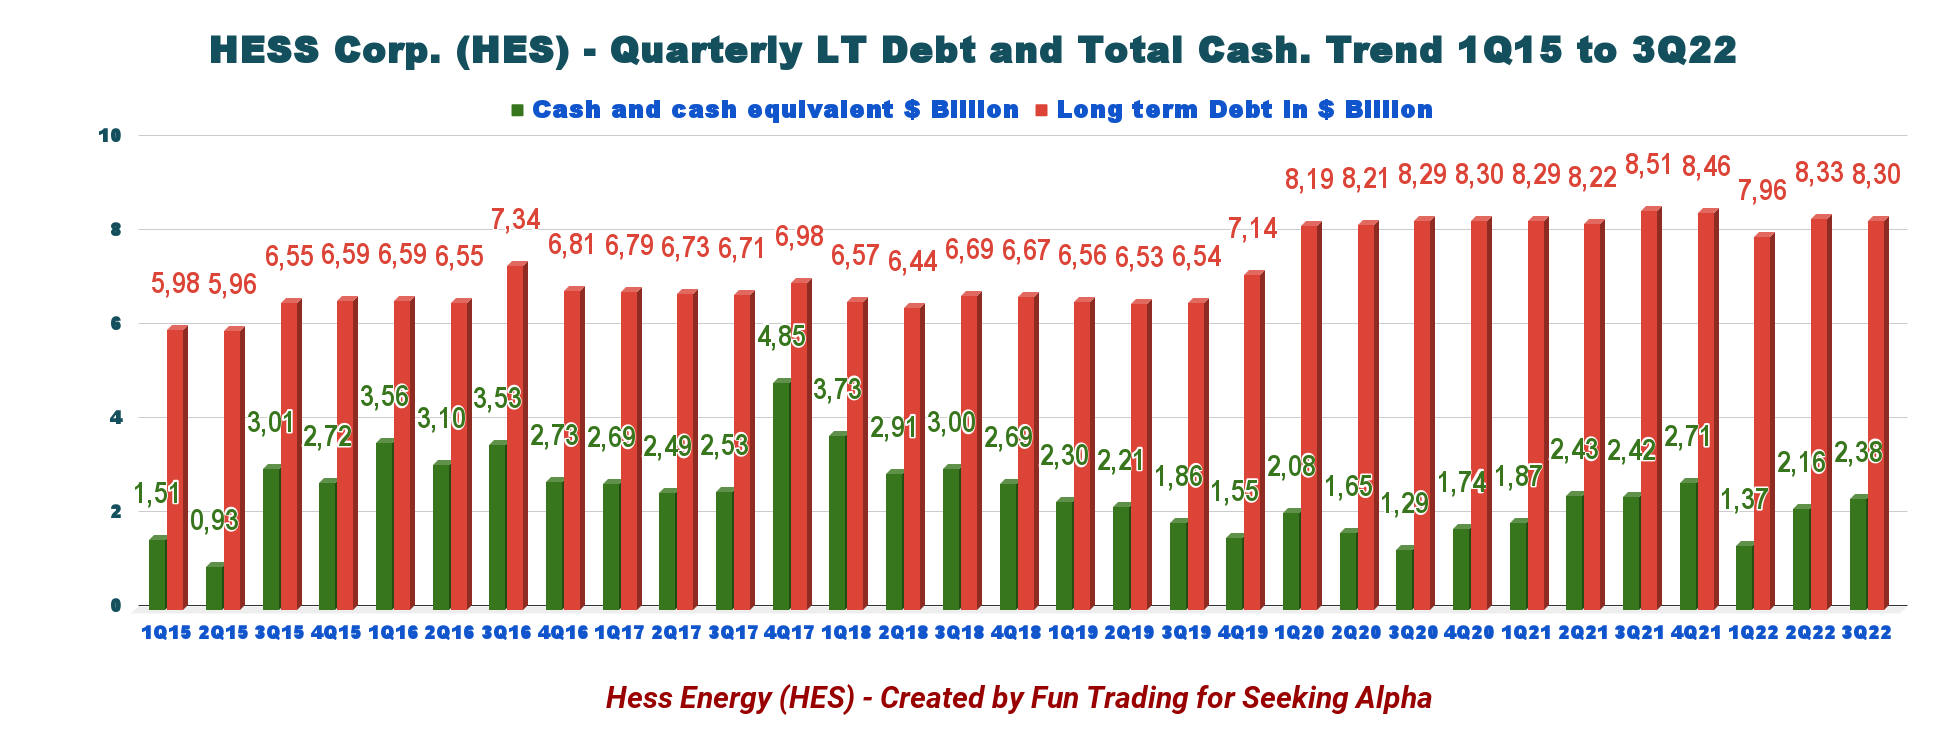
As of September 30, 2022, the company had $2,384 million in cash & cash equivalents, up 10.4% from the previous quarter.
E&P Debt (non-GAAP) was $6.113 billion. Its long-term debt (consolidated) was $8,458 million. HES had no current maturity of the long-term debt this quarter.
The Midstream segment had cash and cash equivalents of $3 million and total debt of $2.9 billion on September 30, 2022.
Note: The Corporation owns approximately 41% of HESM on a consolidated basis
The Corporation’s debt-to-capitalization ratio, as defined in its debt covenants, was 36.8% on September 30, 2022, and 42.3% on December 31, 2021. HES has made good progress in reducing debt, but the company needs to cut further.
4 – Quarterly production analysis
4.1 – Production
HES Quarterly Production history (Fun Trading)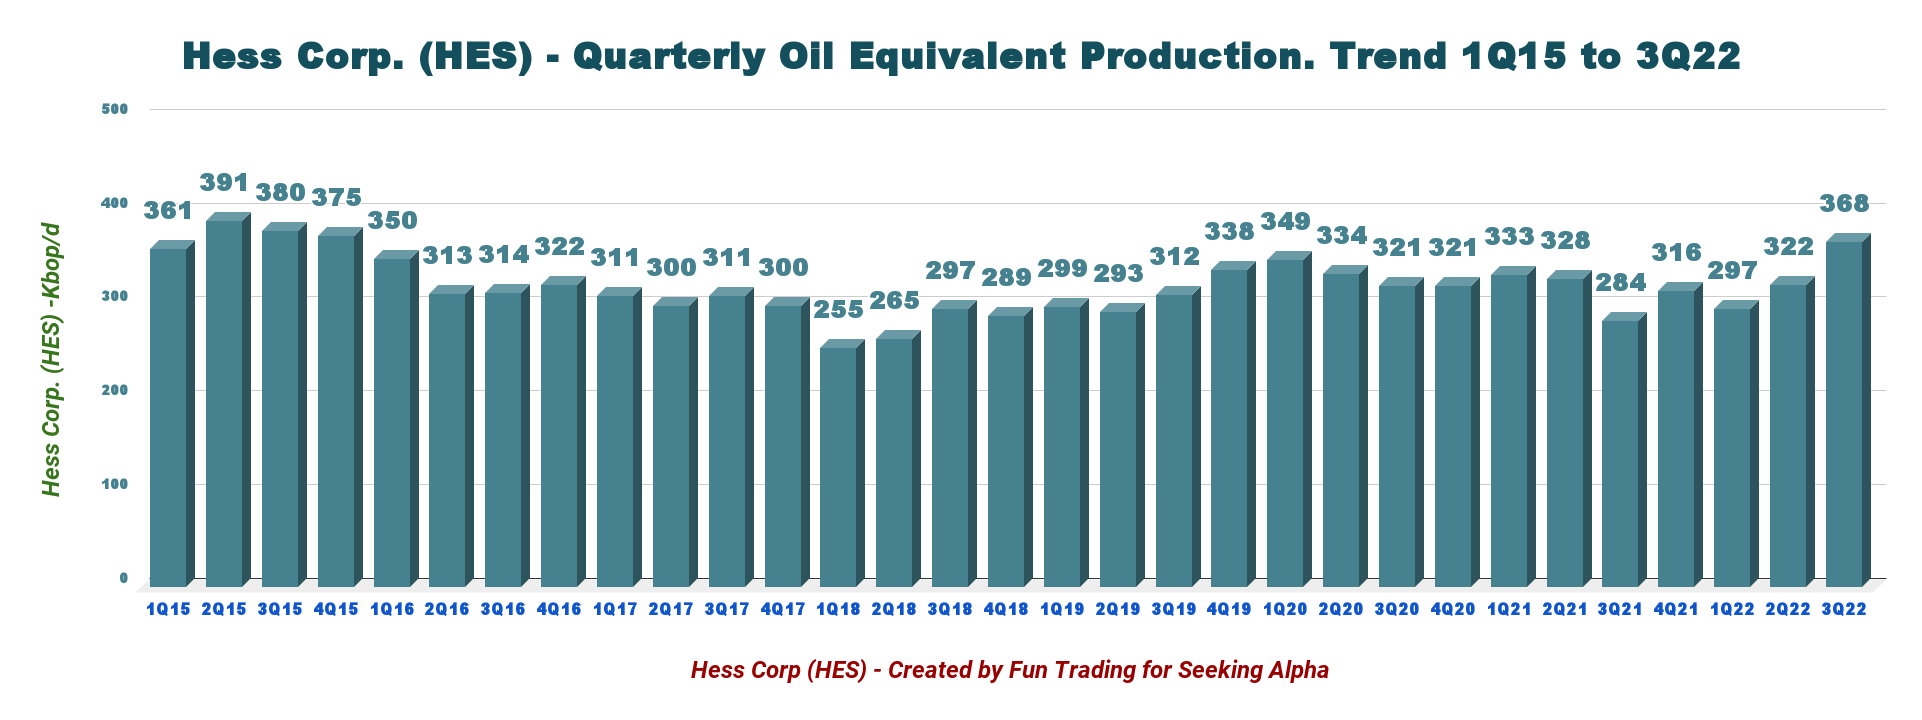
HES produced 368K net Boep/d in 3Q22 (including Libya). It was up from 284K Boep/d the same quarter a year ago, with contributions from resources in the Bakken of 166K Boep/d this quarter and a jump in production in Guyana to 98K Boep/d.
On November 15, 2022, Hess Corp. announced that it had completed the sale of its 8.16% interest in the Waha Concession in Libya in equal shares to TotalEnergies (TTE) and ConocoPhillips (COP). During the 3Q22, production from the Waha concession was 17K Boep/d.
HES Quarterly Production per Basin 3Q22 (Fun Trading)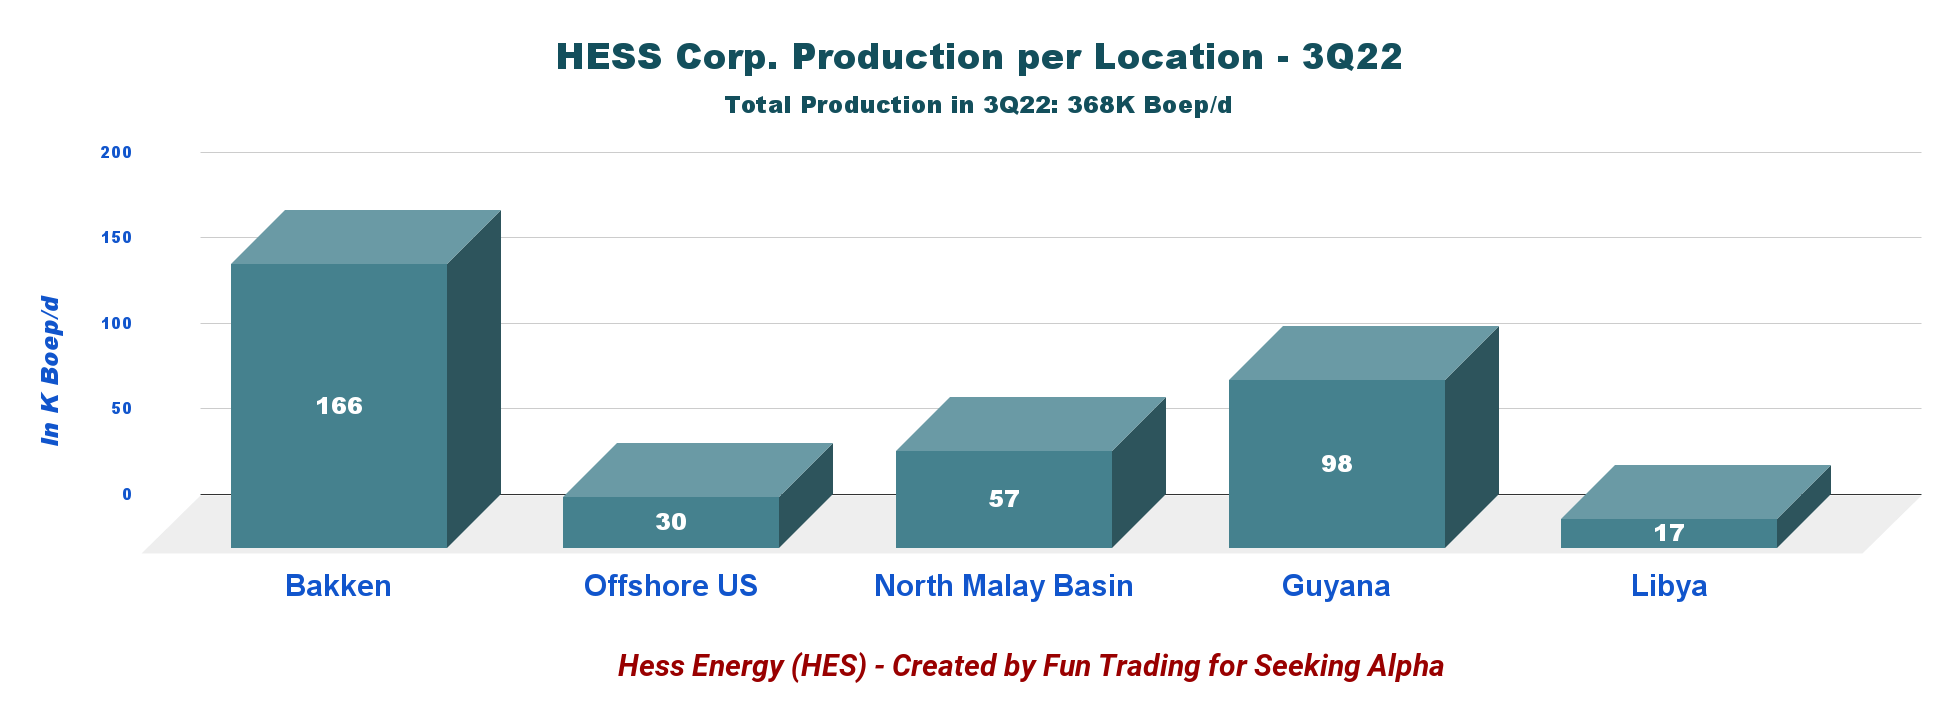
The Bakken production is by far the primary production for the company and supports the business while ramping up Guyana, which will take many years and a significant CapEx. However, Guyana went from 32K Bop/d in 3Q21 to 98K Bop/d.
Note: Bakken is expected to produce ~200K Boep/d net production in 2024+.
Crude oil represents 59% of the total output.
HES Quarterly Production Oil, NGL, NG (Fun Trading)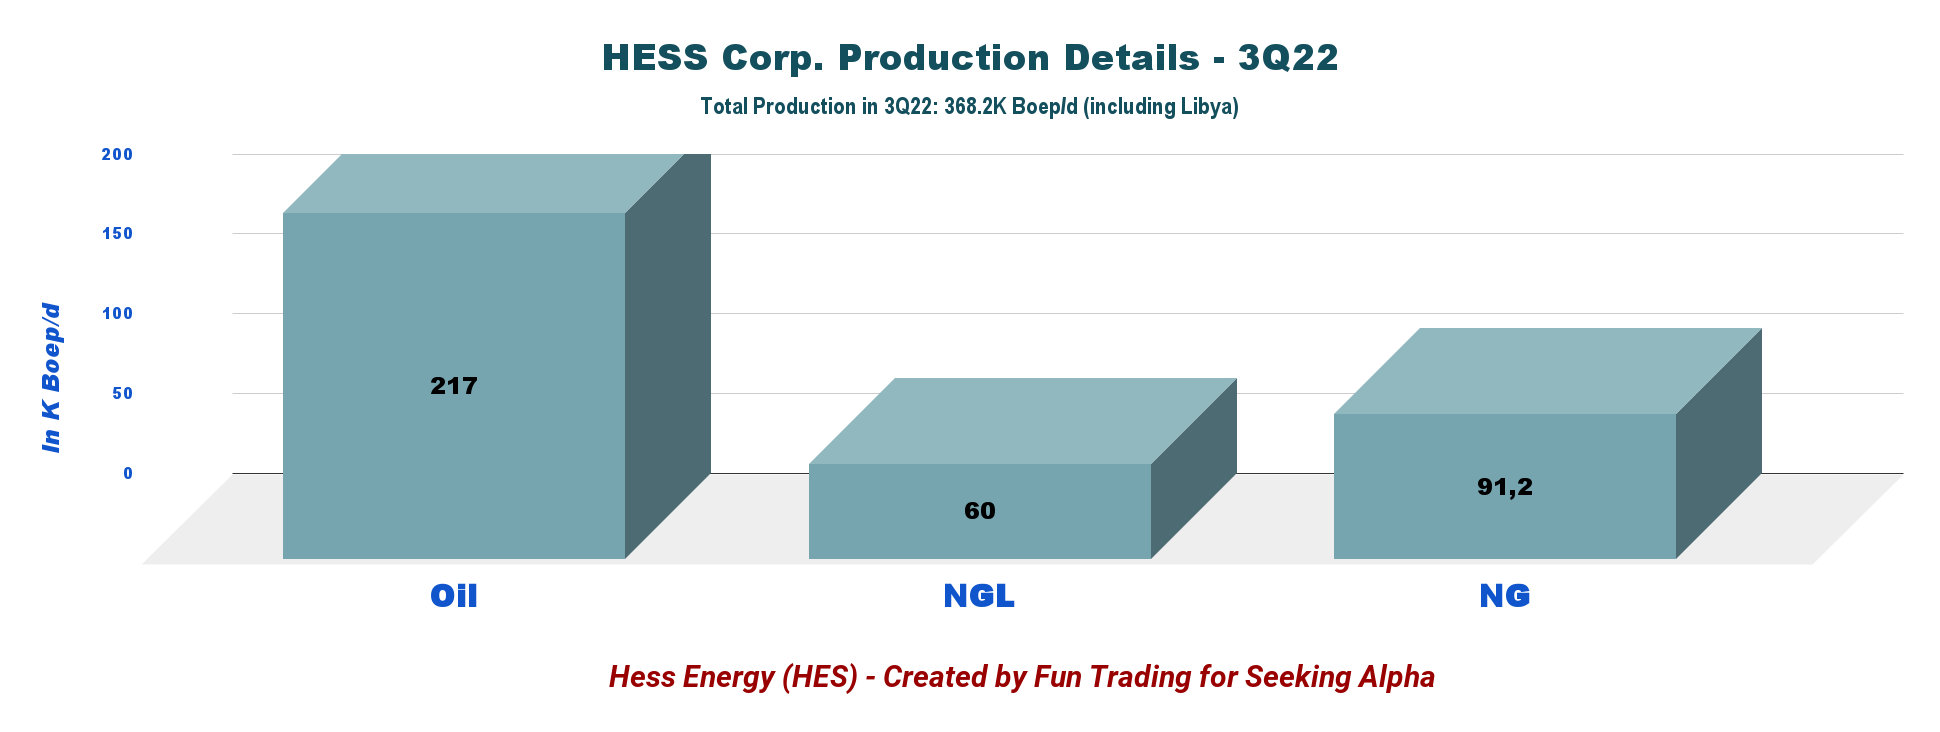
Crude oil output was 217K Bop/d in the third quarter of 2022, up from 153K Bop/d a year ago. Further, natural gas liquids production totaled 60K Bbls/d, and natural gas output was 91K Boep/d.
4.2 – Oil and Natural gas prices
Below are the historical trends of global liquid prices and NG prices.
HES Quarterly Oil and Gas prices history (Fun Trading)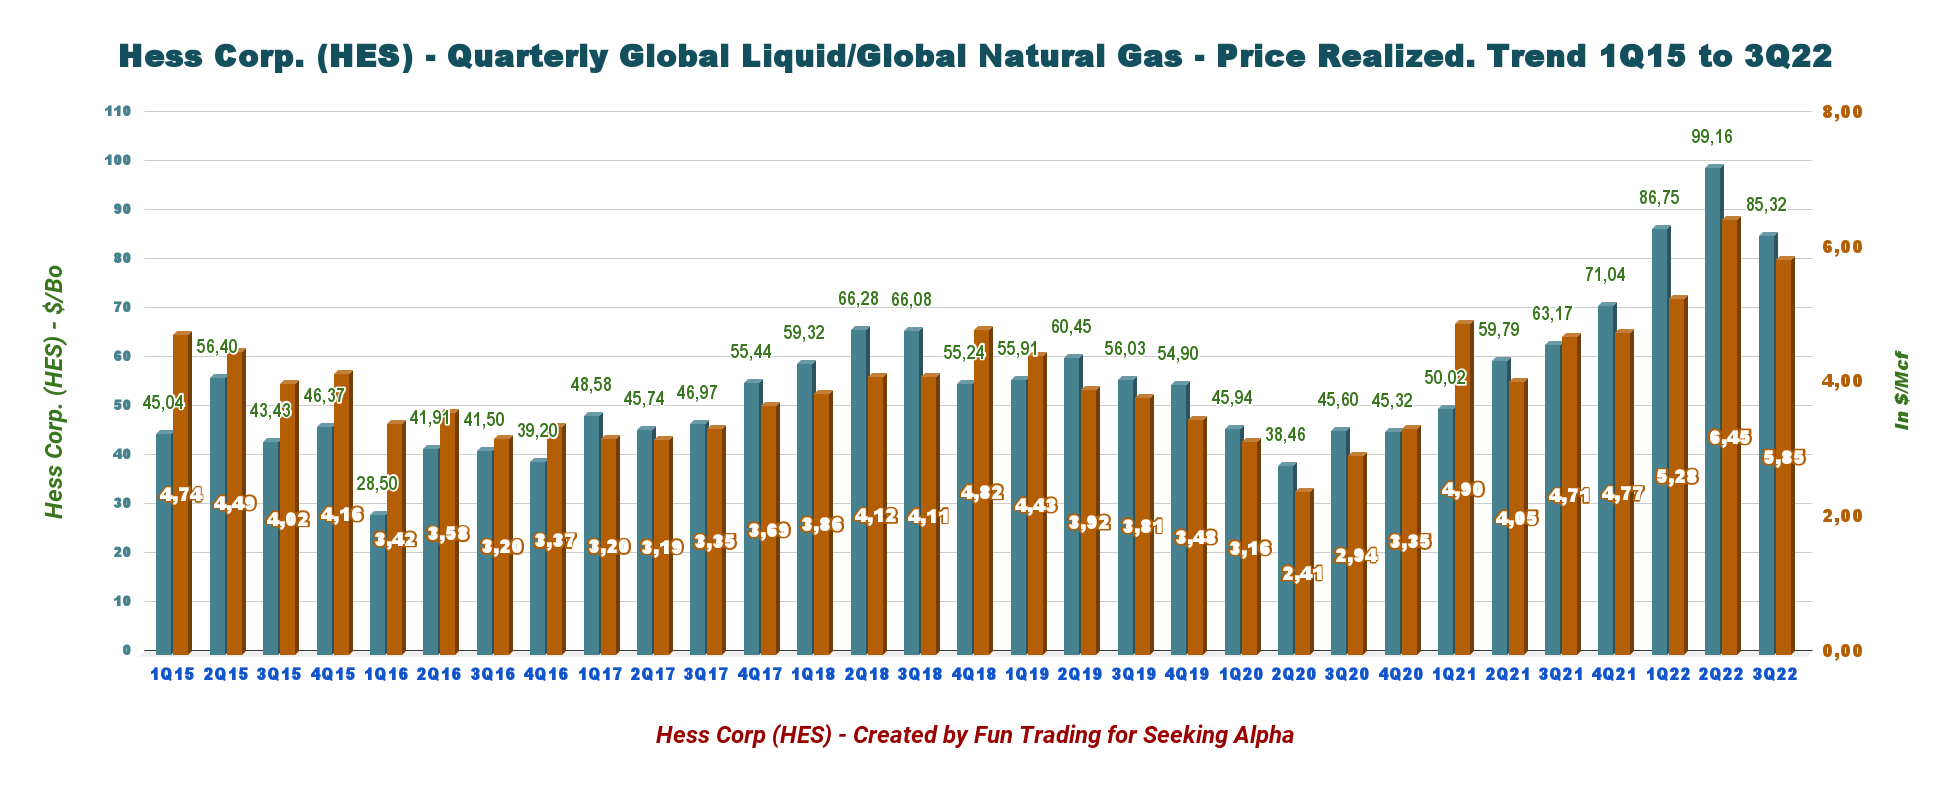
- Worldwide crude oil realization per barrel of $93.95 (excluding hedging impacts), up from $67.88 in the year-ago period.
- Also, worldwide natural gas prices rose to $5.85 per Mcf from the year-ago quarter of $4.71.
- The average worldwide natural gas liquids’ selling price increased to $35.44 per barrel from $32.88 a year ago.
4.3 – 2022 and 4Q22 Guidance revised
For 2022, Hess has revised its net production guidance upward to 325K Boep/d from the prior 320K Boep/d. Libya assets were sold in November.
For the fourth quarter, net production (excluding Libya) is projected to be 370K Boep/d.
The company expects a total CapEx of $2.7 billion.
Technical Analysis and Commentary
HES TA Chart short-term (Fun Trading StockCharts)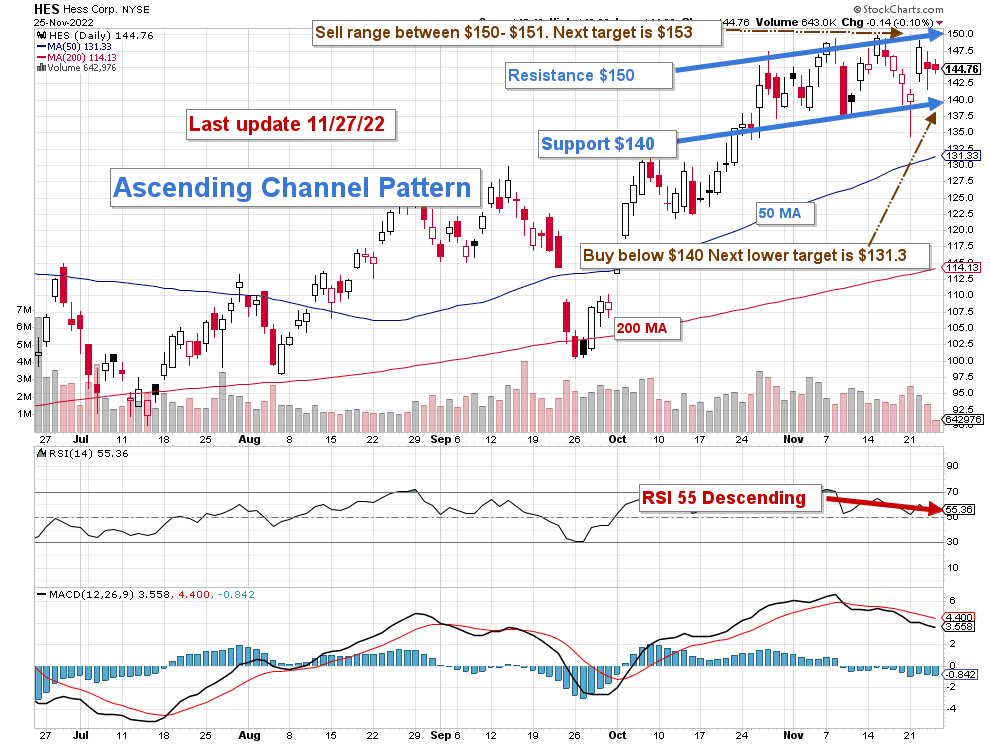
Note: the chart has been adjusted for the dividend.
HES forms an ascending channel pattern with resistance at $150 and support at $140.
Ascending channel patterns are short-term bullish moving higher within an ascending channel, but these patterns often form within longer-term downtrends as continuation patterns.
This means there is a high probability that HES retraces and tests the 50MA and 200MA. However, RSI is now 55 and suggests more downside.
The short-term strategy is regularly trading LIFO at about 30%-35% of your position, and it may be wise to increase it to 40%-50% due to the recent downward pressure in oil prices.
Thus, I recommend taking profits between $150 and $151 with potential higher resistance at $153. Conversely, I recommend buying at or below $140 with possible lower support at $131.3. If oil continues to drop, the final support target could be around $115-$120.
However, this simple short-term strategy will have to be adjusted depending on the situation in Ukraine and the growing risk of inflation that will significantly affect the oil stocks.
Watch oil prices like a hawk.
Warning: The TA chart must be updated frequently to be relevant. It is what I am doing in my stock tracker. The chart above has a possible validity of about a week. Remember, the TA chart is a tool only to help you adopt the right strategy. It is not a way to foresee the future. No one and nothing can.
Author’s note: If you find value in this article and would like to encourage such continued efforts, please click the “Like” button below as a vote of support. Thanks.
Be the first to comment