

Takako Hatayama-Phillips/iStock Editorial via Getty Images
Earnings of Heritage Commerce Corp (NASDAQ:HTBK) will increase this year partly because of loan growth driven by economic factors. Moreover, the margin’s moderately high sensitivity to interest rate changes will boost earnings in a rising interest-rate environment. Overall, I’m expecting Heritage Commerce to report earnings of $0.83 per share in 2022, up 5% year-over-year. I have slightly revised upwards my earnings estimate because the recent loan growth exceeded my expectations. Further, I now have a better outlook on net interest margin than before. The current market price is quite close to the year-ahead target price. As a result, I’m now downgrading Heritage Commerce to a Hold rating.
Recovery in Californian Economy to Support Loan Growth
Heritage Commerce’s actual earnings for 2021 were slightly higher than my expectations (given in my last report on the company) because of higher than anticipated loan growth. Loans surged by 9.1% in the last quarter of 2021 partly due to purchasing of residential mortgage loans, as mentioned in the earnings release. Organic loan growth was also positive and broad-based during the quarter.
Going forward, the loan portfolio will likely continue to grow because of the economic recovery. Heritage Commerce is based in California, particularly in the San Francisco Bay area. When measured by the unemployment rate, the state’s economy is lagging behind the rest of the country. Nevertheless, the unemployment rate has improved considerably from the start of the pandemic, as seen below.
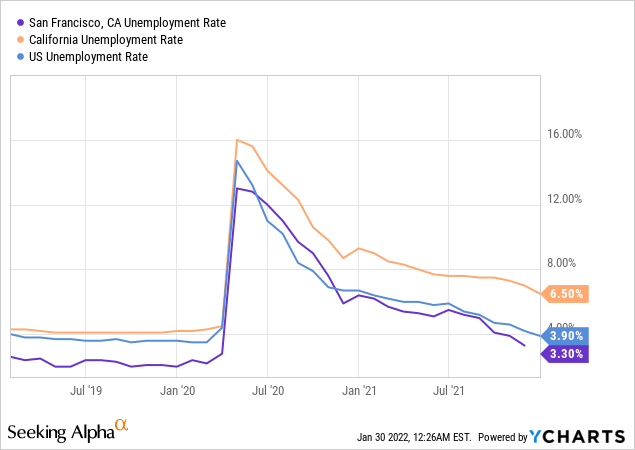
Further, the state’s GDP growth in the third quarter of 2021 was above the national average. According to official sources, California’s GDP growth was recorded at 2.9%, while the country’s GDP growth was recorded at 2.3%.
On the other hand, the forgiveness of the remaining Paycheck Protection Program (“PPP”) portfolio will restrict loan growth. Heritage almost halved its PPP portfolio during the fourth quarter of 2021, but a sizable PPP balance is still outstanding on the company’s books. PPP loans outstanding totaled $88.7 million at the end of December 2021, representing 3% of total loans, as mentioned in the earnings release.
Excluding acquired growth, Heritage Commerce’s loan growth has hovered in the mid-to-high-single-digit range in the past. I’m expecting a similar performance in 2022 as the economy is on its way to its pre-pandemic level. Resultantly, I’m expecting the loan portfolio to increase by 5% in 2022. I’m also expecting deposits and other balance sheet items to grow in line with loans. The following table shows my balance sheet estimates.
| FY17 | FY18 | FY19 | FY20 | FY21 | FY22E | ||
| Financial Position | |||||||
| Net Loans | 1,563 | 1,859 | 2,511 | 2,575 | 3,044 | 3,199 | |
| Growth of Net Loans | 5.4% | 18.9% | 35.1% | 2.6% | 18.2% | 5.1% | |
| Other Earning Assets | 1,078 | 973 | 1,180 | 1,635 | 2,054 | 2,158 | |
| Deposits | 2,483 | 2,638 | 3,415 | 3,914 | 4,759 | 5,002 | |
| Borrowings and Sub-Debt | 39 | 39 | 40 | 40 | 40 | 42 | |
| Common equity | 271 | 367 | 577 | 578 | 598 | 617 | |
| Book Value Per Share ($) | 7.0 | 8.7 | 12.0 | 9.6 | 9.9 | 10.2 | |
| Tangible BVPS ($) | 5.7 | 6.4 | 8.1 | 6.5 | 6.9 | 7.2 | |
|
Source: SEC Filings, Author’s Estimates (In USD million unless otherwise specified) |
|||||||
Higher Rates to Boost the Margin
Although the proportion of non-interest-bearing deposits in total deposits declined last year, it is still considerably high. Non-interest-bearing deposits made up a whopping 40.0% of total deposits at the end of December 2021, down from 42.45% at the end of December 2020. The large proportion of non-interest being deposits in total deposits will likely keep the average deposit cost upwards sticky in a rising interest-rate environment.
The management’s interest-rate sensitivity analysis given in the third quarter’s 10-Q filing shows that a 100-basis point instantaneous increase in rates can boost the net interest income by 13.3% over twelve months. It is important to note that this analysis incorporates the assumption of instantaneous changes in rates. A gradual change in rates will most probably have a much smaller effect on the net interest income.
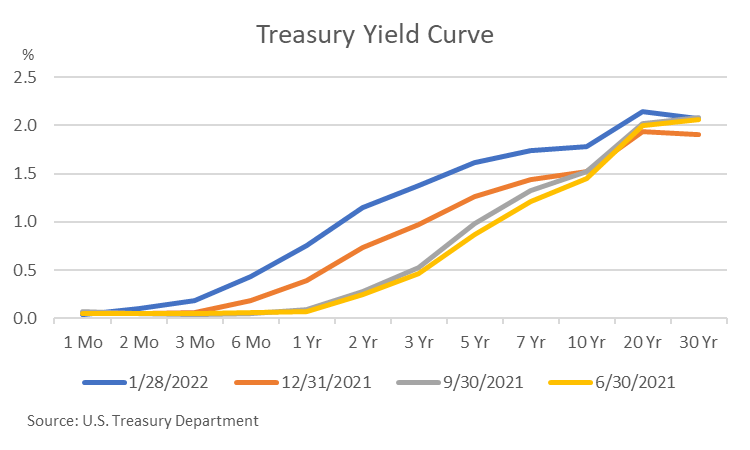
A large buildup in cash and cash equivalents pressurized the margin last year. Although the company deployed some of its excess cash during the fourth quarter of 2021, the cash balance was still far above normal by the end of the year. If heritage can further shift its asset mix towards higher-yielding assets, then its margin can considerably improve. Even if the company is unsuccessful in deploying the excess cash, the recent upward shift in the middle part of the yield curve will help the company’s average earning-asset yield.
Considering these factors, I’m expecting the net interest margin to increase by four basis points this year from 2.84% in the last quarter of 2021. Previously, I was expecting the margin to remain stable in 2022, as mentioned in my last report.
Provision Expense Likely to Remain Subdued
Heritage Commerce released a large part of its loan loss reserves through 2021. Further reserve releases cannot be ruled out because the existing allowance level is quite high relative to the portfolio’s credit risk. As mentioned in the earnings release, allowances made up 1.4% of total loans, while non-performing loans made up just 0.12% of total loans at the end of December 2021. The reversals this year will most probably be lower than the reversals last year as there is less room for reserve releases now.
The anticipated strong loan growth will increase the provision expense for this year. Overall, I’m expecting the provision expense, net of reversals, to be higher than last year but remain below normal. I’m expecting the provision expense to make up around 0.09% of total loans in 2022. In comparison, the provision expense made up 0.13% of average loans from 2016 to 2019.
Expecting Earnings to Increase by 5% Year-Over-Year
The anticipated loan growth and margin expansion will likely lift earnings this year. On the other hand, a higher net provision expense will restrict earnings growth. Overall, I’m expecting the company to report earnings of $0.83 per share in 2022, up 5% year-over-year. The following table shows my income statement estimates.
| FY17 | FY18 | FY19 | FY20 | FY21 | FY22E | ||
| Income Statement | |||||||
| Net interest income | 102 | 122 | 132 | 142 | 146 | 159 | |
| Provision for loan losses | 0 | 7 | 1 | 13 | (3) | 3 | |
| Non-interest income | 10 | 10 | 10 | 10 | 10 | 11 | |
| Non-interest expense | 61 | 76 | 85 | 90 | 93 | 97 | |
| Net income – Common Sh. | 24 | 35 | 40 | 35 | 48 | 50 | |
| EPS – Diluted ($) | 0.62 | 0.84 | 0.84 | 0.59 | 0.79 | 0.83 | |
|
Source: SEC Filings, Earnings Releases, Author’s Estimates (In USD million unless otherwise specified) |
|||||||
I have increased my earnings estimate for 2022 from an estimate of $0.72 per share given in my last report on the company. This upward revision is partly attributable to the surprising loan growth in the fourth quarter of 2021, which has pushed up my average loan balance for 2022. Moreover, I now have a better outlook on the net interest margin than before.
Actual earnings may differ materially from estimates because of the risks and uncertainties related to the COVID-19 pandemic, especially the Omicron Variant.
Downgrading to Hold
Heritage Commerce is offering a dividend yield of 4.2% at the current quarterly dividend rate of $0.13 per share. The earnings and dividend estimates suggest a payout ratio of 63% for 2022. Although this payout ratio is quite high, I’m not worried about a dividend cut because the company has maintained an over 50% payout ratio in each of the past seven years.
I’m using the historical price-to-tangible book (“P/TB”) and price-to-earnings (“P/E”) multiples to value Heritage Commerce. The stock has traded at an average P/TB ratio of 1.72 in the past, as shown below.
| FY18 | FY19 | FY20 | FY21 | Average | ||||
| T. Book Value per Share ($) | 6.4 | 8.1 | 6.5 | 6.9 | ||||
| Average Market Price ($) | 15.7 | 12.3 | 8.3 | 11.2 | ||||
| Historical P/TB | 2.44x | 1.52x | 1.28x | 1.63x | 1.72x | |||
| Source: Company Financials, Yahoo Finance, Author’s Estimates | ||||||||
Multiplying the average P/TB multiple with the forecast tangible book value per share of $7.2 gives a target price of $12.3 for the end of 2022. This price target implies a 1.3% downside from the January 28 closing price. The following table shows the sensitivity of the target price to the P/TB ratio.
| P/TB Multiple | 1.52x | 1.62x | 1.72x | 1.82x | 1.92x |
| TBVPS – Dec 2022 ($) | 7.2 | 7.2 | 7.2 | 7.2 | 7.2 |
| Target Price ($) | 10.9 | 11.6 | 12.3 | 13.0 | 13.8 |
| Market Price ($) | 12.5 | 12.5 | 12.5 | 12.5 | 12.5 |
| Upside/(Downside) | (12.8)% | (7.1)% | (1.3)% | 4.4% | 10.1% |
| Source: Author’s Estimates |
The stock has traded at an average P/E ratio of around 15.5x in the past, as shown below.
| FY18 | FY19 | FY20 | FY21 | Average | ||||
| Earnings per Share ($) | 0.84 | 0.84 | 0.59 | 0.79 | ||||
| Average Market Price ($) | 15.7 | 12.3 | 8.3 | 11.2 | ||||
| Historical P/E | 18.8x | 14.6x | 14.2x | 14.2x | 15.5x | |||
| Source: Company Financials, Yahoo Finance, Author’s Estimates | ||||||||
Multiplying the average P/E multiple with the forecast earnings per share of $0.83 gives a target price of $12.8 for the end of 2022. This price target implies a 2.5% upside from the January 28 closing price. The following table shows the sensitivity of the target price to the P/E ratio.
| P/E Multiple | 13.5x | 14.5x | 15.5x | 16.5x | 17.5x |
| EPS – 2022 ($) | 0.83 | 0.83 | 0.83 | 0.83 | 0.83 |
| Target Price ($) | 11.1 | 12.0 | 12.8 | 13.6 | 14.5 |
| Market Price ($) | 12.5 | 12.5 | 12.5 | 12.5 | 12.5 |
| Upside/(Downside) | (10.8)% | (4.1)% | 2.5% | 9.1% | 15.7% |
| Source: Author’s Estimates |
Equally weighting the target prices from the two valuation methods gives a combined target price of $12.6, which implies a 0.6% upside from the current market price. Adding the forward dividend yield gives a total expected return of 4.7%.
In my last report on Heritage Commerce, which was published after the second quarter’s results, I adopted a bullish rating on the company. Since the issuance of that report, the stock price has rallied to reach a point quite close to the target price. Therefore, I’m now downgrading Heritage Commerce to a Hold rating.
Be the first to comment