

imaginima/E+ via Getty Images
Oil and gold must both move inversely to the real yield (Treasury inflation-protected securities or TIPS are a good indicator) for reasons I explain more fully in this Seeking Alpha post which summarizes the theory behind the valuation approach. The main current determinant of the real yield, which should match real long-term per capita GDP growth, is the degree of excess financial capital made available by the Fed. Chart 1 shows how Fed-created excess capital crushed the real yield and bond yields in general – too much capital cannot earn the same real return.
Chart 1: (Author using St. Louis Fed data) Fed Balance Sheet (Money Creation) vs TIPS Yield
Fed assets and TIPS (St Louis Fed)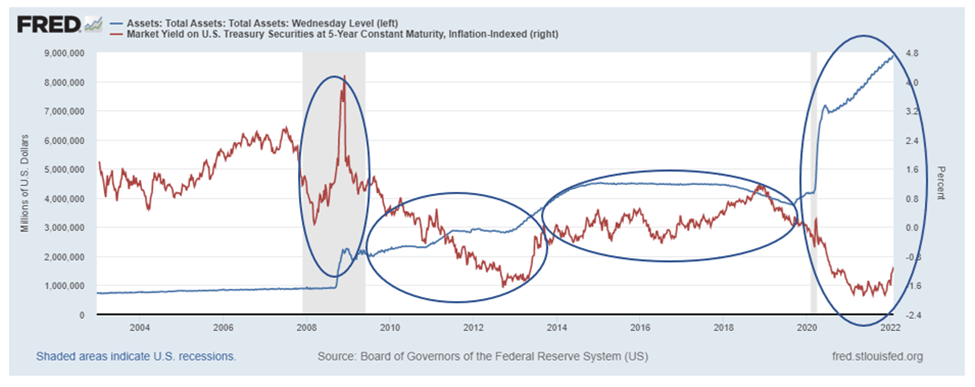
Oil
Chart 2 shows a nearly 20-year pricing model for oil. In simple form, the model I use to value oil takes the resulting yield created from the formula: [(expected inflation + expected real long-term per capita productivity growth)/(1 – the expected effective tax rate on tax-deferred investment accounts)] – TIP 5-Year (real) yield. The real yield is subtracted, which if negative, adds to the yield in the formula. Thus, oil is expected to move up with an increasingly negative real yield; and down with a rising real yield and expected inflation. Expected real per-capita GDP growth is just above 1% and can be derived from forecasts on the Conference Board web site.
Chart 2: (Author) Predicted vs Actual USD$ WTC Oil Price
Oil predicted value (Author)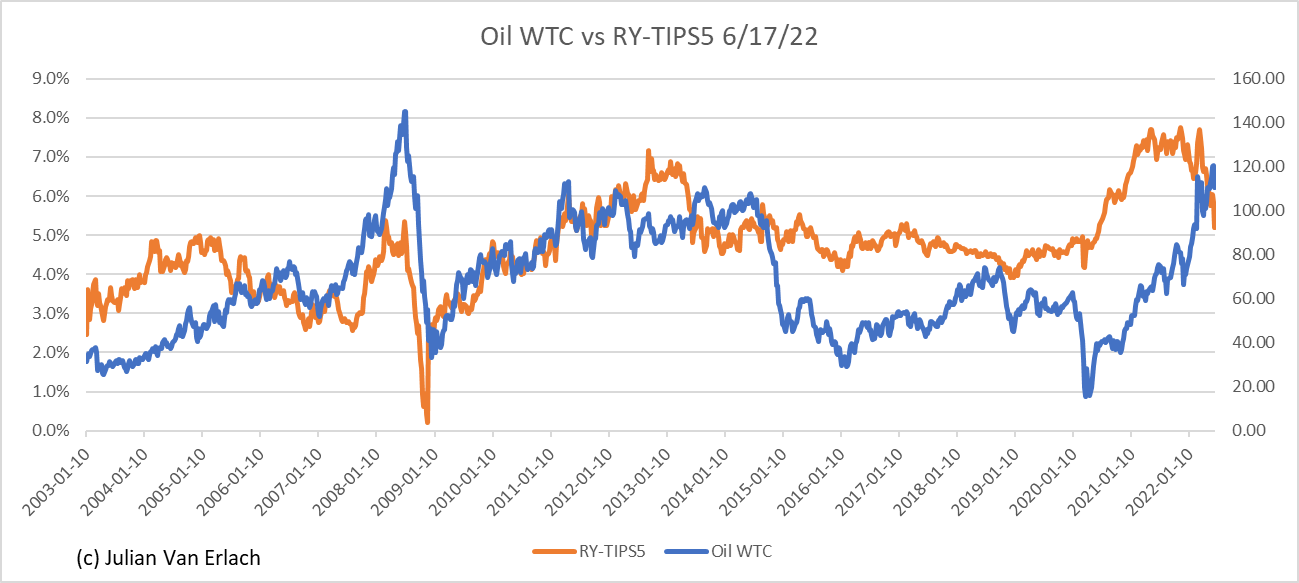
Oil is of course also a global commodity, and a flow rather than a stock, which gold is for example. As a global commodity, it is influenced by supply/demand fluctuations, political events, and other global financial factors. Note that in Chart 3 which shows the price of oil vs supply and demand imbalances, that during 2004-05, the price of oil rose in the face of excess supply, and then fell in the face of a deficit in early 2006. This directly corresponds to what my model predicts, despite the contrary supply/demand indications.
The model works extremely well and indicates that oil is due for a large fall, independent of any likely negative effects from a recession. Supporting influences are the apparent tight global supply and regional wars; but I expect fundamental principles to win out in coming months.
Chart 3: (Labyrinth Consulting) Oil Price vs Supply and Demand Imbalance
Oil price vs supply and demand (Labyrinth Consulting)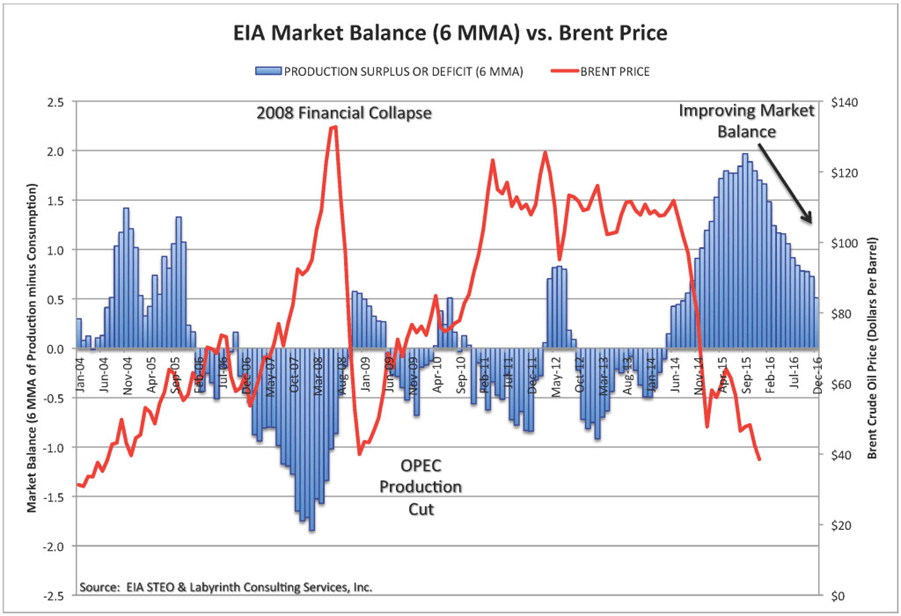
Gold
The value of gold increases at the rate of world nominal GDP per capita in the long term because its above ground stock increases at the rate of population growth (details in my linked post above). It is also affected by exchange rates weighted by relative size of economies. The rest of the valuation is the same as for oil; and thus, subject to downside from increasing real yields. Like oil, the price of gold seems excessive which is likely caused by global uncertainties. As for oil, I expect fundamental valuation factors to dominate, downward if the Fed stays its announced course. A second risk is falling inflation expectations as money supply stabilizes and the effect of pending inventory liquidations as reported by ZeroHedge take effect in coming quarters.
Chart 4: (Author) Gold (AU) USD$ Price vs Predicted Value
Predicted price of gold (Author)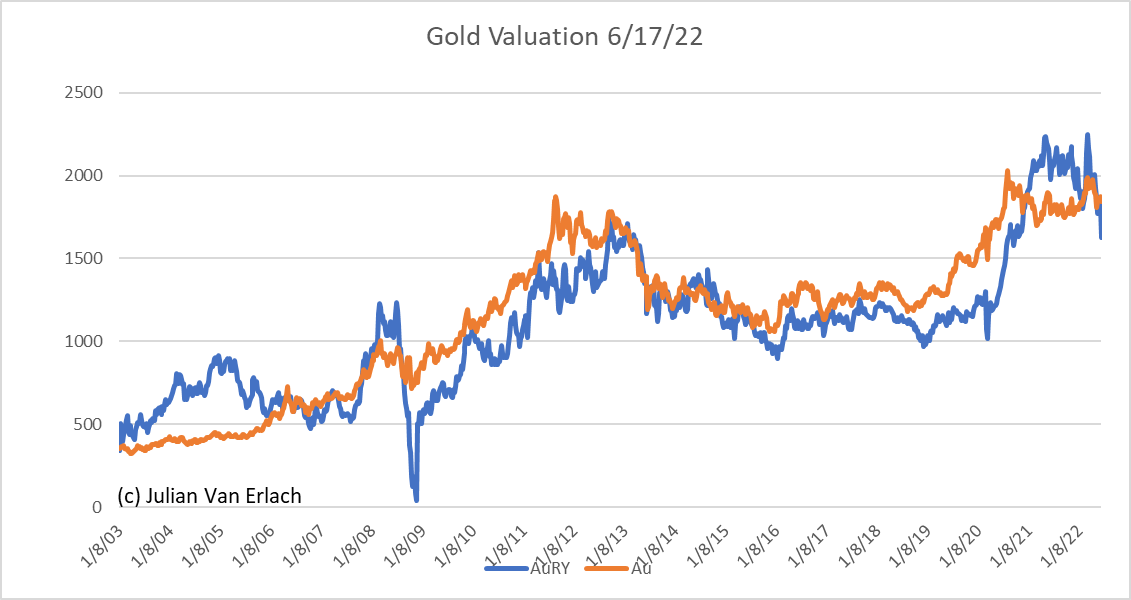
Be the first to comment