

gavran333/iStock via Getty Images
Introduction
I always like to start my articles by reviewing any previous coverage I’ve had of a stock. In Ball Corporation’s (NYSE:BALL) case, I have only written one previous article. It was published about three years ago, was titled “Ball Corporation: A 10-Year, Full-Cycle Analysis“, and it was a “Sell” article. Here is what I had to say:
…we get an expected 10-year, full-cycle CAGR of +0.44%. This is significantly below the 4% threshold I use for a “Sell” rating, so Ball Corp. is currently a “Sell” for me…
…My current suggestion is that owners of Ball Corp. who would like to avoid part of the eventual correction in the stock rotate out of it and into a 50/50 mix of the Invesco S&P 500 Low Volatility ETF (SPLV) and the Invesco S&P 500 Equal Weight ETF (RSP) until Ball stock’s price falls to a more reasonable level that offers better forward returns.
Interestingly, during the three years since I wrote that article, there hasn’t been a single “Sell” article published on Seeking Alpha for Ball stock. Here is how Ball has performed compared to SPY, RSP, and SPLV since the article was published.
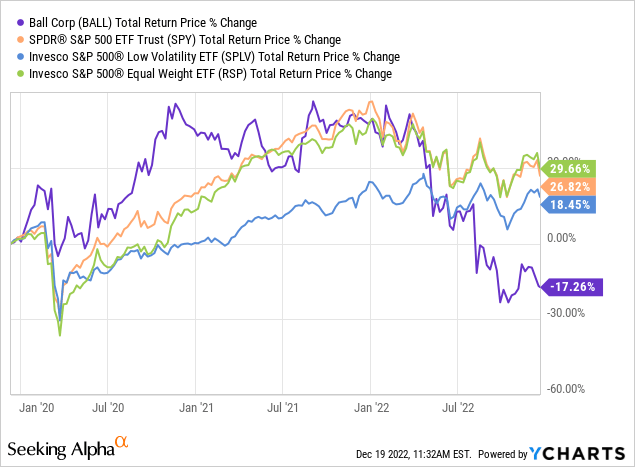
Ball stock continued to get even more overvalued for the next 12-24 months (likely a fairly big beneficiary of the pandemic and stimulus money that was issued). Now the stock price has corrected and is significantly underperforming the S&P 500, as well as the two alternatives I suggested in my last article.
Sometimes I write articles that are “pure warning” articles about some specific problems with a business or stock (a stock like Carnival (CCL) comes immediately to mind). But most of the time I write about high-quality businesses that I would like to own myself if the valuation was attractive. Many times, however, over the past few years, high-quality businesses were extremely overvalued. So overvalued that if I had owned them myself, I would have sold them based on valuation alone. That was the case with my “Sell” rating for Ball back in 2019.
Even using this year’s depressed earnings, Ball’s earnings are still higher than they were in 2019, yet the stock price has fallen quite a bit. This creates a situation where it makes sense to check in on the valuation of the stock to see if it has improved enough to potentially buy the stock. And that’s what I’ll do in this article, using the same basic process I used in the article three years ago that correctly labeled Ball stock a sell over the medium-term.
My Valuation Method For Ball Corporation
The valuation method I use for Ball first checks to see how cyclical earnings have been historically. Once it is determined that earnings aren’t too cyclical, then I use a combination of earnings, earnings growth, and P/E mean reversion to estimate future returns based on previous earnings growth and sentiment patterns. I take those expectations and apply them 10 years into the future, and then convert the results into an expected CAGR percentage. If the expected return is high, I will buy the stock, and if it’s really low, I will often sell the stock. In this article, I will take readers through each step of this process.
Importantly, once it is established that a business has a long history of relatively stable and predictable earnings growth, it doesn’t really matter to me what the business does. If it consistently makes more money over the course of each economic cycle, that’s what I care about the most.
FAST Graphs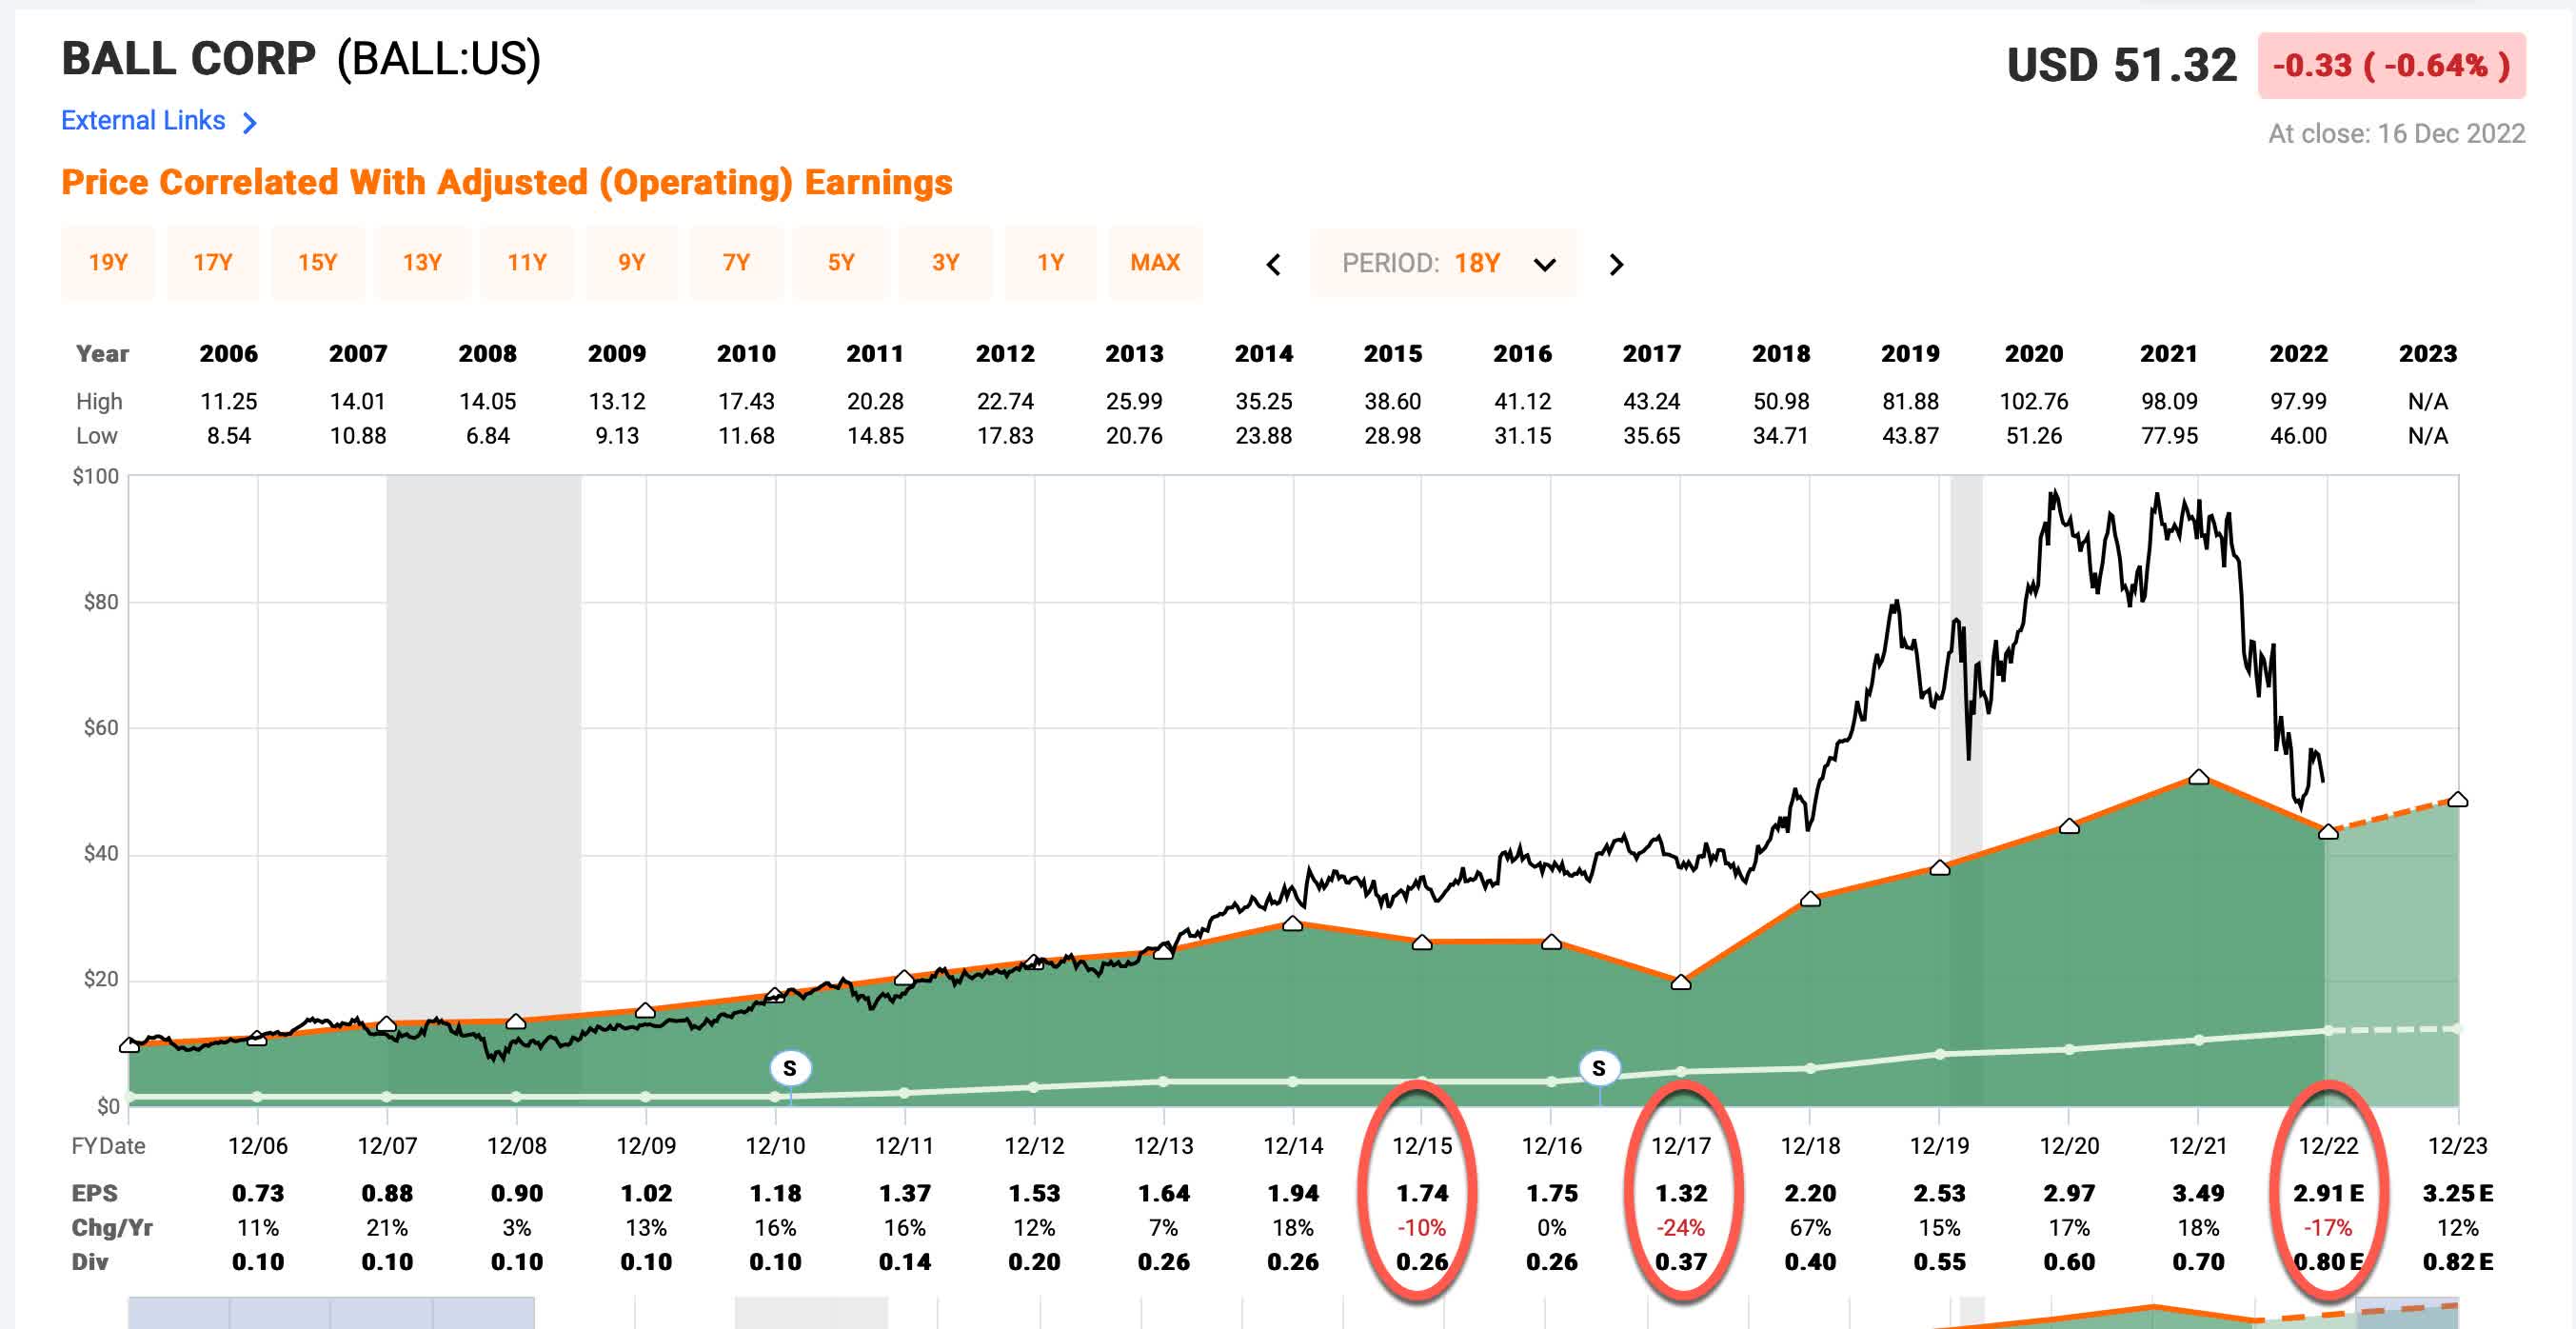
Over the past 20 years, Ball has only had three years of negative EPS growth. What is interesting here are the years in which earnings growth declined (perhaps with the exception of this year) are not the years a person might initially expect. Ball managed to grow EPS during the Great Recession in 2008, which is impressive, but the period from 2015 to 2017 was rough for them, which had a total peak to trough EPS drop over -30%. (They did have some M&A during this period, which could potentially explain some of the decline.) But by 2018 and 2019, the earnings growth trend had mostly recovered.
All-in-all, even including that rough patch from 2015-2017, Ball has only been a moderately cyclical business. Since earnings don’t tend to fluctuate a lot, it is appropriate to use an earnings and earnings growth based valuation process, which is what I’ll do in this article. (If earnings had been more deeply cyclical, I would have used a different valuation technique.)
Ball’s Market Sentiment Return Expectations
In order to estimate what sort of returns we might expect over the next 10 years, let’s begin by examining what return we could expect 10 years from now if the P/E multiple were to revert to its mean from the previous economic cycle. Typically, for my sentiment mean reversion expectation, when I choose the time-frame from which to calculate a stock’s average P/E, I start around the year 2015, but because Ball has experienced an atypical earnings drawdown during that period, and because it has been really overvalued the past few years, I think it makes sense to take a longer time-frame that goes back to 2007, before the last significant recession in 2008.
FAST Graphs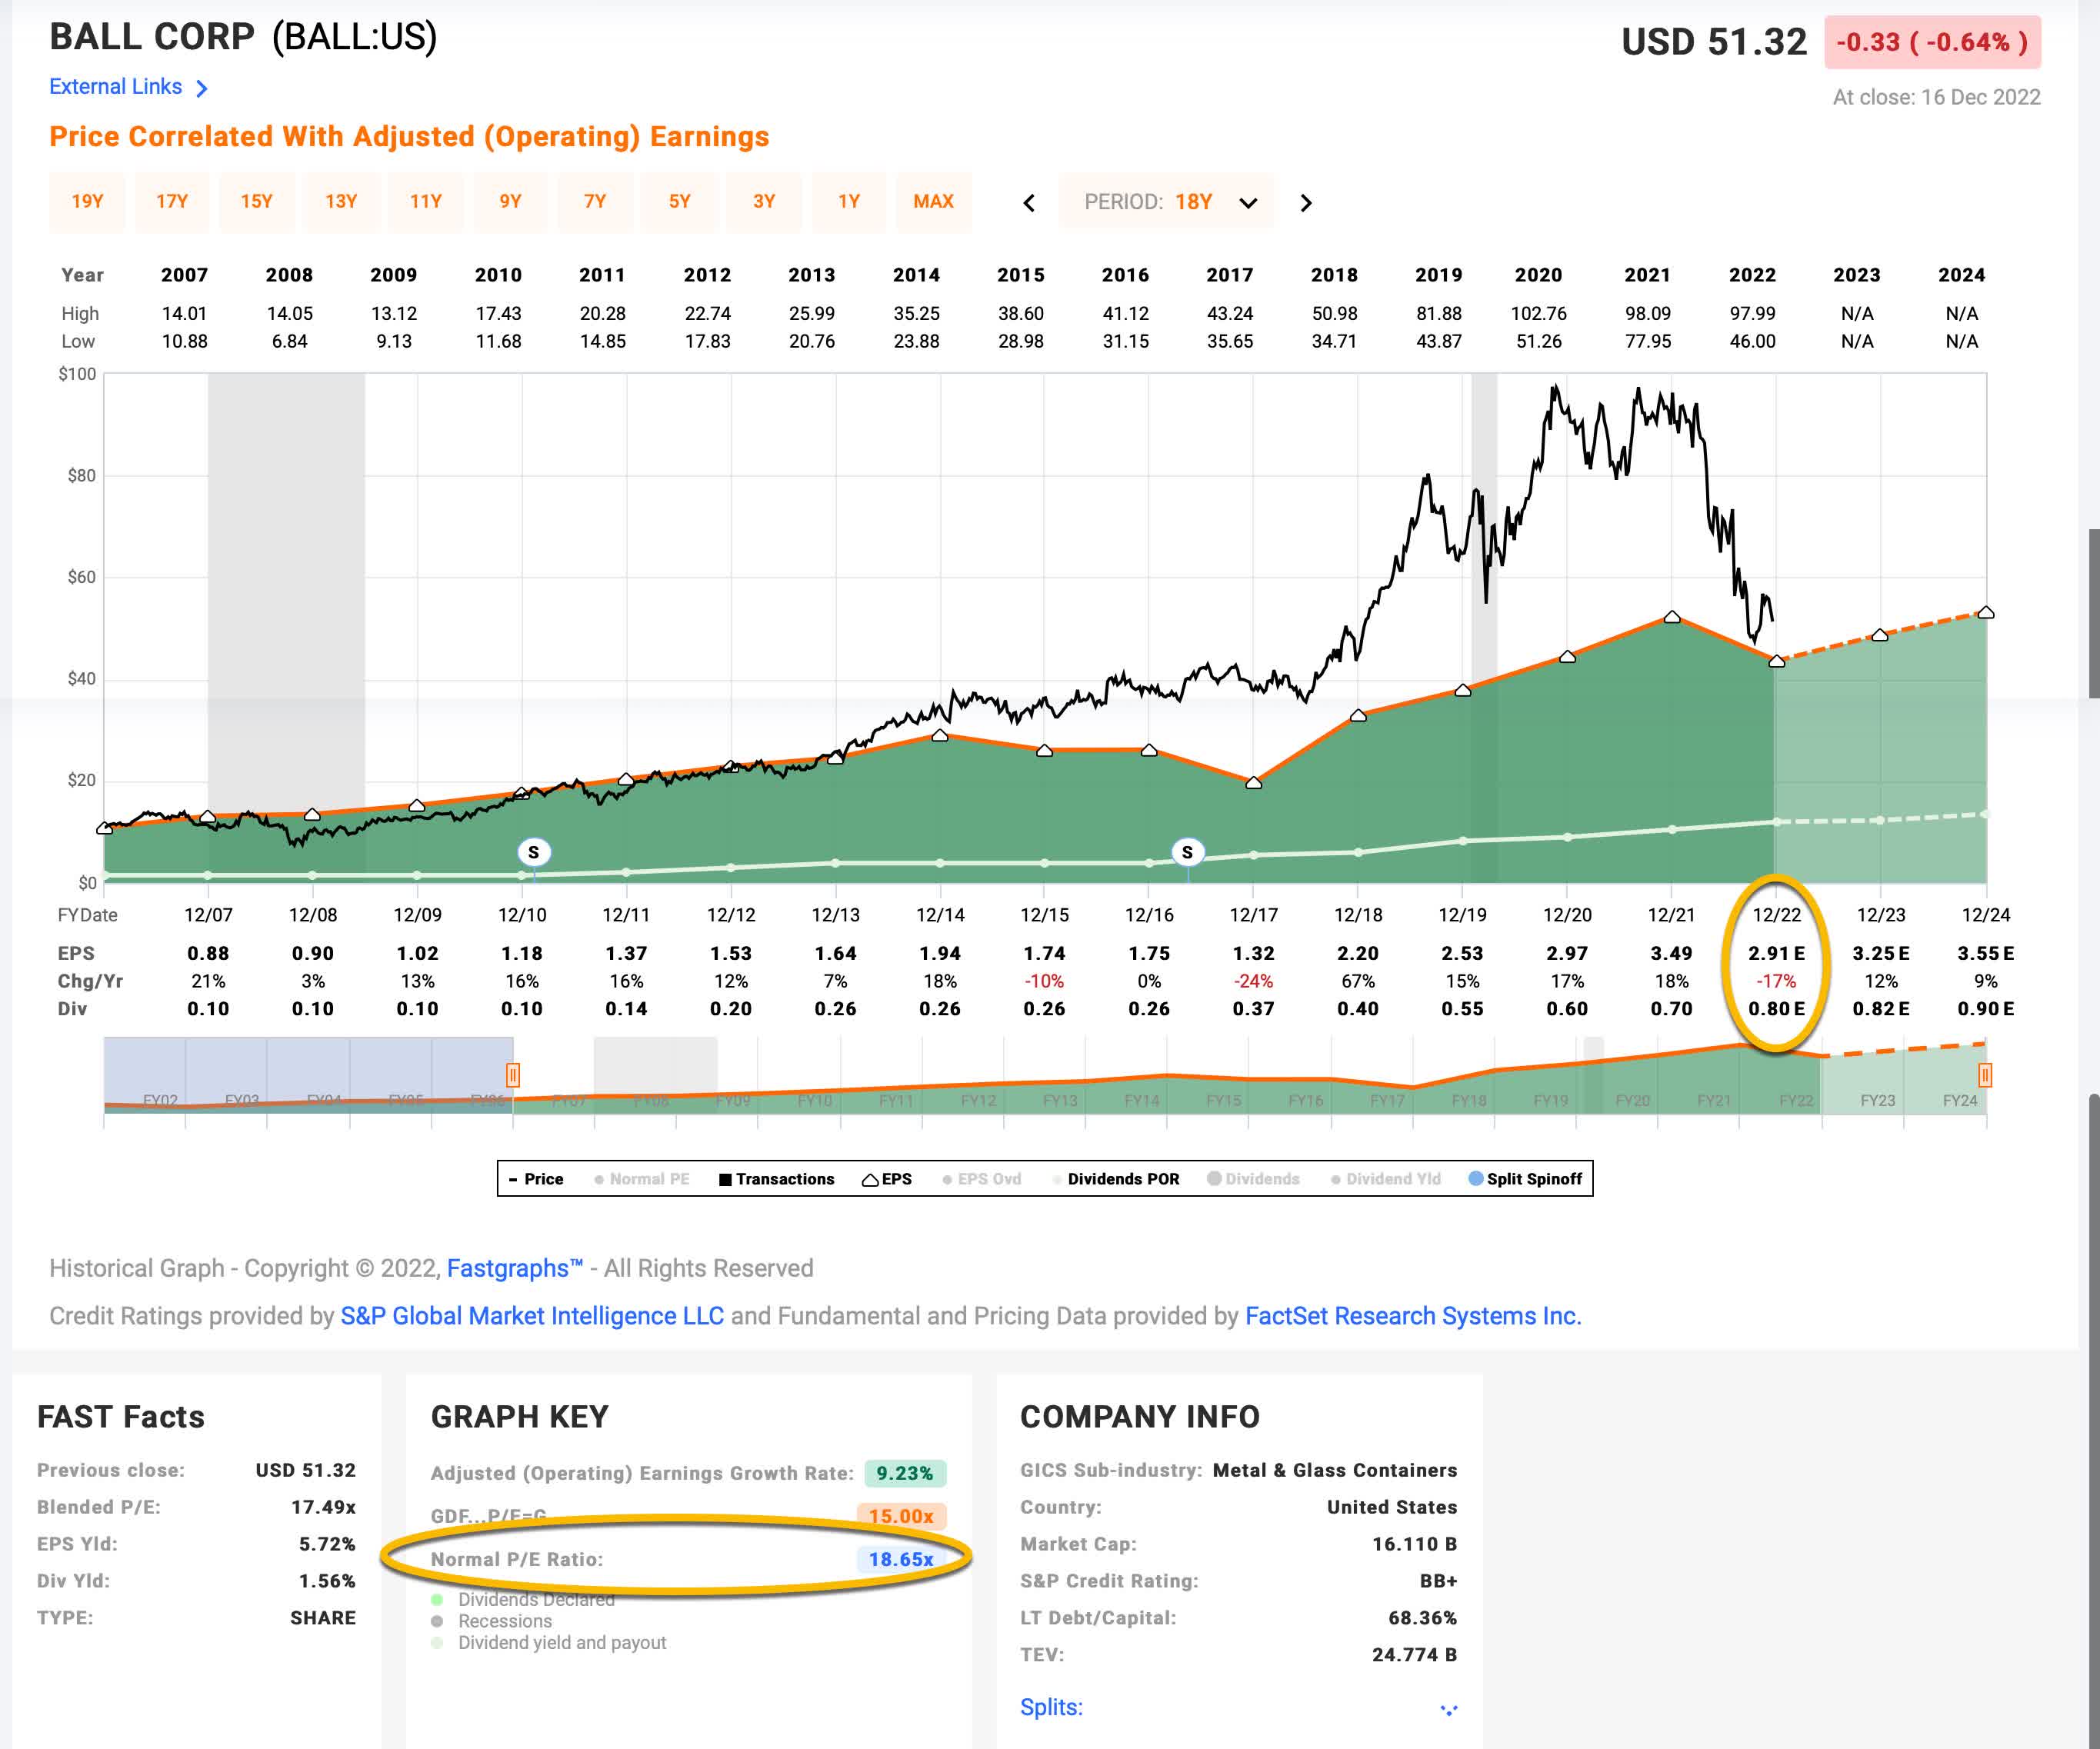
Ball’s average P/E from 2007 to the present has been about 18.65 (the blue number circled in gold near the bottom of the FAST Graph). Using 2022’s forward earnings estimates of $2.91, Ball has a current P/E of 17.39. If that 17.39 P/E were to revert to the average P/E of 18.65 over the course of the next 10 years and everything else was held the same, Ball’s price would rise and it would produce a 10-Year CAGR of +0.70%. That’s the annual return we can expect from sentiment mean reversion if it takes 10 years to revert. If it takes less time to revert, the annual return would be higher.
Business Earnings Expectations
We previously examined what would happen if market sentiment reverted to the mean. This is entirely determined by the mood of the market and is quite often disconnected, or only loosely connected, to the performance of the actual business. In this section, we will examine the actual earnings of the business. The goal here is simple: We want to know how much money we would earn (expressed in the form of a CAGR %) over the course of 10 years if we bought the business at today’s prices and kept all of the earnings for ourselves.
There are two main components of this: the first is the earnings yield and the second is the rate at which the earnings can be expected to grow. Let’s start with the earnings yield (which is an inverted P/E ratio, so the Earnings/Price ratio). The current earnings yield is about +5.75%. The way I like to think about this is, if I bought the company’s whole business right now for $100, I would earn $5.75 per year on my investment if earnings remained the same for the next 10 years.
The next step is to estimate the company’s earnings growth during this time period. I do that by figuring out at what rate earnings grew during the last cycle and applying that rate to the next 10 years. This involves calculating the historical EPS growth rate, taking into account each year’s EPS growth or decline, and then backing out any share buybacks that occurred over that time period (because reducing shares will increase the EPS due to fewer shares).
Ball had some pretty big M&A in 2016, so, I’m going to use a time-frame from 2017 through 2022 to calculate the earnings growth (It’s actually very similar to what I calculated since 2007, but I can avoid dealing with the M&A issues if I just start in 2017.)
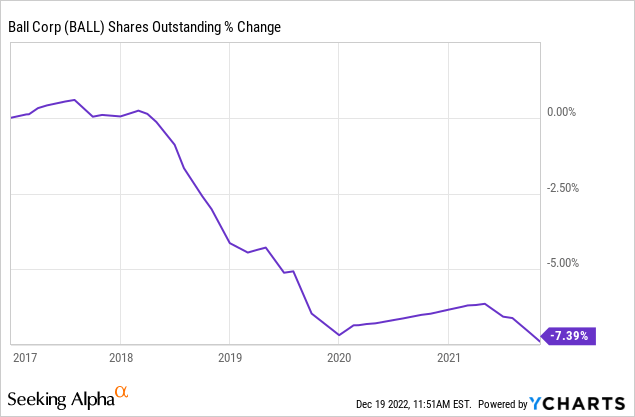
Since 2017, Ball has bought back about 7% of the company’s shares. I’ll control for those when making my earnings growth estimate. I will also account for the 2017 and 2022 EPS declines. After I do that I estimate an earnings growth rate of +7.58% (which is similar to the +8.06% earnings growth rate assumption I used back in my 2019 article).
Next, I’ll apply that growth rate to current earnings, looking forward 10 years in order to get a final 10-year CAGR estimate. The way I think about this is, if I bought Ball’s whole business for $100, it would pay me back $5.75 plus +7.58% growth the first year, and that amount would grow at +7.58% per year for 10 years after that. I want to know how much money I would have in total at the end of 10 years on my $100 investment, which I calculate to be about $187.84 (including the original $100). When I plug that growth into a CAGR calculator, that translates to a +6.51% 10-year CAGR estimate for the expected business earnings returns.
10-Year, Full-Cycle CAGR Estimate
Potential future returns can come from two main places: Market sentiment returns or business earnings returns. If we assume that market sentiment reverts to the mean from the last cycle over the next 10 years for Ball, it will produce a +0.70% CAGR. If the earnings yield and growth are similar to the last cycle, the company should produce somewhere around a +6.51% 10-year CAGR. If we put the two together, we get an expected 10-year, full-cycle CAGR of +7.21% at today’s price.
My Buy/Sell/Hold range for this category of stocks is: Above a 12% CAGR is a Buy, below a 4% expected CAGR is a Sell, and in between 4% and 12% is a Hold. Ball’s expected +7.21% makes the stock a “Hold” at today’s price, and basically right around the midpoint of fair value.
There are couple of ways Ball stock could eventually become a “Buy” for me. The first is if between now and their next earnings report this quarter’s expected earnings remain about where they are now while the stock price falls about -26.38% down to $37.26 per share. At that point, Ball’s return expectation would be above a 12% CAGR, and that would trigger a buy for me. Another way I could end up buying the stock is we get into 2023 and after the next earnings report, earnings estimates remain the same or are higher for 2023. Right now they are expected to rise by 12% to $3.25 per share. If that were to happen, my buy price would rise to between $41 and $42 per share. Given this time-frame is only a couple of months away, I think there is a decent chance this scenario could happen as well.
Conclusion
Good valuation analyses work most of the time, but valuation isn’t very predictive over the short-term, especially for periods of 12 months or less. While the market can rerate an overvalued stock at any time, often it takes two or three years, even five years sometimes, for the valuation to catch up and pull the stock price of a high quality business down. But just because a stock is overvalued enough to sell, doesn’t mean it’s a bad business. It just means that investors were willing to pay too much for the likely future earnings of the business. So, I am always willing to buy the stock of a good business at a good price, and I would be more than happy to buy Ball stock, assuming earnings hold, if the price drops another -26% from here.
The price has come down enough, and severely underperformed the S&P 500, that it’s valuation is now about average, and it can be held by investors who don’t mind average returns or who don’t see much else in the market that is any more attractive right now.
Be the first to comment