

Juan Jose Napuri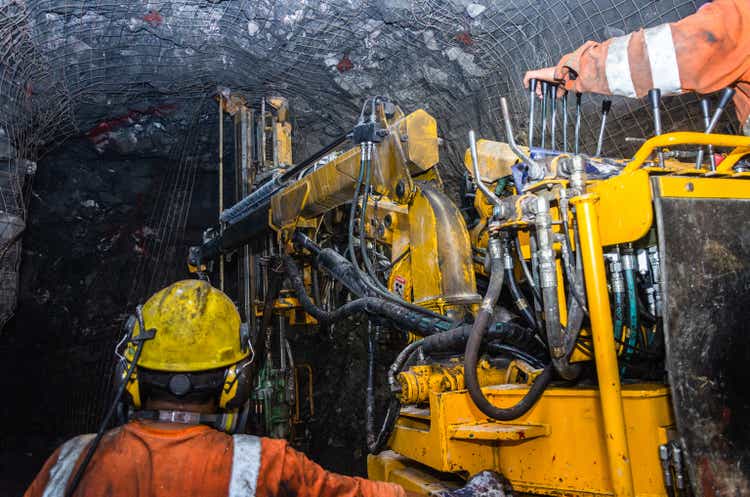
It’s been a mixed Q2 Earnings Season for the Silver Miners Index (GDX), with decent operational performance overshadowed by significant cost pressures. This had an outsized impact on margins for the silver miners, given that they were lapping much higher prices in the year-ago period. While Hecla (NYSE:HL) managed to maintain its 50% AISC margins in the quarter (silver segment), it did see increased costs and is guiding for higher costs at two mines due to accelerated spending/inflationary pressures. That said, HL is trading at one of its smallest discounts to net asset value since Q2 2020, suggesting any undercut of its July low ($3.44) should present a buying opportunity.
Hecla Operations (Company Presentation)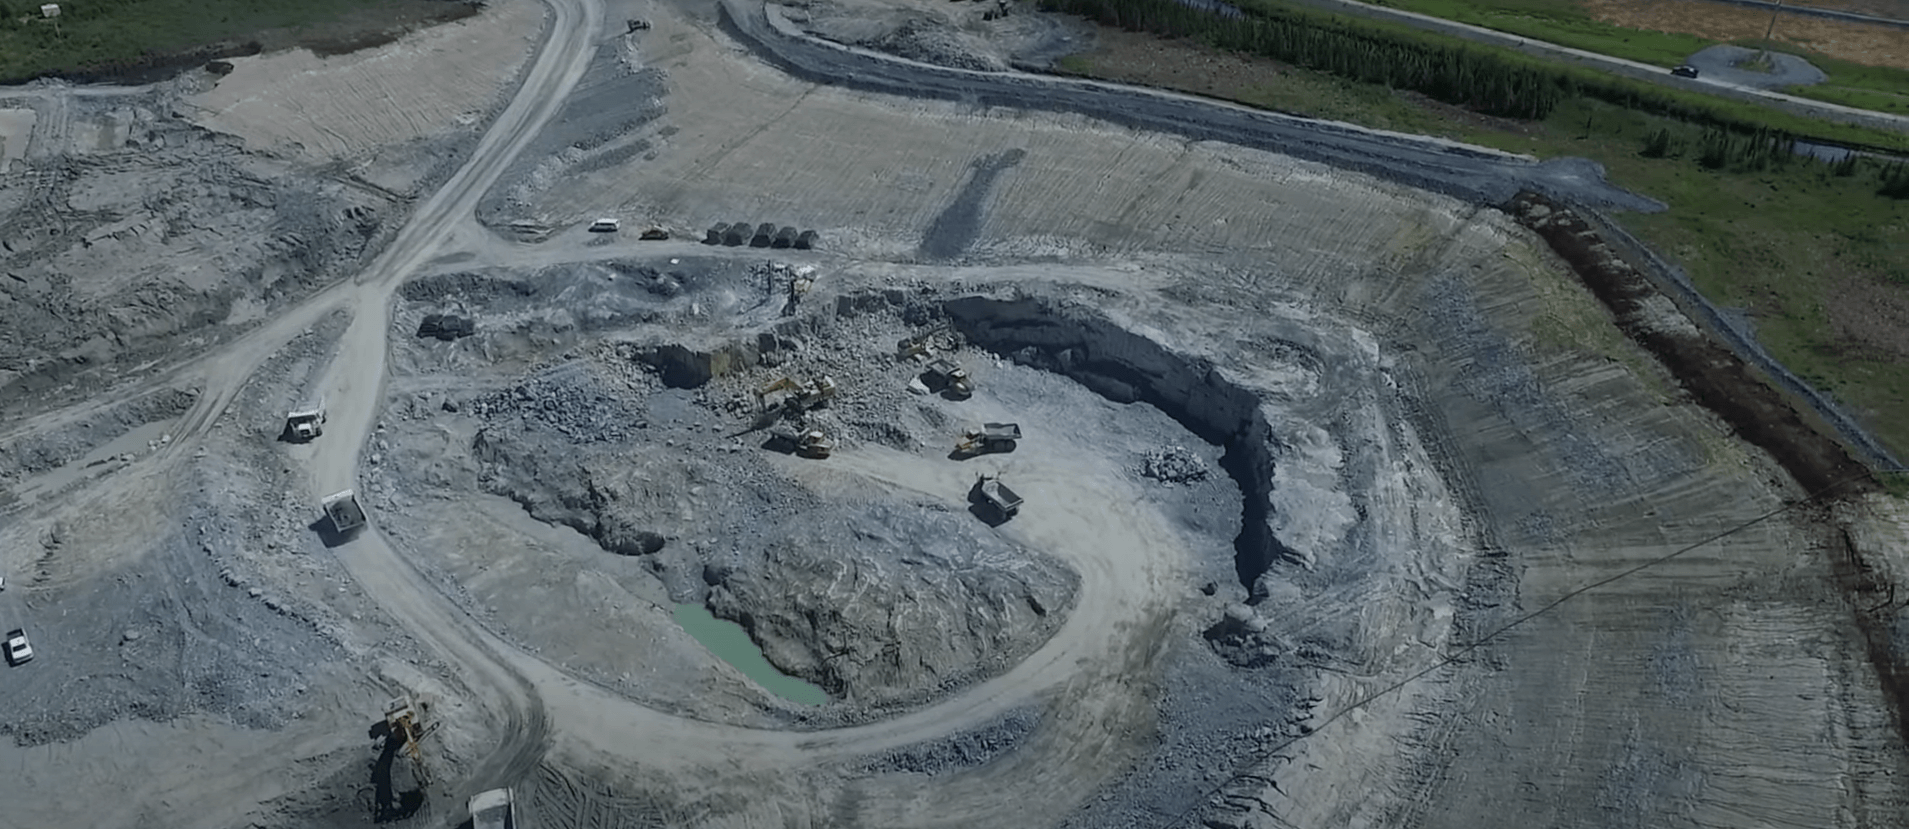
Q2 Production
Hecla released its Q2 results last month and had a solid quarter operationally, producing ~3.65 million ounces of silver and ~45,700 ounces of gold. This translated to a 3% increase in silver production year-over-year despite lapping production from its Nevada operations (now under care & maintenance), also impacting consolidated gold production, even with a higher production quarter at Casa Berardi (~33,300 ounces vs. ~31,300 ounces). While Green Creeks had a great quarter but saw lower production due to difficult year-over-year comps (~2.41 million ounces vs. ~2.56 million ounces), the star performer was Lucky Friday. Let’s take a closer look below:
Hecla – Quarterly Gold & Silver Production (Company Filings, Author’s Chart)
At Greens Creek, production came in at ~2.41 million ounces of silver and ~12,400 ounces of gold at industry-leading all-in sustaining costs of $3.48/oz. The lower production was related to lower throughput and slightly lower grades (14/oz per ton vs. 14.5/oz per ton). Hecla noted that it saw higher mining costs at the operation due to increased use of contractors, which isn’t surprising given the sector-wide labor shortages. Fortunately, while costs were up in the period ($3.48/oz vs. $0.68/oz), Hecla actually lowered cost guidance for the year to $6.50/oz at the mid-point, reflecting higher by-product credits (higher realized lead/zinc prices offset slightly lower tons produced in Q2).
Lucky Friday Production (Company Filings, Author’s Chart)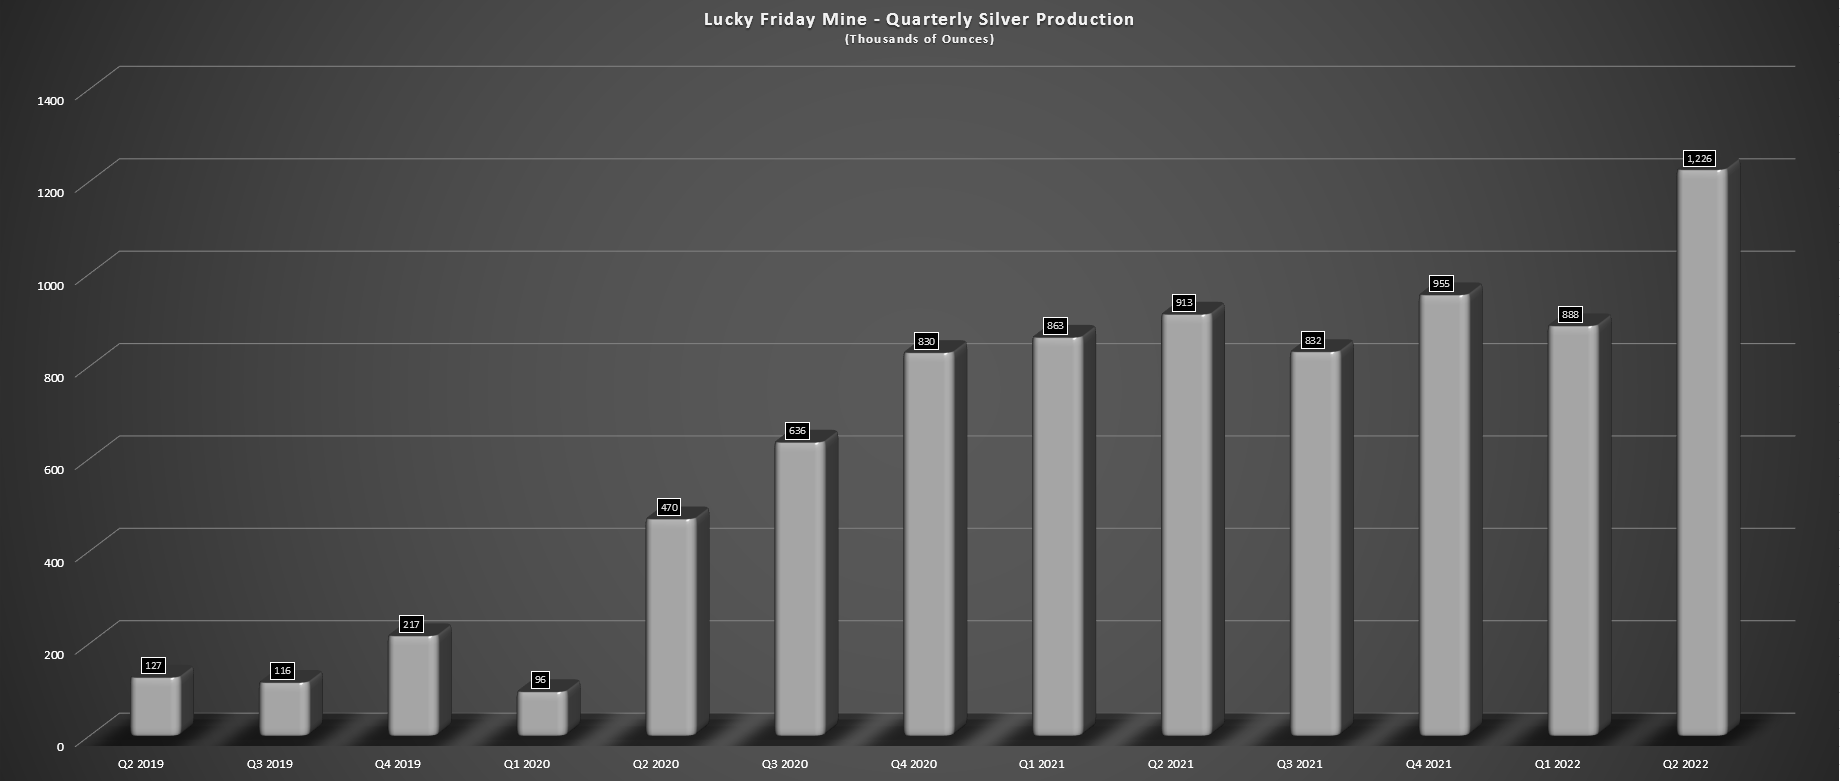
Moving to Lucky Friday, it was a blow-out quarter, and the company continues to see the benefits of its new mining method, Underhand Closed Bench, which mined 91% of tons in the period vs. 82% in the year-ago period. The higher throughput helped the company to report record mill throughput and better grades, with ~97,500 tons processed at 13.2 ounces per ton, well ahead of ~82,400 tonnes at 11.6 ounces per ton last year. This helped the asset report lower costs of $9.91/oz vs. $14.10/oz last year and generated quarterly free cash flow of $10.4 million despite much higher capital expenditures.
However, Lucky Friday was also impacted from a cost standpoint. While slightly higher by-product credits and higher production helped the company report lower AISC in the period, it experienced higher contractor costs due to workforce shortages. Unfortunately, this has led to a negative revision in costs, with Lucky Friday now expecting costs of $9.75/oz to $11.25/oz vs. $7.25/oz to $9.25/oz. The good news is that the company has not even begun optimizing its new mining method; instead, it is simply working on deploying it at a higher rate, suggesting that further productivity gains could be on deck.
Costs & Margins
Moving to costs & margins, Hecla saw a 13% increase in costs in its silver segment in the period, with all-in sustaining costs increasing from $7.54/oz (Q2 2021) to $8.55/oz. This is in line with what we’re seeing across the sector, so these increases are not company-specific. While Hecla benefits from hydropower, which reduces its volatility to energy prices, it has seen a sharp increase in steel, cyanide, labor, and contractor costs, with it being quite sensitive to labor which makes up ~50% of its cost base. The company noted that it expects much of these pressures to be sticky and doesn’t see the tight labor market easing in H2 2022.
Hecla – Changes In Key Inputs (Company Presentation)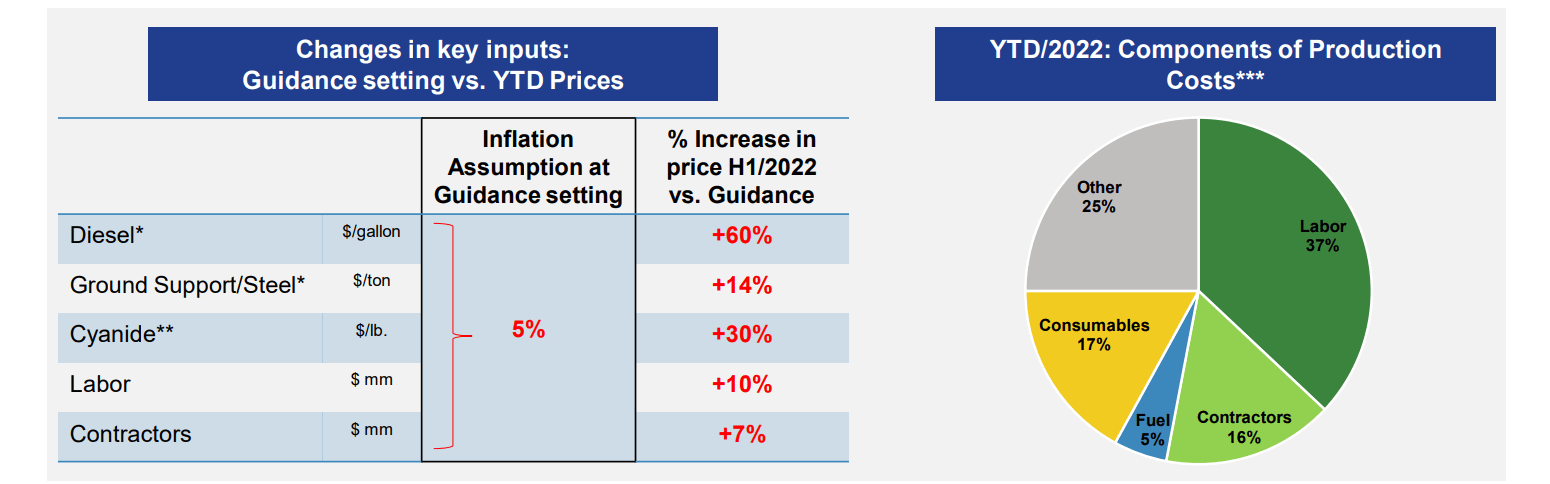
Unfortunately, this increase in costs from inflationary pressures and the tight labor market combined with a sharp decline in silver prices and negative provisional pricing led to a massive margin decline. The chart below shows that AISC margins fell from $19.60/oz to $12.13/oz ($20.68/oz vs. $27.14/oz). The good news is that most of this margin decline was from the price of silver, and Hecla’s cost profile remains exceptional, meaning it was meaningful leverage if the silver price can recover. So, while a 38% margin decline is hard to swallow, Hecla is still in great shape and isn’t reporting negative AISC margins like some of its peers.
Hecla – All-in Sustaining Costs & AISC Margins (Company Filings, Author’s Chart)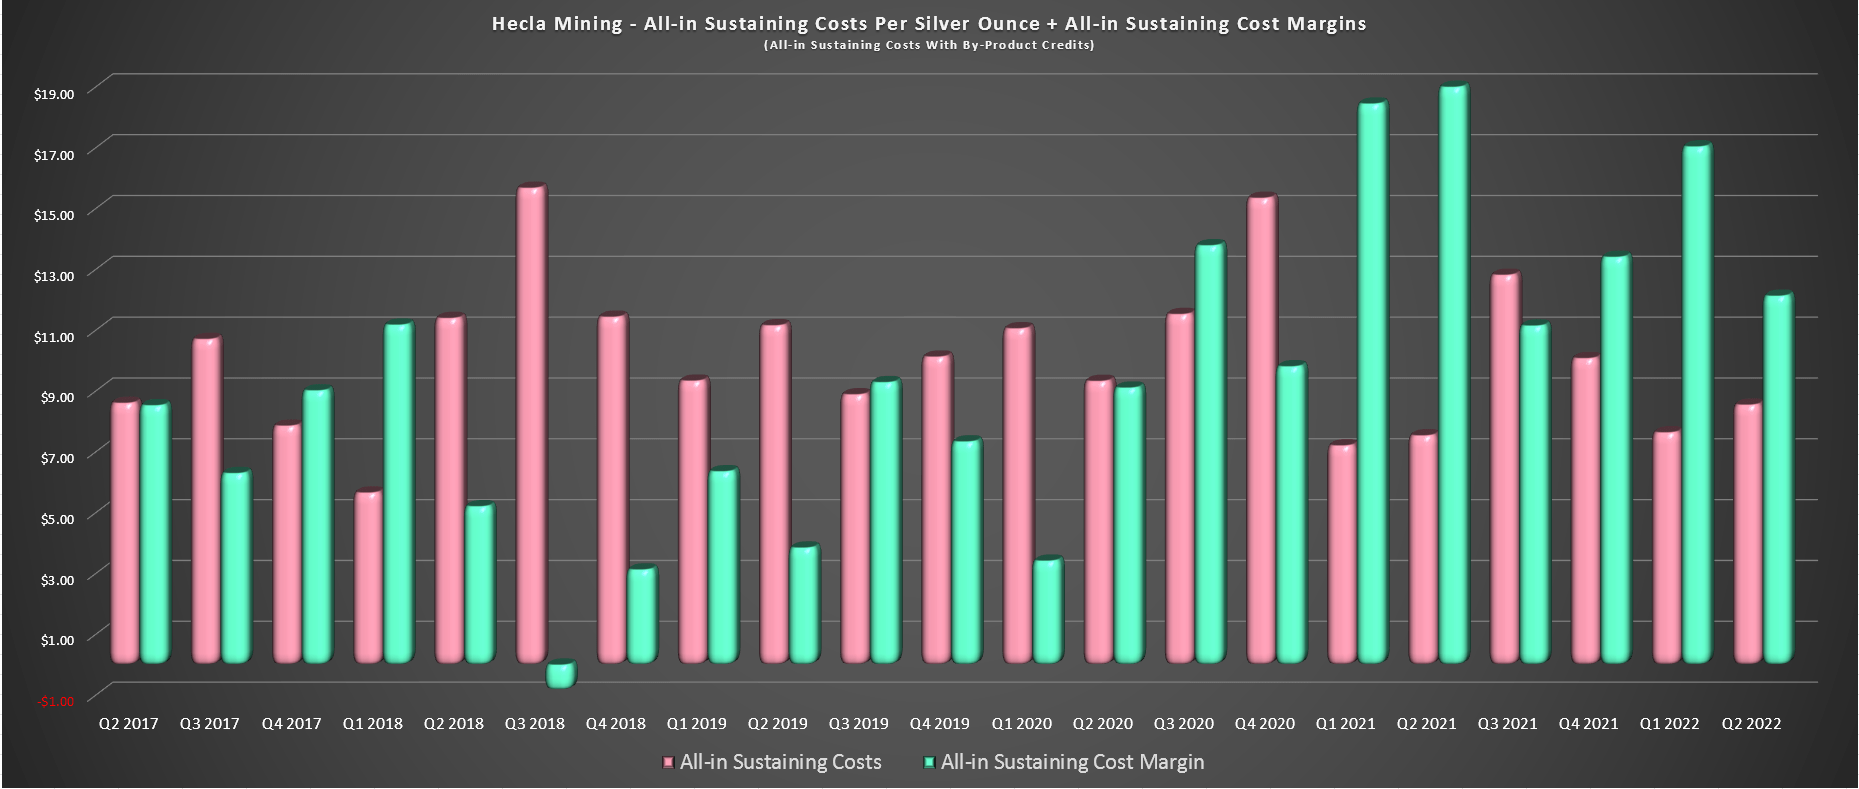
Unfortunately, the same was not true for Hecla’s gold business (Casa Berardi Mine), where all-in sustaining costs soared to $1,641/oz, with this being a relatively higher volume operation that doesn’t benefit from by-product credits. This translated to a 14% increase in costs year-over-year, and AISC margins slipped to just $231/oz in the period (12.3% AISC margins vs. 21.0%), despite an increase in the gold price to $1,872/oz. Given the inflationary pressures and a change in its tailing design, FY2022 AISC guidance has increased to an updated range of $1,550/oz to $1,775/oz, suggesting a much softer margin profile this year.
Casa Berardi Operations (Company Presentation)
Financial Results
As shown below, Hecla saw a 12% decline in revenue on a year-over-year basis, reporting revenue of $191.2 million vs. $218.0 million in the year-ago period. This is not surprising given that the company was lapping production from its Nevada operations (gold/silver) and tough comps with a $27.00/oz silver price and also suffered from negative provisional pricing. Fortunately, Lucky Friday’s impressive quarter picked up some of the slack. Plus, despite the plunge in silver prices to $20.68/oz on a realized basis, Hecla still generated quarterly free cash flow of ~$6.0 million.
Hecla – Quarterly Revenue & Average Realized Silver Price (Company Filings, Author’s Chart)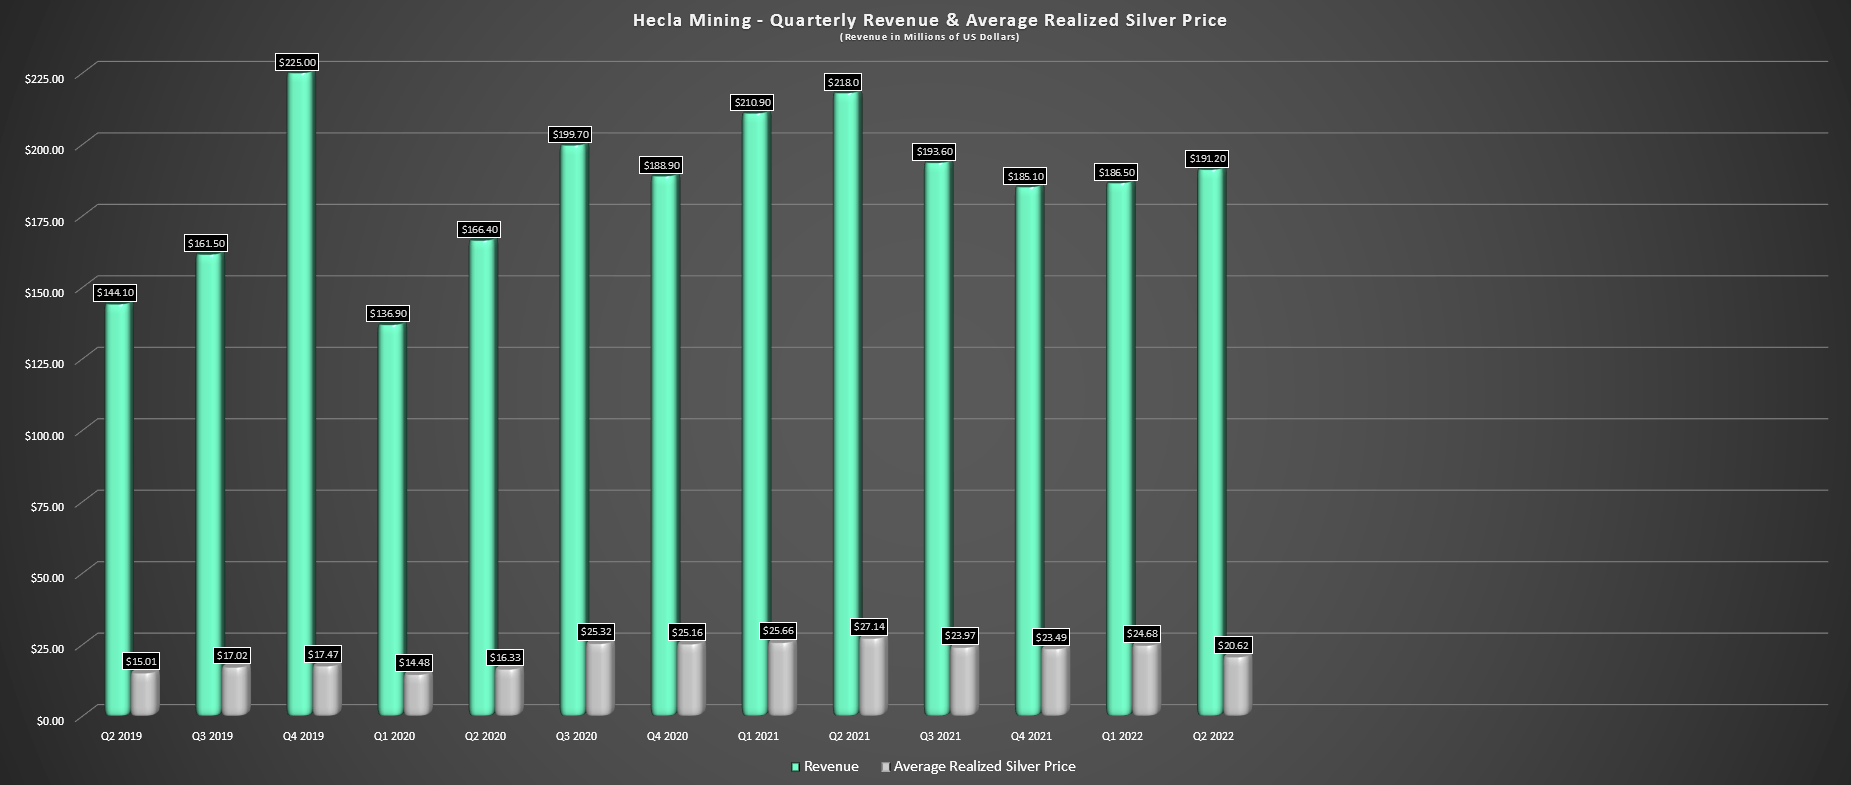
If we look at quarterly free cash flow and long-term debt, free cash flow declined considerably on a year-over-year basis, impacted by increased capital expenditures, higher operating costs, and lower silver prices. That said, I don’t think $20.00/oz silver prices are sustainable, given that several producers will have to rethink their operations within 18 months if prices stay this low. Besides, Alexco should see a boost to free cash flow by H2 2024 from Keno Hill as it works to optimize the operation, and the company believes its best decade could be ahead at Lucky Friday, an asset that continues to deliver above expectations. Let’s look at the valuation and see if this negative guidance revision from a cost standpoint is priced into the stock:
Hecla – Cash, Long-Term Debt & Free Cash Flow (Company Filings, Author’s Chart)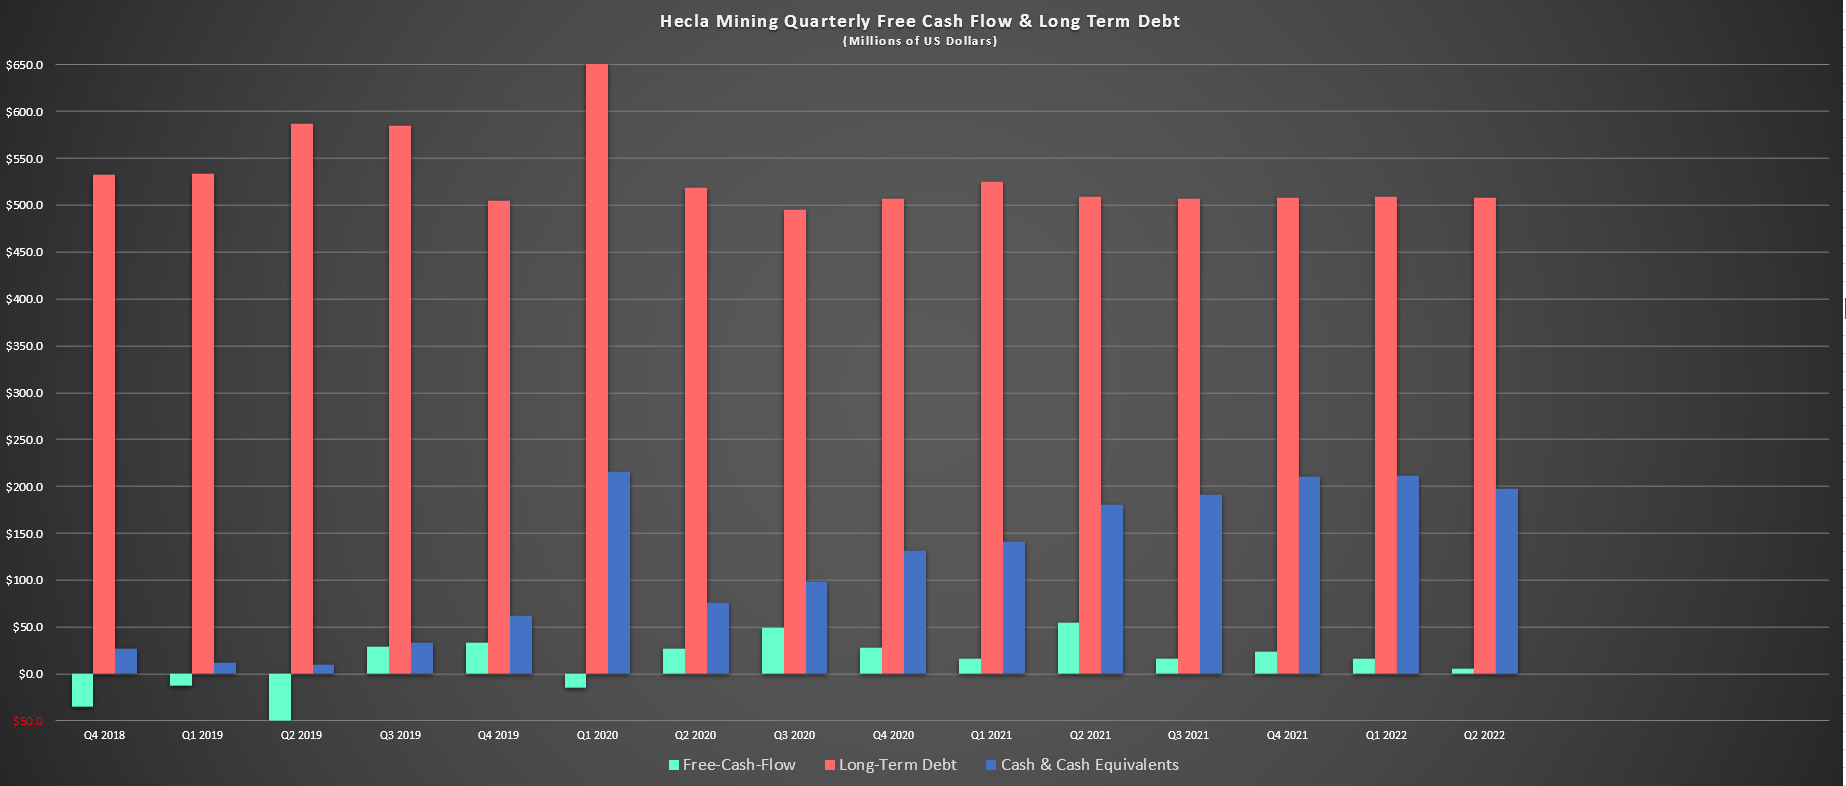
Valuation & Technical Picture
Based on the estimated share count post-Alexco (AXU) acquisition and a share price of $4.25, Hecla trades at a market cap of ~$2.52 billion. This compares favorably to Hecla’s estimated net asset value of ~$2.2 billion, with Hecla trading at only a slight premium to net asset value vs. a massive premium when I warned against owning the stock last year at US$6.40. While I generally prefer to buy at a discount to net asset value, there is a reason that Hecla trades at a premium to the sector, benefiting from leverage from the silver price with a cost profile that allows it to weather downturns in silver prices. It also has a solid reserve base, which many of its silver peers lack.
HL Weekly Chart (TC2000.com)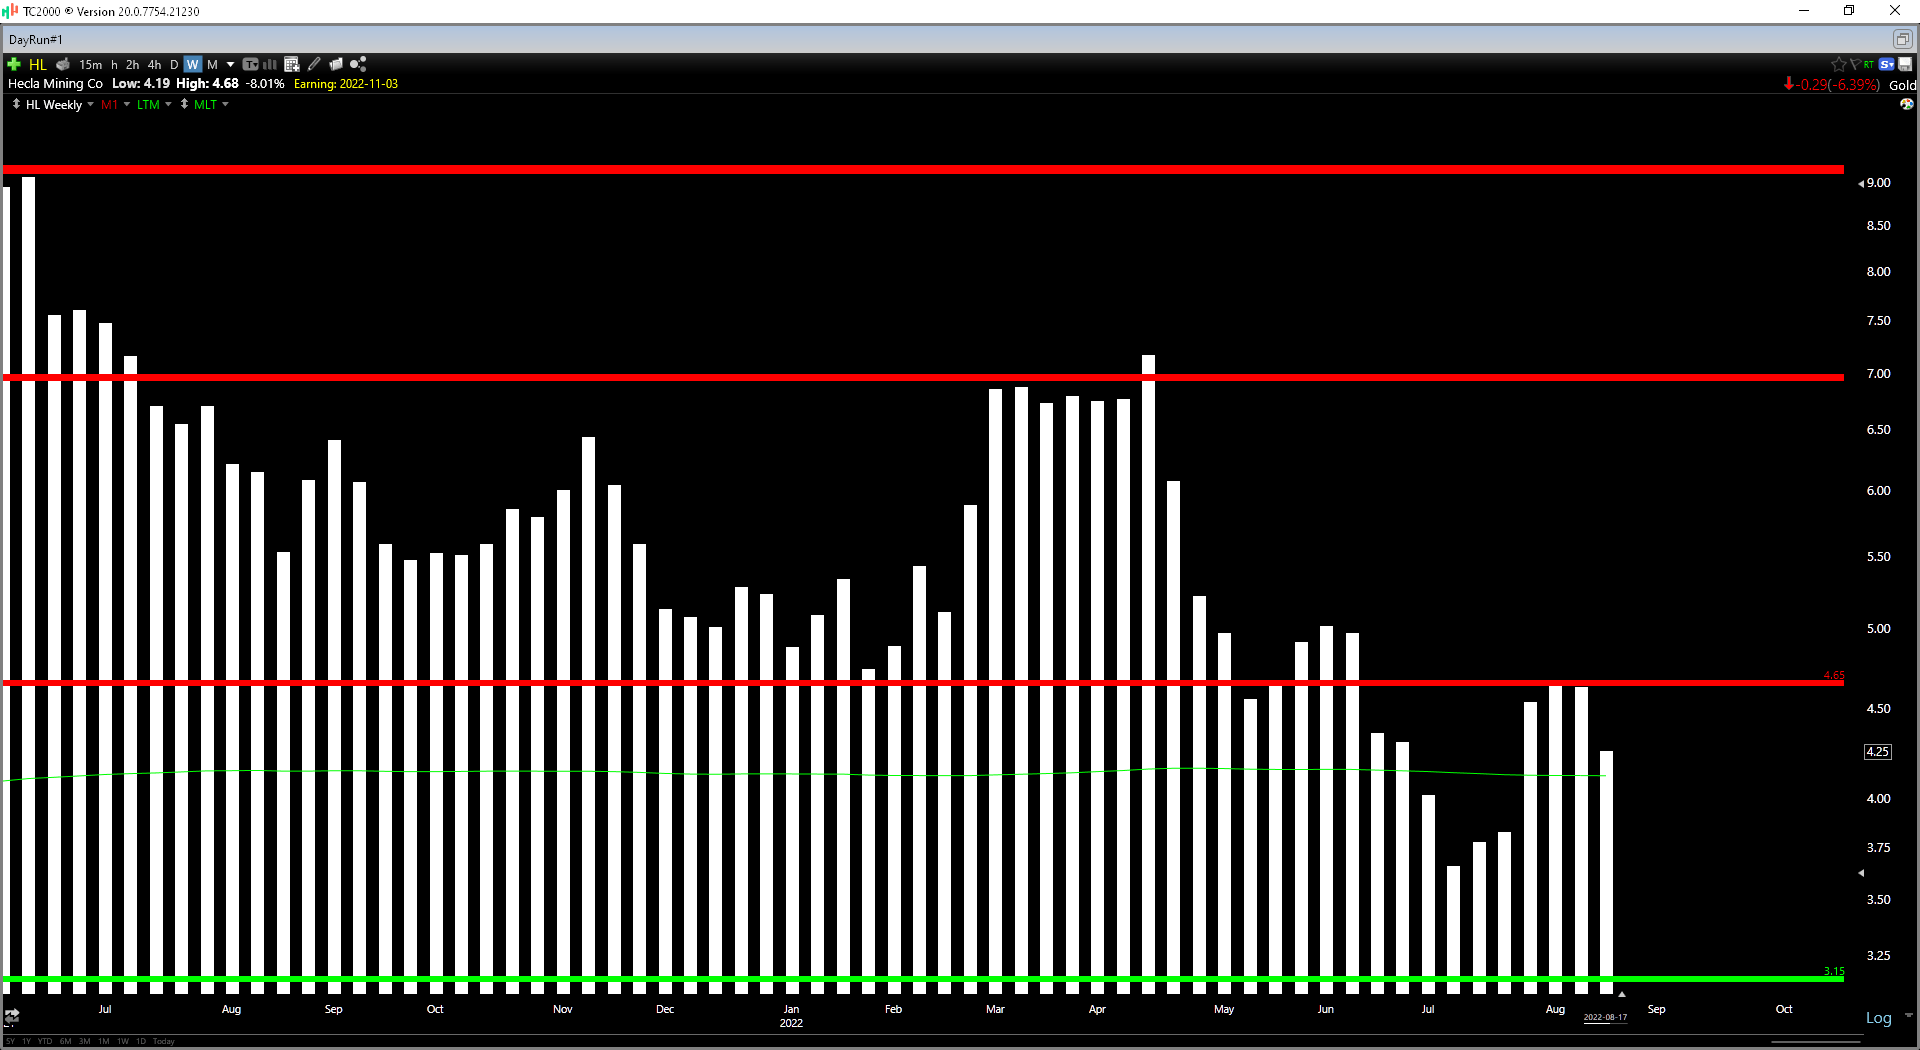
However, while the valuation has improved considerably, the stock is sandwiched between lower resistance at $4.65 and no strong support until $3.15. This doesn’t mean that the stock must travel all the way down to support at $3.15, but I prefer to buy in the lower end of a trading range, especially when a sector is in a cyclical bear market. Based on a required 6 to 1 reward/risk ratio for starting new positions, Hecla would need to dip below $3.35 to become interesting from a reward/risk standpoint. There are no guarantees that the stock heads this low, but this is where the best buying opportunity appears to lie, where the stock would move onto an oversold condition.
Summary
Hecla had a solid quarter operationally but was stung by things out of its control (lower silver prices, inflationary pressures, negative price adjustments to provisional settlements). These inflationary pressures have also led to a negative revision in cost guidance. However, while this is disappointing, Hecla is still one of the lowest-cost producers and can easily weather further weakness in silver prices if things worsen. With the stock now trading at just ~1.1x P/NAV and having one of the best track records of reserve replacement among its silver peers, I would view any pullbacks below $3.35 as low-risk buying opportunities.
Be the first to comment