

ricardoreitmeyer/iStock via Getty Images
What is not to love about healthcare stocks? Historically, they have consistently outperformed the S&P 500, especially during recessions. With such a strong offense and strong defense, you can bet on them and almost never lose. It sounds almost too good to be true. But, that is the stock market for you. See, the stock market is a giant market for companies that you can buy into, and history shows that if you patiently buy a portion of everything in that market, over time, you will make substantially more money than if you had lent it to the government and, most importantly, substantially more money than your neighbor with his stupid new boat. If the stock market can exist, why can’t something even more stock market-y than the stock market exist, too? The good news is that it does, or at least has, in the form of the healthcare sector. Nevertheless, I think now is probably a bad time to buy into this story and specifically the Health Care Select Sector SPDR Fund (NYSEARCA:XLV), which is the vehicle most commonly used to gain broad access to healthcare stocks.
There are a number of reasons to be bearish.
1. Healthcare stocks are ‘undersold’. We are likely in the early stages of a cyclical bear market/recession, and defensive sectors have never been entirely immune to bear markets.
2. High PEs and low dividend yields point to low long-term returns for the healthcare sector.
3. Healthcare stocks tend to underperform other sectors over the long-term when the energy sector outperforms.
4. The structural outperformance of the healthcare sector alluded to in the paragraph above is likely artificial and, therefore, unsustainable. Indeed, the engine behind the outperformance of the healthcare sector might be driving real social and economic imbalances in the population which may ultimately produce a structural drag on future sector returns.
There are reasons to be positive about the sector, however.
5. Healthcare stocks have consistently outperformed the S&P 500 during cyclical bear markets, which we are likely in now.
6. The structural forces behind the outperformance of the healthcare sector outlined in Point 4 above have shown themselves to be, if unsustainable, powerful and resilient.
The bulk of this article will be an attempt to demonstrate these points or, if space does not permit, to briefly recap findings I have recorded elsewhere on Seeking Alpha.
Let’s begin by taking our bearings.
Nuts and bolts
The following chart shows the relative performance of XLV to the S&P 500 ETF (SPY).
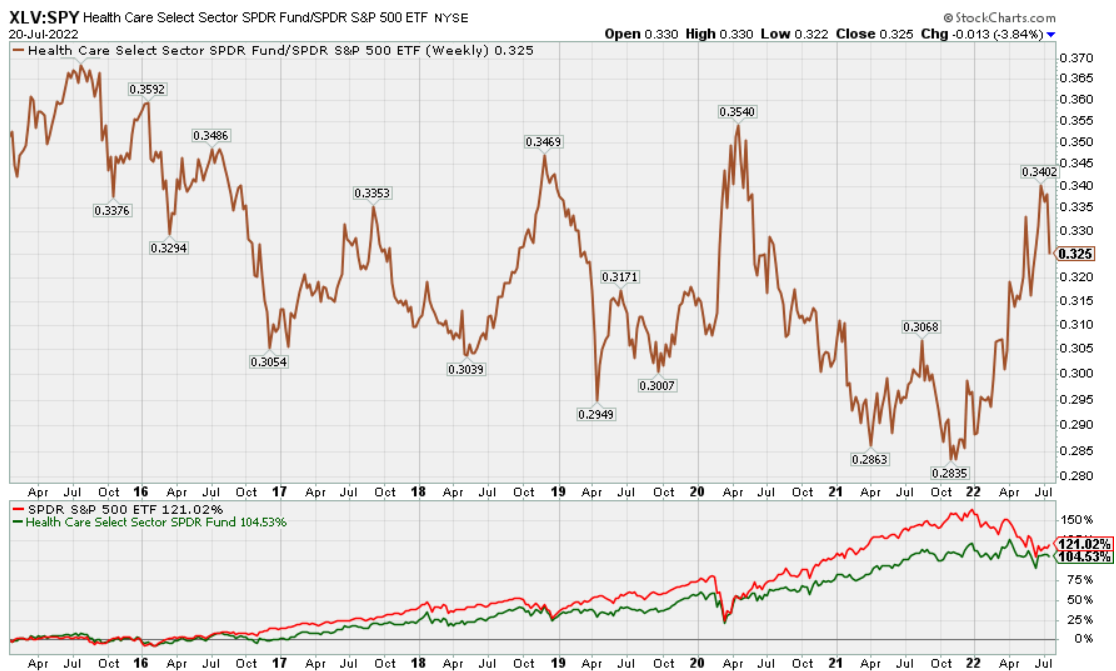
Chart A. When the SPY has softened, XLV has proven itself resilient. (Stockcharts.com)
Relative to the broader market, the XLV has rallied hard year-to-date, but it has done so primarily by not giving up much ground.
Stocks are selected for the XLV according to their GICS classifications. They include companies in the following subindustries, according to S&P Global, which are then grouped according to industry and industry group.
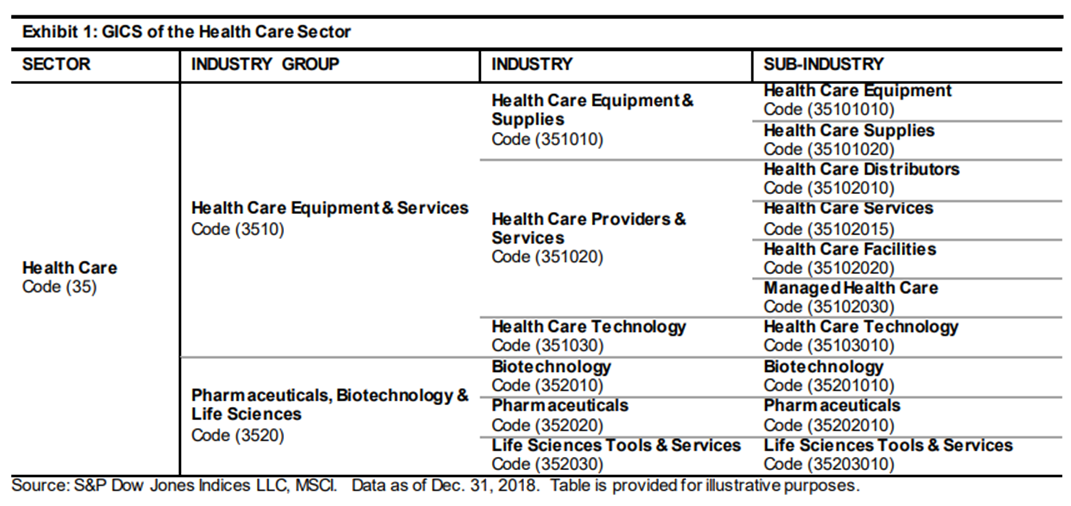
Chart B. XLV is divided into two industry groups and six industries. (S&P Global)
The following chart shows the respective long-term price performances of the XLV constituents at the industry level.
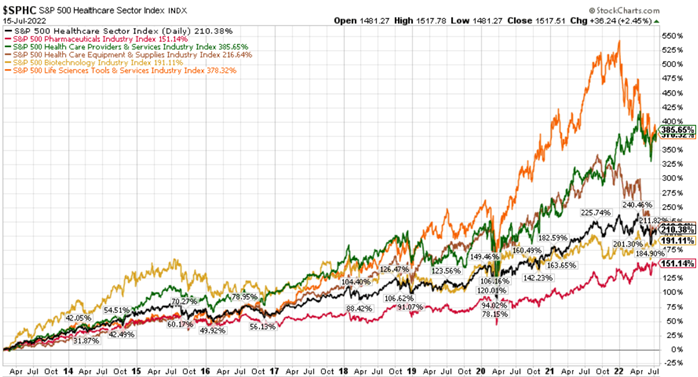
Chart C. Some of the strongest industries of the last eight years have done the worst in 2022. (Stockcharts.com)
In the chart, these are ranked by market cap as of mid-July (although I do not believe these industry indexes themselves are weighted internally by market cap). Pharmaceuticals (in red), the largest industry by market cap, has had the weakest performance over the last eight years, for example, while Life Sciences Tools & Services (in orange), the smallest by market cap, has had the strongest performance.
The respective weights as reported by State Street Global Advisors are illustrated in the following chart.
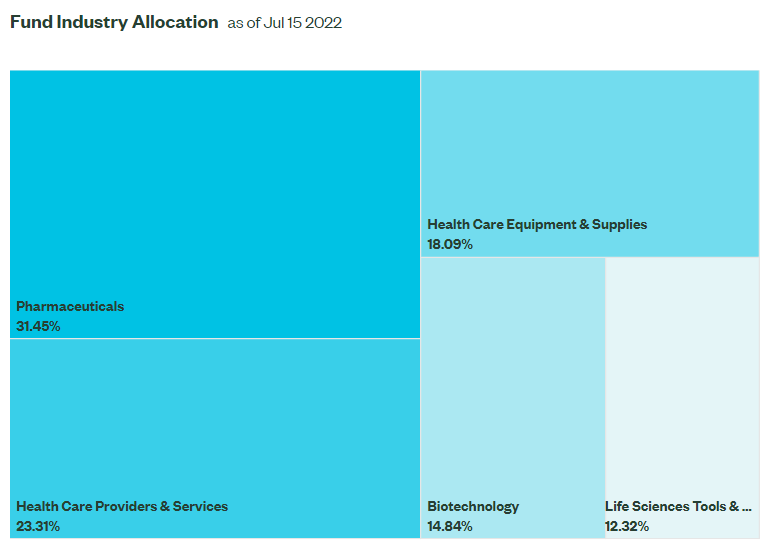
Chart D. Roughly half of the index is made up of pharmaceuticals and insurance companies. (State Street Global Advisors)
The 16-month performance of these industries is illustrated below.
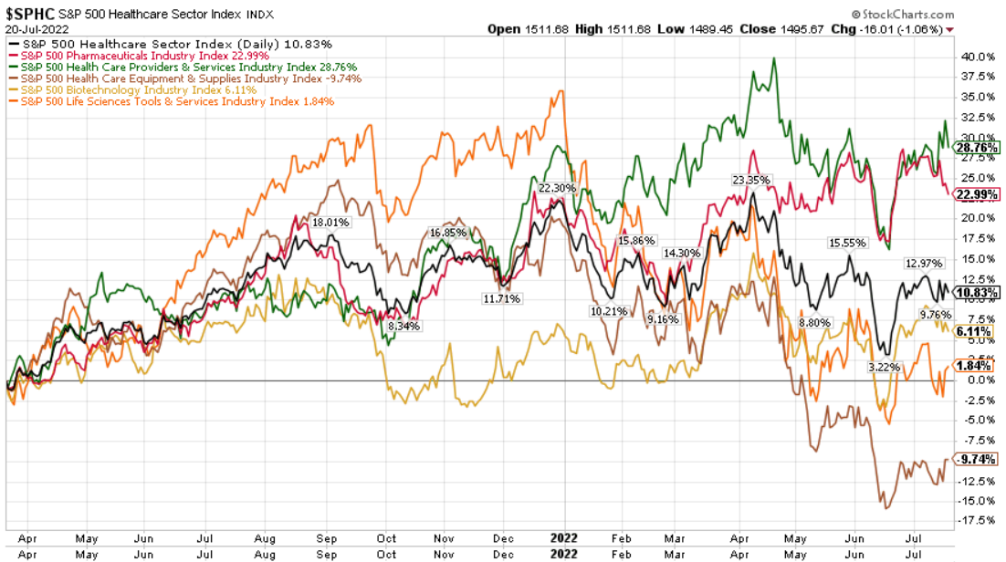
Chart E. Life Sciences stocks have fallen the most dramatically in 2022. (Stockcharts.com)
The two hardest-charging industries of the last eight years, Life Sciences (orange) and Health Care Equipment & Supplies (brown), have had the weakest performances over the last 16 months while the secular laggard, Pharmaceuticals (red), has had one of the strongest. Health Care Providers & Services (green) has been the most consistent performer over both secular and cyclical durations thus far. Biotech (in yellow) has been somewhere in the middle, slightly outperforming Pharmaceuticals over the last eight years and then slightly lagging in the current cycle.
In any case, from this perspective, it appears that the outperformance of the XLV relative to SPY during this year’s selloff has been driven by Pharmaceuticals, Health Care Providers & Services, and Biotechnology. These industries include companies like Johnson & Johnson (JNJ) and Pfizer (PFE), UnitedHealth (UNH), and AbbVie (ABBV), which have each outperformed the S&P 500, and which collectively make up the top 30% of XLV’s holdings.
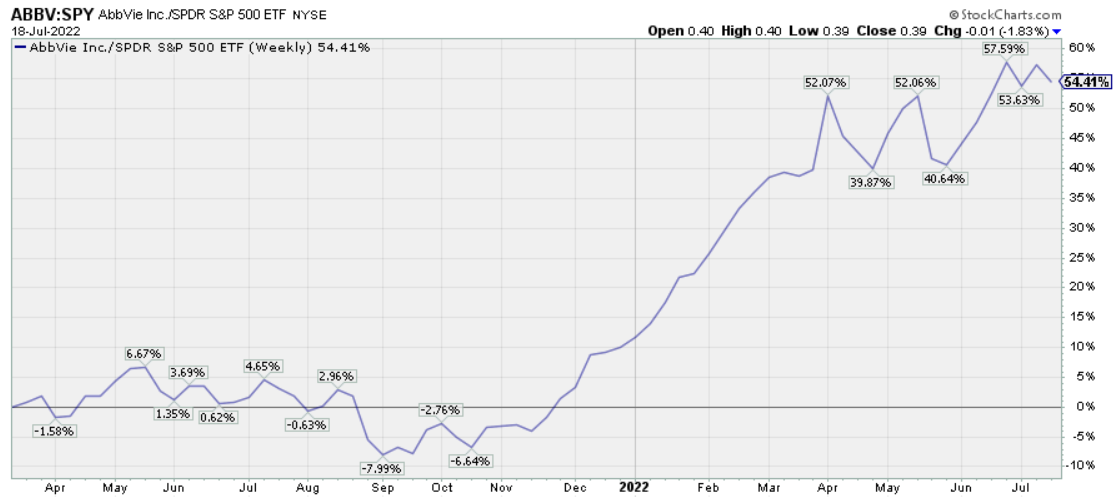
Chart F. AbbVie has had a stellar performance over the last 12 months. (Stockcharts.com)
In other words, the largest of the large-cap healthcare stocks have lived up to their defensive reputation thus far. Lesser lights in the Health Care Equipment & Services space like Abbott Laboratories (ABT) and Life Sciences space like Thermo Fisher Scientific (TMO) have lagged even the S&P 500 this year, although things have improved since the spring, which is roughly when ABBV’s relative performance stalled out.
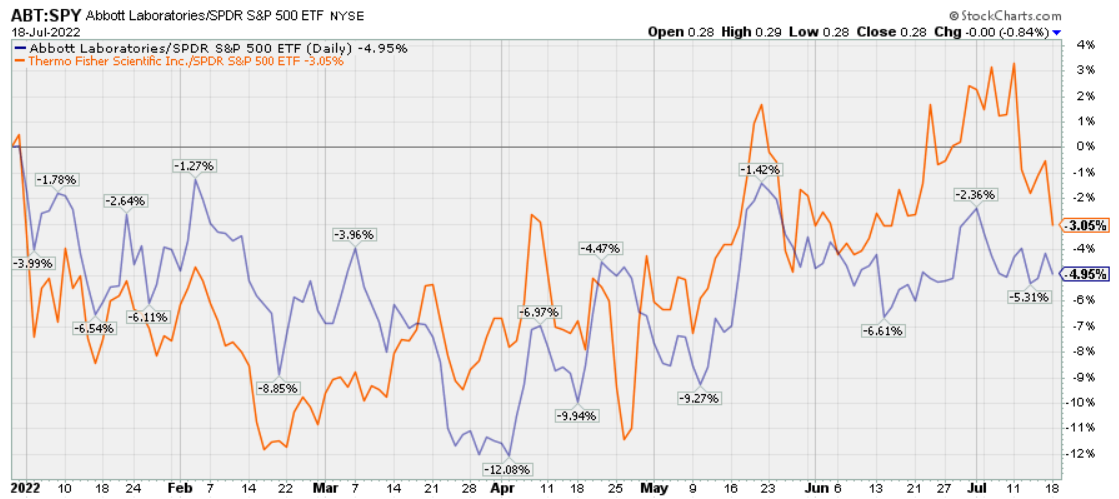
Chart G. Health Care Equipment stocks have underperformed the S&P 500 this year. (Stockcharts.com)
What has been consistent this year within the S&P 500 Health Care index is the favor received by larger-capped equities over their smaller-capped counterparts. This is evident in the performance of the Invesco S&P 500 Equal Weight Health Care ETF (RYH) relative to the cap-weighted XLV.
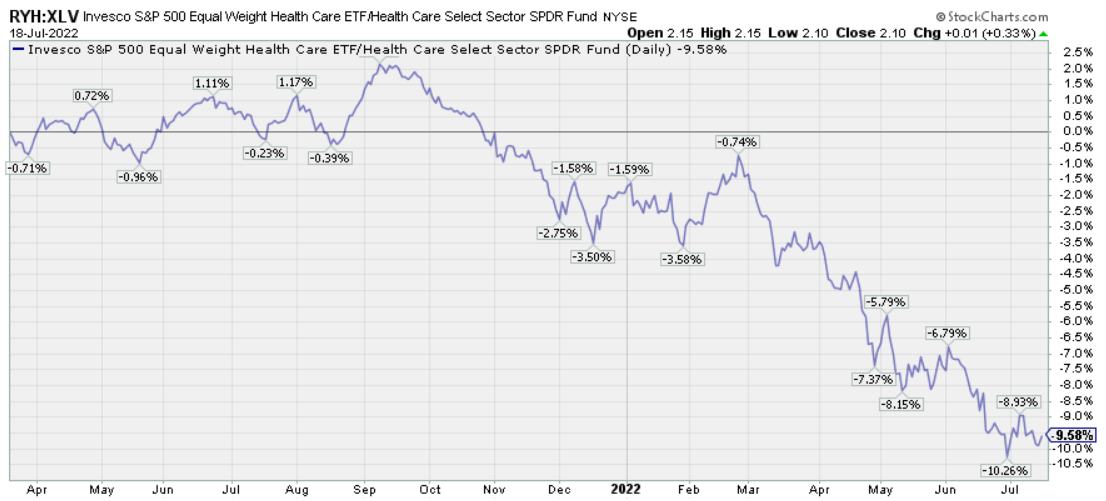
Chart H. Large-cap healthcare have held up better than the smaller caps in the XLV. (Stockcharts.com)
Both ETFs track the exact same 60+ stocks, but the RYH, as its name suggests, weights each of those stocks equally.
Even over the short-term, therefore, insofar as we might want to pick and choose winners and losers within the Health Care sector, we have to be attentive to macro conditions, the size effect, industrial rotations, and the particular merits and demerits of each of the constituents. In the table below, I have collated the sub-industry descriptions to form industry-level descriptions and placed them under their industry group headings. I have also color-coded the industries by price performance. Those in green have tended to outperform when the market has been defensive while those in yellow have outperformed when the market was rising. At present, there are no members of the Health Care Technology industry in the XLV, but they have tended to move with the more defensive (green) industries.
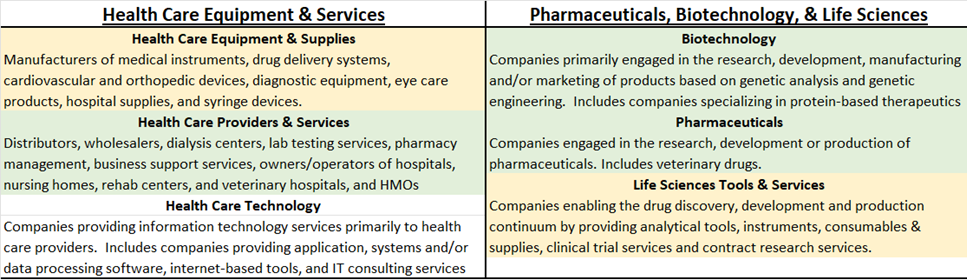
Chart I. Stocks in the green categories have been most resilient this year. (S&P Global)
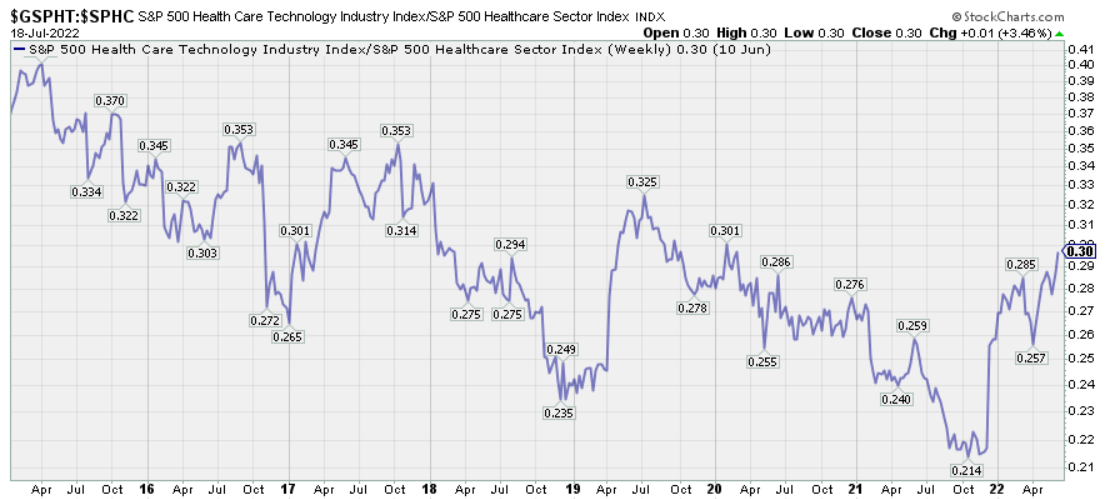
Chart J. Healthcare Technology stocks do not seem to be represented in XLV, but they seem to be even more defensive. (Stockcharts.com)
For all of the historical reliability of healthcare stocks, the XLV has not been especially stable in terms of its composition. The following chart from S&P Global (link above) illustrates this.
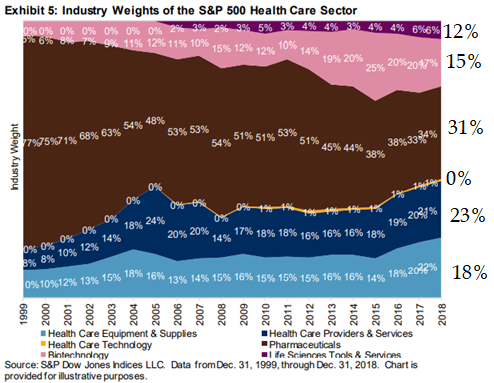
Chart K. XLV’s composition appears to be quite fluid (2022 weights are listed in the right margin). (S&P Global)
This year, I have done long-term historical analyses of all of the major S&P 500 sectors except Real Estate. Health Care appears to have the most fluid composition. Pharmaceuticals have gone from 77% of the XLV to 31% today (it was 29% back in April). Pharmaceuticals have lost ground, over the very long term, to each of the other industries, but especially Life Sciences.
There is another problem on top of that. The XLV has only existed 25 years, which means it has only endured one “secular” bear market (circa 2000-2009) and a handful of cyclical bear markets (let’s say, 2000-2002, 2008-2009, 2020). How likely is it that the future behavior of the XLV will resemble past behavior? I think it would help if we could speak more authoritatively about the past.
Looking at the XLV through the Fama-French prism
To that end, I have reorganized the components of the XLV according to their respective Fama-French classifications, which have data going back to 1926. That is, whereas each of the stocks in the XLV are, as we saw above, arranged by GICS classifications, I have looked up each stock’s SIC code and then sorted them by their Fama-French labels.
In the table below, for example, you can see the GICS classification for each of the top twenty tickers of XLV (about 75% of the index) as well as two of the Fama-French classifications. The Fama-French 49-industry classification (after this, FF49) is narrower while the Fama-French 12-industry classification (FF12) is broader and resembles a “sector” approach.
|
Top 20 XLV holdings as of July 13 2022 |
|||||||
|
Name |
Ticker |
Weight |
Cumulative |
GICS |
FF49 |
FF12 |
|
|
UnitedHealth Group Incorporated |
9.8 |
9.8 |
1 |
Health Care Providers & Services |
Insurance |
Finance |
|
|
Johnson & Johnson |
9.6 |
19.4 |
2 |
Pharmaceuticals |
Drugs |
Health |
|
|
Pfizer Inc. |
6.0 |
25.4 |
3 |
Pharmaceuticals |
Drugs |
Health |
|
|
AbbVie Inc. |
5.6 |
31.0 |
4 |
Biotechnology |
Drugs |
Health |
|
|
Eli Lilly and Company |
5.3 |
36.3 |
5 |
Pharmaceuticals |
Drugs |
Health |
|
|
Merck & Co. Inc. |
4.9 |
41.2 |
6 |
Pharmaceuticals |
Drugs |
Health |
|
|
Thermo Fisher Scientific Inc. |
4.3 |
45.4 |
7 |
Life Sciences Tools & Services |
Lab Equipment |
Business Equipment |
|
|
Abbott Laboratories |
3.9 |
49.3 |
8 |
Health Care Equipment & Supplies |
Drugs |
Health |
|
|
Danaher Corporation |
3.4 |
52.7 |
9 |
Life Sciences Tools & Services |
Lab Equipment |
Business Equipment |
|
|
Bristol Myers Squibb Company |
3.3 |
56.0 |
10 |
Pharmaceuticals |
Drugs |
Health |
|
|
Amgen Inc. |
2.7 |
58.7 |
11 |
Biotechnology |
Drugs |
Health |
|
|
CVS Health Corporation |
2.5 |
61.3 |
12 |
Health Care Providers & Services |
Retail |
Shops |
|
|
Medtronic Plc |
2.4 |
63.7 |
13 |
Health Care Equipment & Supplies |
Medical Equipment |
Health |
|
|
Elevance Health Inc. |
2.4 |
66.1 |
14 |
Health Care Providers & Services |
Insurance |
Finance |
|
|
Cigna Corporation |
1.8 |
67.9 |
15 |
Health Care Providers & Services |
Insurance |
Finance |
|
|
Zoetis Inc. Class A |
1.6 |
69.5 |
16 |
Pharmaceuticals |
Drugs |
Health |
|
|
Gilead Sciences Inc. |
1.6 |
71.2 |
17 |
Biotechnology |
Drugs |
Health |
|
|
Vertex Pharmaceuticals Incorporated |
1.5 |
72.7 |
18 |
Biotechnology |
Drugs |
Health |
|
|
Intuitive Surgical Inc. |
1.5 |
74.2 |
19 |
Health Care Equipment & Supplies |
Medical Equipment |
Health |
|
|
Becton Dickinson and Company |
1.4 |
75.6 |
20 |
Health Care Equipment & Supplies |
Medical Equipment |
Health |
|
Nearly 67% of the XLV is composed of stocks that fall within the FF12 Health classification. Generally, this encompasses GICS’s Pharmaceuticals, Biotechnology, and Health Care Equipment & Supplies (and possibly the Health Care Technology, as well). FF49 Insurance comprises just under 17% (primarily Health Care Providers & Services), and FF49 Lab Equipment makes up just under 11% of the XLV, mostly the Life Sciences industry). The remaining 5-6% are primarily retailers like CVS.
The Fama-French Health, Insurance, and Lab Equipment classifications should cover 90% or so of the current XLV, even if the Fama-French Insurance index includes a number of companies that are likely to be found in the financial sector ETFs like XLF rather than XLV. Data on companiesmarketcap.com suggest that the XLV insurance companies like UNH, ELV (formerly ANTM), and CI dwarf other insurance companies by market cap.
In order to prevent this article from becoming too unwieldy, I am going to focus primarily on the core FF12 Health component, but we will briefly look at FF49 Insurance and FF49 Lab Equipment along the way, as well, just in case something we find there suggests a substantially different outcome.
Sticking with the plan I laid out at the beginning of the article, I want to focus first on Points 1 and 5, which referenced the cyclical performance of healthcare stocks.
Cyclical performance of healthcare stocks
Perhaps the single most important fact to keep in mind with regards to the cyclical performance of healthcare stocks is that they tend to follow the wider market. In this article, “cycles”, unless otherwise specified, are calculated as log changes relative to an index’s 36-month moving average.
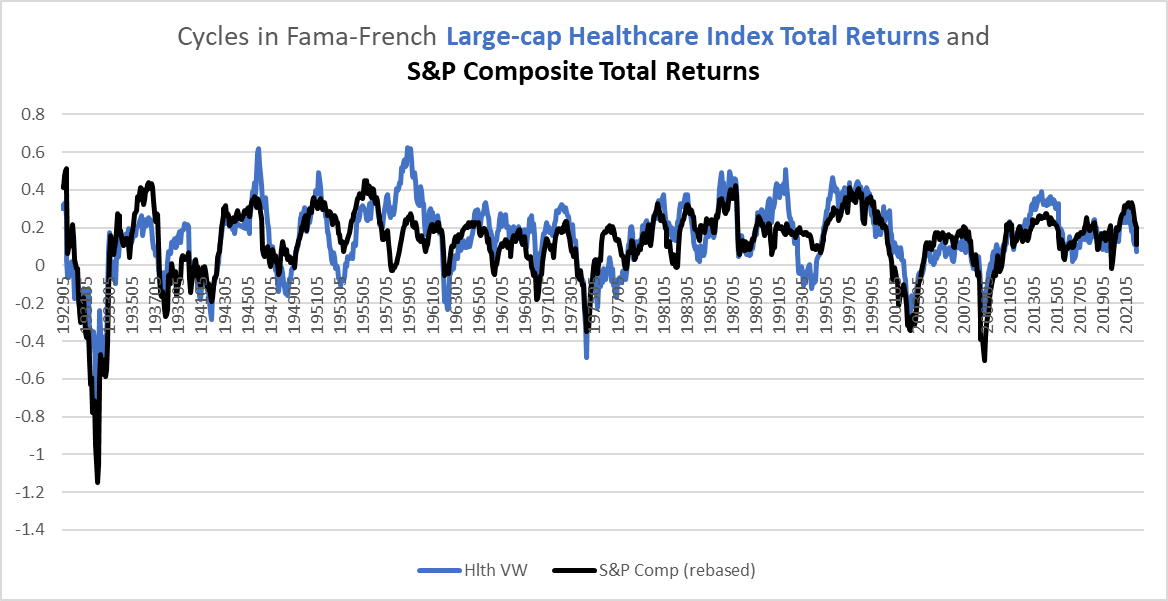
Chart L. Cyclical momentum in FF12 Healthcare stocks is closely tied to momentum in the broader market. (Fama-French; Shiller)
Every major market selloff has seen a selloff in virtually every sector and industry.
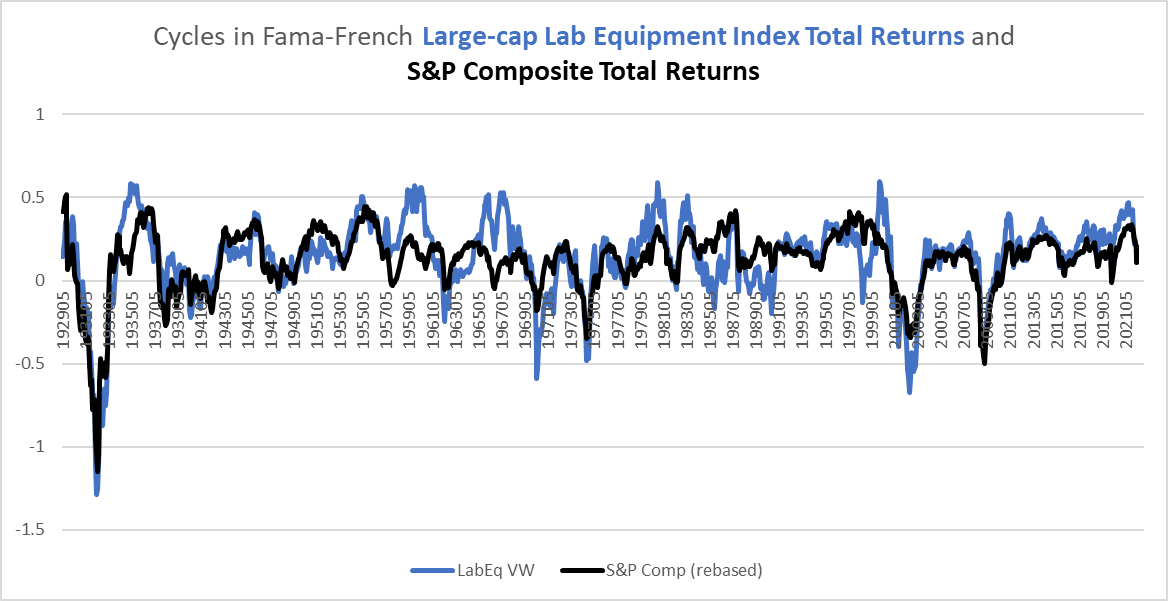
Chart M. FF49 Lab Equipment stocks appear to be more volatile but generally follow broader market momentum. (Fama-French; Shiller)
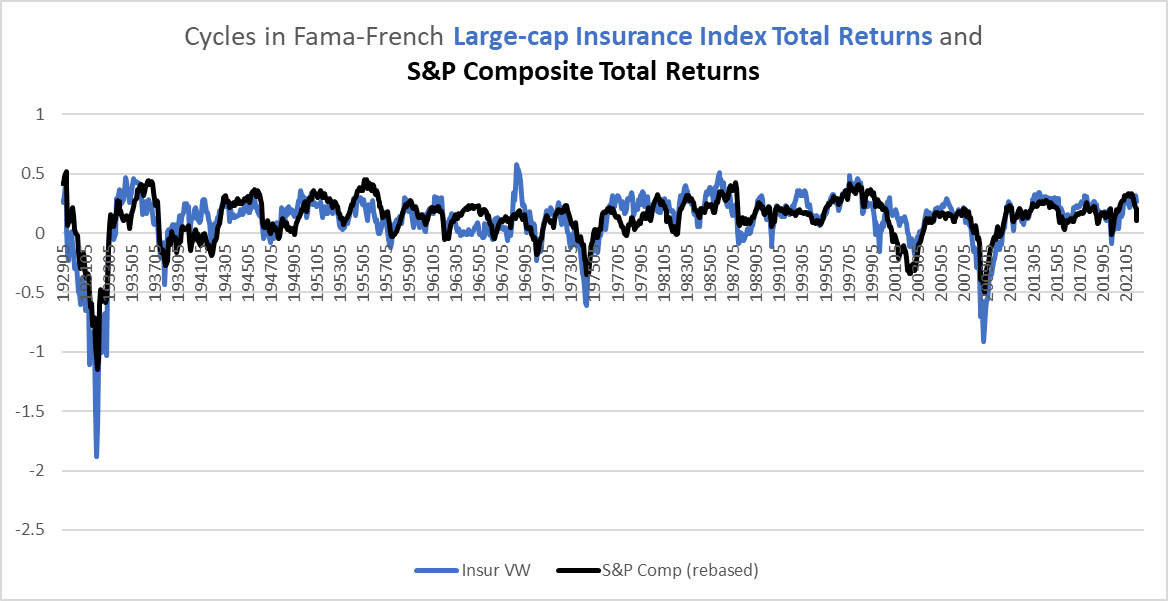
Chart N. FF49 Insurance stocks tend to track the broader market closely. (Fama-French; Shiller)
There is both a “stock market” and a “market of stocks”.
These charts, here, however may be somewhat misleading, since they really track momentum more than anything else. Another way of looking at cyclical performance is drawdowns in the equity/Treasury ratio. That is, we can look at the fall of a given equity-to-Treasury index relative to that ratio’s 36-month high. The following chart shows drawdowns for the healthcare ratio and the S&P Composite ratio.
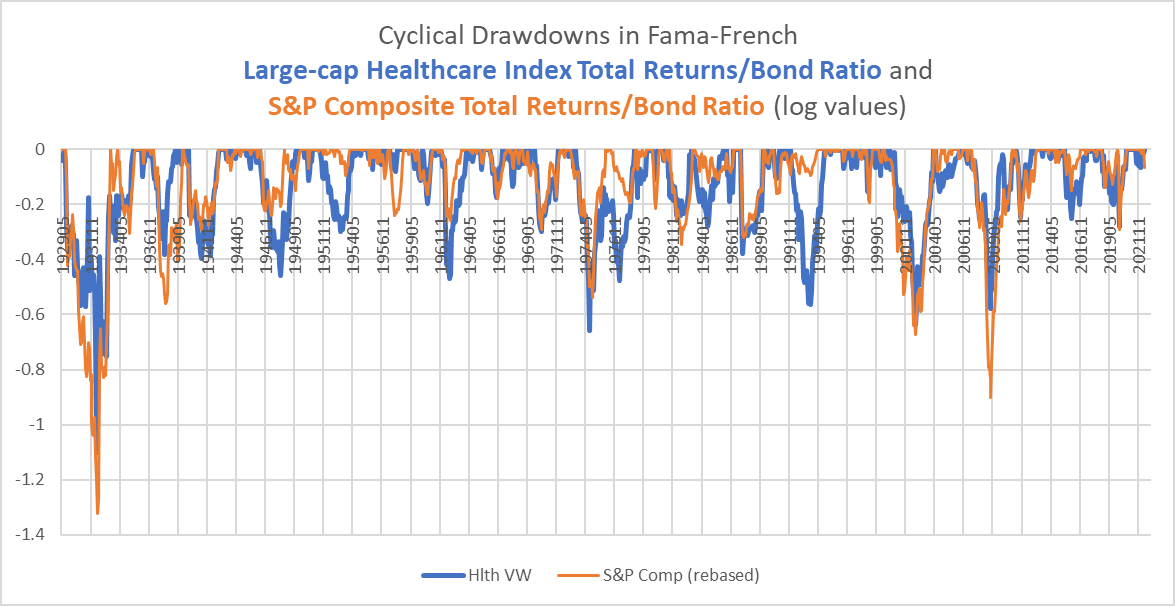
Chart O. Healthcare stocks tend to be relatively resilient during major selloffs, but still underperform Treasuries. (Fama-French; Shiller; St Louis Fed)
Generally, healthcare stocks have done relatively well during most selloffs.
Lab equipment stocks (again, roughly equivalent to Life Sciences industry stocks) have, on the contrary, underperformed during deep bear markets.
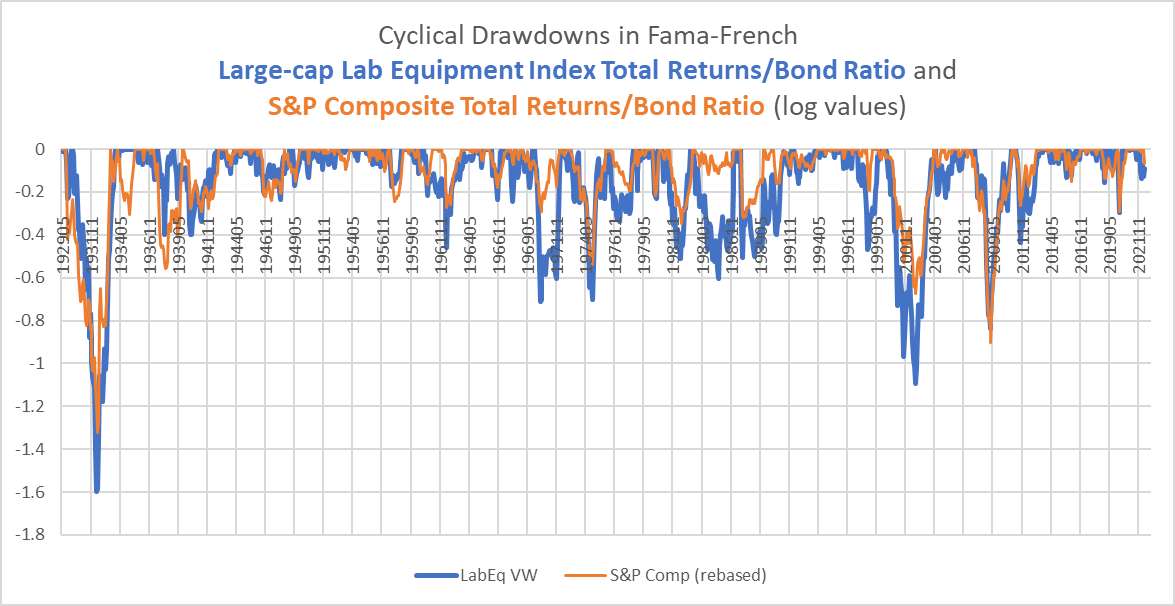
Chart P. Lab Equipment stocks have typically underperformed during selloffs. (Fama-French; Shiller; St Louis Fed)
This appears to be due to a heavier technological component than in the FF12 Health index. Thus, after the tech “bubbles” of the 1920s and 1990s, lab equipment stocks, like its tech-sector cousins, saw persistent declines relative to Treasuries and the S&P Composite. That might “explain” why Life Sciences stocks rose more sharply over the last decade but have fallen more sharply this year.
The question we have to keep in mind and which we will revisit below is how likely it is that the post-bubble selloff (if that is what it is) has run its course.
Insurance companies, which is our proxy for Health Care Providers & Services, have also tended to sell off quite strongly during cyclical bear markets, although they have held up fairly well thus far.
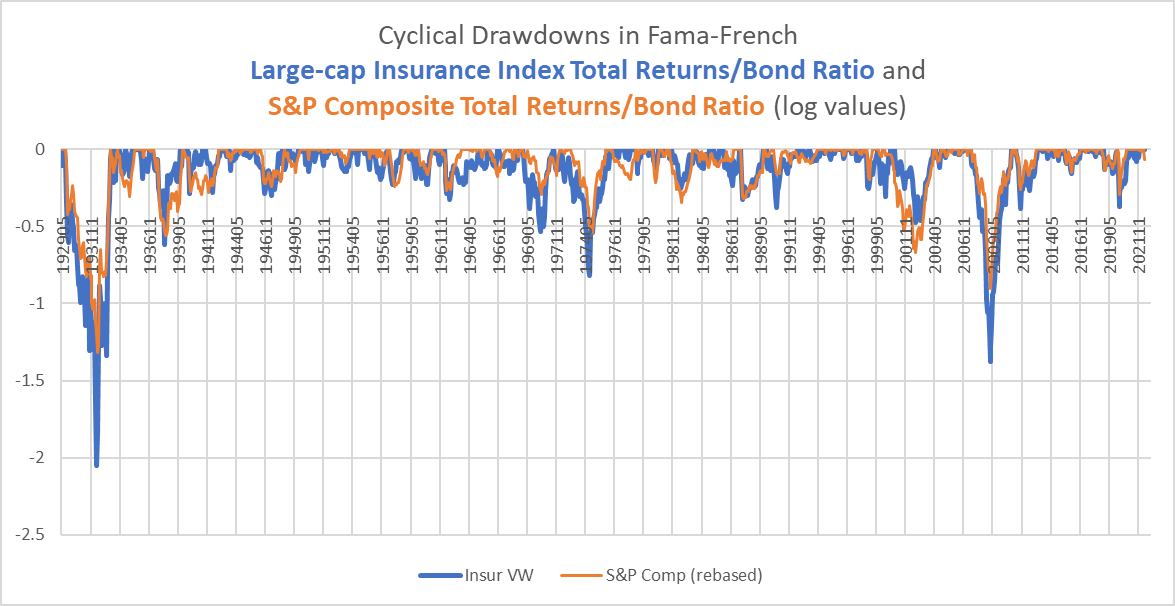
Chart Q. Insurance stocks tend to sell off quite strongly during cyclical bear markets. (Fama-French; Shiller; St Louis Fed)
The only major bear market in which they did not sell off more strongly than the S&P Composite was the post-dot.com crash.
There are lots of mitigating circumstances in the current environment. Inflation has been unusually high (as some readers may have heard), bonds unusually strong (with inflation at this level) and weak (selling off with equities), and we are (hopefully) coming out of a pandemic that, apart from its direct health impact, has disrupted the normal patterns of life and both the demand for and supply of medical care.
The healthcare sector generally has increasingly become a focal point for political controversy, whether it is Medicaid-for-all, Covid vaccines, gender reassignment procedures, or abortion. I draw no conclusions from this, except that it is something that is worth monitoring, in case it indicates some deeper-seated changes occurring. It seems, for example, that, as a civilization, there is a breakdown in the consensus of where the individual rights end and social obligations begin. A deep recession would likely bring the Medicaid-for-all debate back to the fore. Whether this would dampen social controversies or ignite them is far beyond the scope of this article, but we will return to the cost of medical care later.
For now, if we have entered a more or less typical growth shock that will depress stock prices, earnings growth, commodity prices, and long-term interest rates, not only are we likely to see momentum for the broad market decline, but we are likely to see the strength of the defensive sectors, including the heretofore most resilient industries within them, such as health insurance stocks, break. In this respect, therefore, I described XLV as being technically “undersold”. But, are we in a growth shock?
Will markets continue to decline?
My thesis for markets as a whole has been that long-term bear markets have a much higher chance of occurring when a cluster of conditions emerge. Such conditions include (a) a long-term outperformance of tech stocks (visible even within the XLV in the performance of Life Sciences stocks), especially when combined with (b) a long-term underperformance of energy stocks, and (c) high PE ratios combined with high long-term earnings growth, and (d) an energy shock. It is this cyclical energy shock that seems to finally burst equity markets. This burst in equity markets tends to be led by a reversal in the long-term ‘sectoral hierarchy’, as tech stocks enter a brutal, long-term downturn while more cyclical sectors (materials, industrials, but most importantly energy) outperform.
This long-term process is often obscured, however, by short-term volatility. That is because long-term bear markets almost never manifest themselves as gentle, persistent declines. Rather, long-term bear markets (typically somewhere in the neighborhood of 7-15 years) tend to be highly cyclical. Markets crash for two years, then rise perhaps 50% over the next two years, then crash again for the next three. At the end of that period, markets as a whole will have made no progress but the cyclicals (and some defensives) will have held up better while tech stocks (or industries that were heavily impacted by tech during the previous boom) are in the gutter.
As I outlined last year, conditions (a), (b), (c), and (d) were all met in 2021. The only thing that was missing was an inverted yield curve to help accelerate the cyclical decline. Thus, in the articles written this year, we have been looking for signs of a long-term, broad decline led by the tech sector but paired with growth-shock/recessionary signals like decelerating/falling commodities, interest rates, earnings, and cyclical stock performances. And, that seems to be what we have gotten so far. We can also expect bear market rallies to occur. But, what has been missing so far is a break in the defensive sectors, most notably staples, which I discussed two weeks ago, and healthcare stocks. Perhaps a bear market rally in “risk assets” will set those defensives up for a fall?
Space does not permit me to review all of the evidence for these claims here, but summaries of those arguments can be found in the following articles:
- Being A Bear Is More Complicated Than It Looks – the cyclical nature of “secular” bear markets
- Big Tech Has A Lot Farther To Fall – a long term rotation away from tech is beginning
- SPY: Long-Term Outlook Remains Unchanged – long-term indicators of overall market performance suggest a long-term, disinflationary bear market
- DBB: The Cyclical Downturn Has Likely Begun– deceleration in industrial metals suggest a cyclical bear market has begun
But what about indicators specific to the healthcare sector? And, what ought we expect in terms of both absolute and relative performances?
Outlook for absolute performance of healthcare stocks
Finviz.com reports XLV’s PE ratio as somewhere near 23, roughly even with the S&P 500’s. Unfortunately, I do not have genuinely long-term data on the healthcare sector’s PE ratio. Instead, we have to rely on the dividend yield (the inverse of which is the price/dividend ratio), which I calculated using the difference between total returns and price returns. The chart below shows the historical implied dividend yield for healthcare stocks and the subsequent long-term price return.
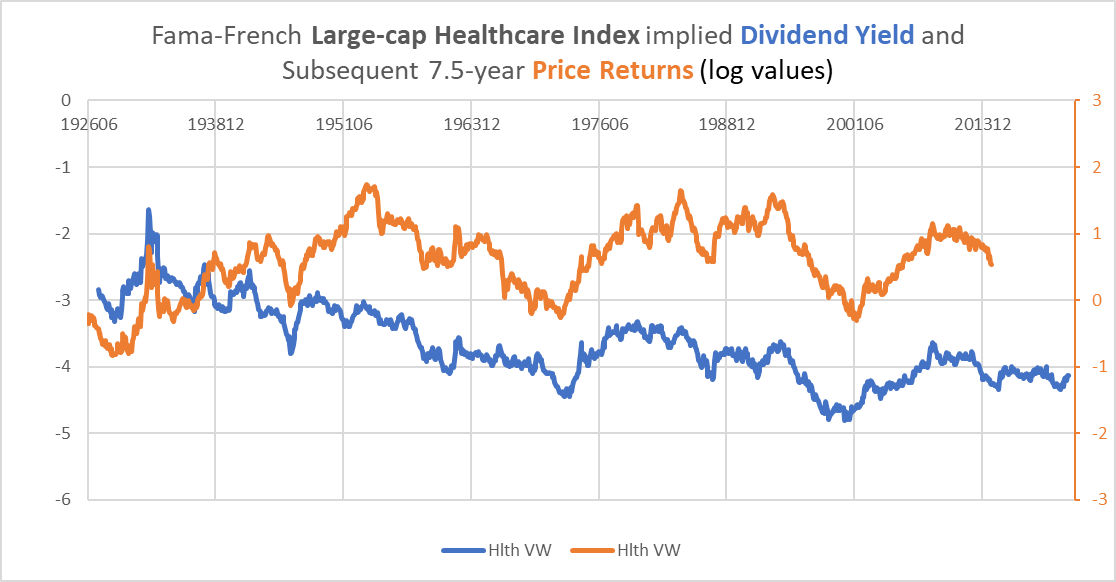
Chart R. The dividend yield has been a fairly good predictor of long-term returns in the healthcare sector. (Fama-French)
Things are complicated somewhat by the shift away from dividends since World War II, most notably in the transition towards buybacks over the last forty years. In other words, the dividend yield for healthcare stocks likely gives an exaggerated impression as to how low equity yields (and thus how high price multiples) are. Nonetheless, this has been a pretty good indicator of the direction of travel of subsequent returns. Since the end of World War II, there has been a 0.77 correlation between the dividend yield on FF12 Healthcare stocks and their subsequent 7.5-year total returns. But, long-term negative price returns since World War II have been relatively brief. During the Depression, however, returns were deeply negative.
This long-term stability has been built partly on the back of sustained dividend growth in the healthcare sector since World War II.
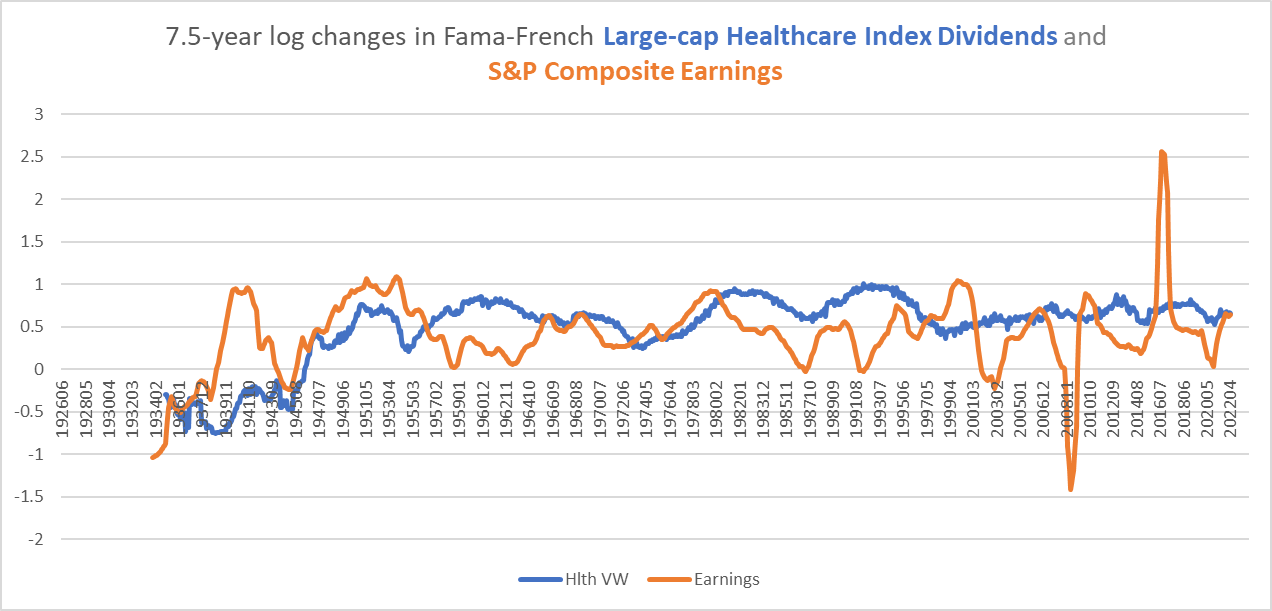
Chart S. Healthcare dividends have seen strong and stable growth since World War II. (Fama-French; Shiller)
But, it has also only lasted as long as market-wide earnings growth has remained stronger than commodity inflation. The chart below suggests that where earnings growth for the S&P Composite (in orange) has been higher than commodity inflation (in green), healthcare stocks (in blue) have had a strong absolute performance.
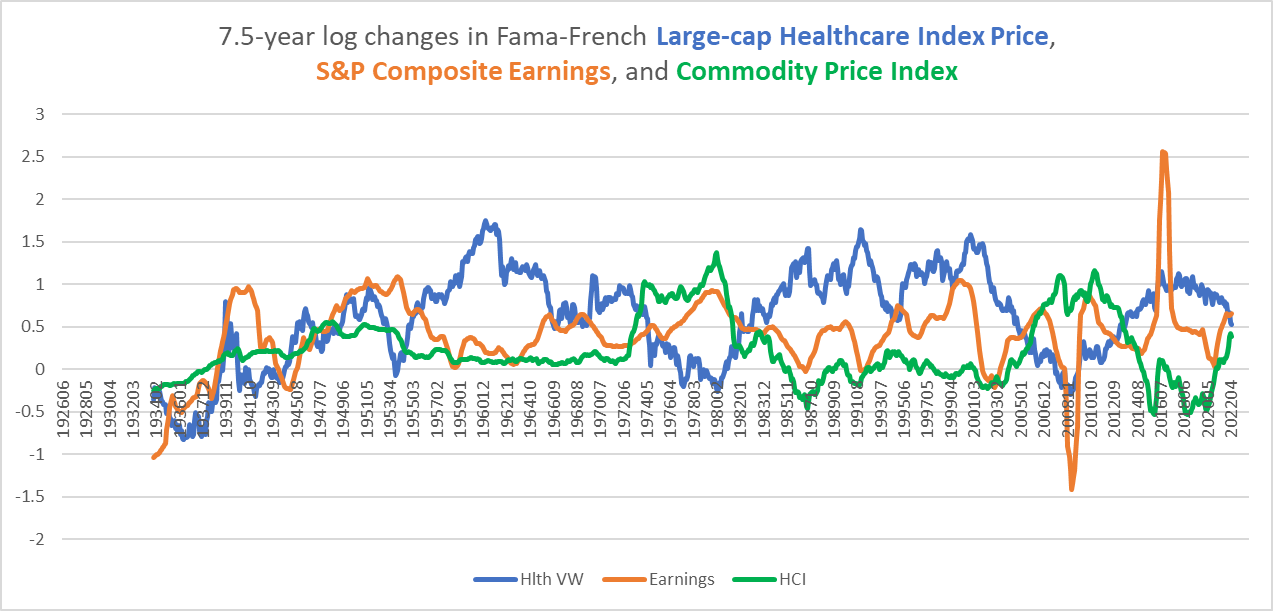
Chart T. When S&P earnings grow faster than commodity inflation, healthcare stocks do well. (Fama-French; Shiller; Warren & Pearson; St Louis Fed; World Bank)
Where earnings collapsed (as in the 1930s) below commodity inflation or commodity inflation popped (as in the 1970s and 2000s), healthcare returns have fallen. We only have three long-term bear markets recorded here, but it appears, perhaps unsurprisingly, that a collapse in earnings has a more severe impact on equity returns than does an inflationary shock. A collapse in earnings akin to the 1930s would point to both a long-term collapse of equity prices and dividends in the healthcare sector.
As I pointed out in a recent series on the relationship between technology, war, and asset prices, it is precisely this kind of long-term growth and inflation shock that we should be on the lookout for. Unless the world is undergoing a deeper structural change than is apparent now, it would be unusual for a commodity and yield supercycle to occur at this point. The current deceleration, although by itself inconclusive, in the larger market context, suggests that we are not in a commodity supercycle, which is qualitatively different from a commodity cycle.
There is therefore a risk of absolute and considerable long-term total return losses in healthcare stocks and not just a typical bear market decline. But, this primarily follows from a macro analysis rather than any peculiarities of the healthcare sector, although valuations in the sector itself do suggest low returns in the future.
To get a clearer picture, I think we should focus on relative returns.
Outlook for relative performance to 2030
Over the long-term, sectors tend to move together. In the chart below, I calculated the 7-year log changes of all of the FF12 sectors, as well as of the S&P Composite. Generally, they all move together, with the occasional exception of the energy sector.
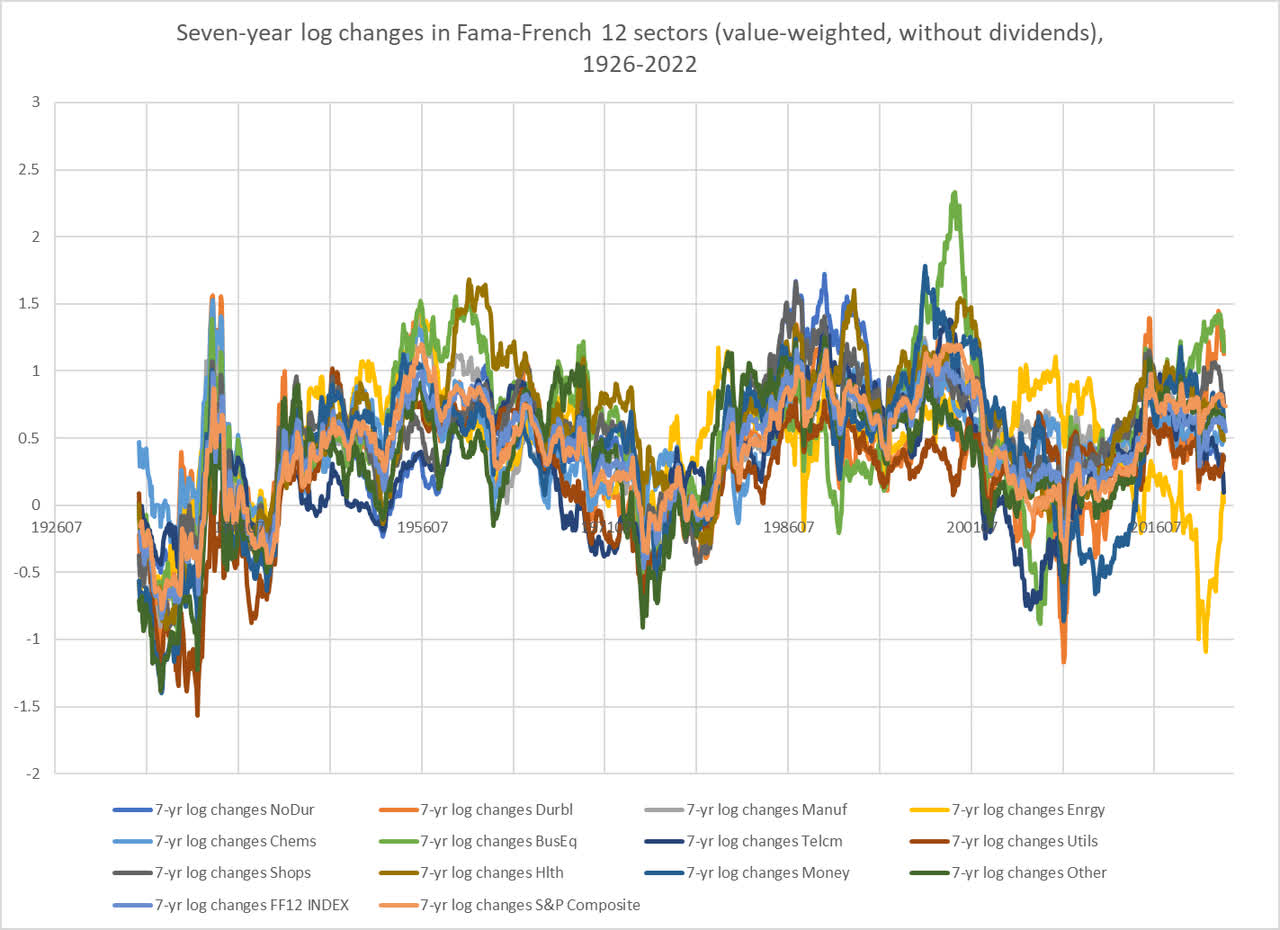
Chart U. The stock market ultimately trumps the market of stocks. (Fama-French; Shiller)
In the chart below, I took the ratios of each of the FF12 sectors relative to an average of all of them (the “FF12 Index” in the chart above), measured the seven-year log changes of those ratios and then measured the sectoral dispersion of those sectors using a rolling standard deviation. Last year, I pointed out that this was typically a good indicator of a coming sectoral rotation, especially when the factors (a), (b), (c), and (d), described above, held.
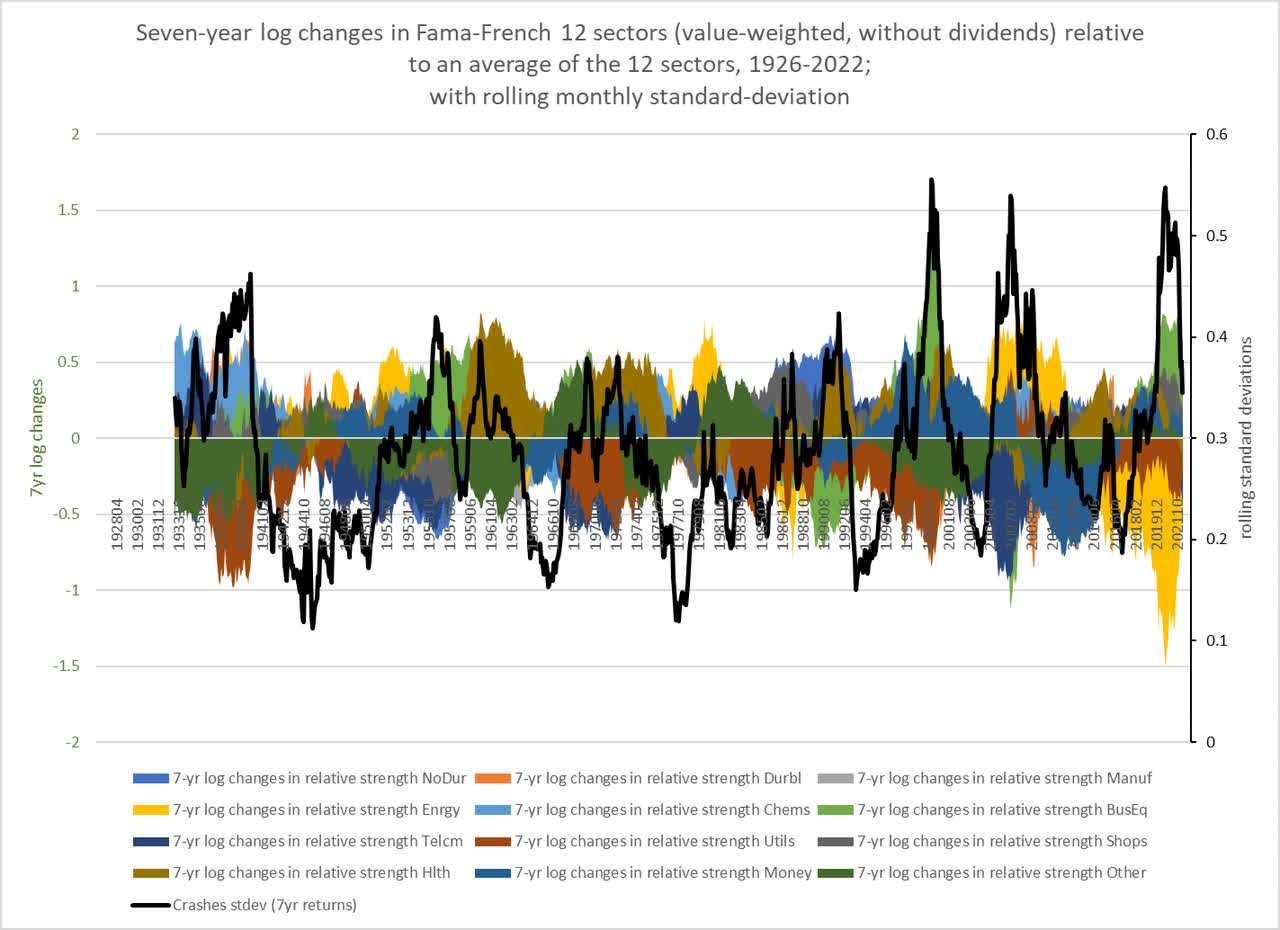
Chart V. High degrees of sectoral dispersion typically precede long-term sectoral rotations. (Fama-French)
When the black line is high, it indicates there was a great degree of sectoral dispersion. More times than not, one of two sectors were in charge—Business Equipment (i.e., tech) or Energy—and often one of the two was at the bottom. At the far-right edge of this chart, we can see that the rise in energy stocks (in yellow) and the decline in all of the other sectors, but especially tech (in green), has resulted in much less dispersion. This process typically does not end until a new peak in dispersion emerges with a different sector on top (most likely the energy sector). Healthcare stocks (in brown) have a curious relationship with this process.
As I discussed a year ago, it appears that healthcare stocks operate as a kind of caretaker for sector leadership when tech stocks begin to retreat. In other words, healthcare stocks often become the leading sector during the transition from a tech-led market to an energy-led market. In the chart below, I have stripped out all but Business Equipment, Health, and Energy, and I have put the FF12 index on a separate axis, in order to draw this dynamic out somewhat.
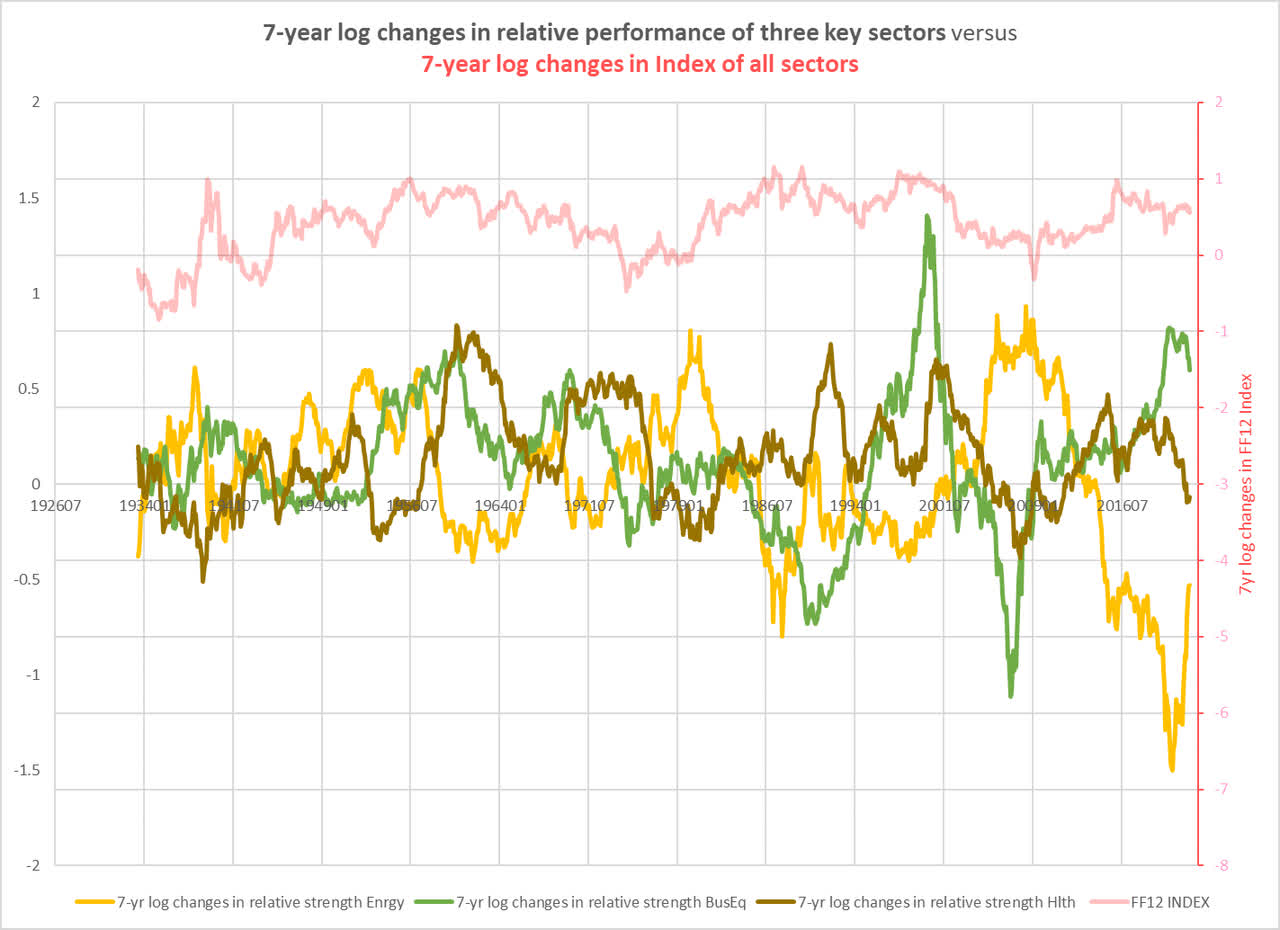
Chart W. Healthcare stocks trail Business Equipment performance and react negatively to Energy strength. (Fama-French)
After peaks in the relative performances of the tech sector, typically healthcare stocks step to the fore, at least until the energy sector revives. The table below shows the correlations between the relative performances of the FF12 sectors.
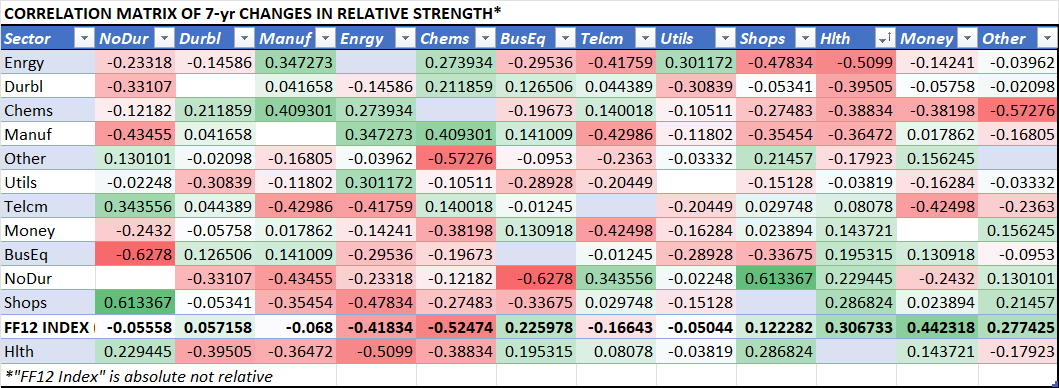
Chart X. The healthcare sector is more closely aligned with other service-sector stocks. (Fama-French)
There are some notable relationships here. First, Health is the second most highly correlated with the absolute performance of the FF12 index (a proxy for the S&P Composite). Second, Health’s relative performance is more highly correlated with service/consumer-oriented Shops and Nondurables than with other sectors, which we will come back to below. Health also has the strongest negative correlation with the Energy sector. In other words, if one is anticipating a long-term outperformance by energy stocks, there is a good chance Health stocks will be relatively depressed.
And for reasons discussed above, we indeed ought to expect the energy sector to outperform most other sectors by the end of the decade. All things being equal, we might expect healthcare stocks to be among the laggards by 2030. I think we can include equities in both the Lab Equipment and Insurance industries, if for slightly different reasons. Lab Equipment stocks are essentially tech stocks and ought to be expected to underperform in the aftermath of a tech boom. Insurance stocks are classified primarily in the Money (roughly equivalent to the XLF) sector in the Fama-French system, and their relative performance tends to correlate with the absolute performance of the market as a whole (a bit over 0.44 in the table above).
Another way of putting this is that historically, healthcare, finance, and tech stocks have tended to have high long-term betas relative to a market average of sectors (see the last line in the table below), and thus they would be more likely than not to underperform in a “secular” bear market.
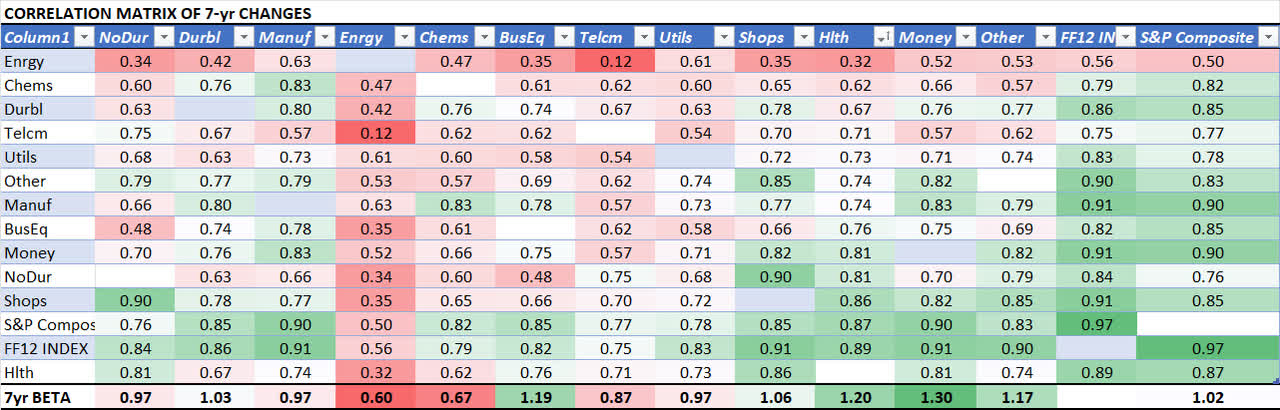
Chart Y. Healthcare stocks are high beta. (Fama-French; Shiller)
To put this as simply as possible, the table above shows, I believe, that every sector “likes” the market as a whole; they will generally go where it goes (that is, as counterintuitive as it may seem, there is “a stock market” and not just “a market of stocks”). But, almost no one “likes” the energy sector. It is always somewhere on the periphery, either dragging down the market as a whole when it underperforms or holding every other sector down when it outperforms.
The healthcare sector, with its high beta and high aversion for relative strength in energy stocks (and, as we saw in Chart T, for relative strength in commodity inflation generally), is likely to underperform over the remainder of the decade, although perhaps not as much as tech-heavy sectors, most notably XLK but also XLC and XLY. Low long-term returns for the market as a whole implies underperformance for healthcare stocks, as does a relative outperformance for energy stocks.
What this all suggests is that we have to be cautious when speaking of the defensive quality of the healthcare sector. Healthcare stocks are defensive primarily at cyclical intervals. When cyclical bear markets strike, they tend to hold up relatively well. When “secular” bears strike (at least 7- to 8-year bear markets), however, they are less likely to outperform.
Why is this, and does it matter?
A structural bull market
The healthcare sector has provided the strongest returns of all of the FF12 sectors and with less volatility than its nearest competitors, especially since the 1950s.
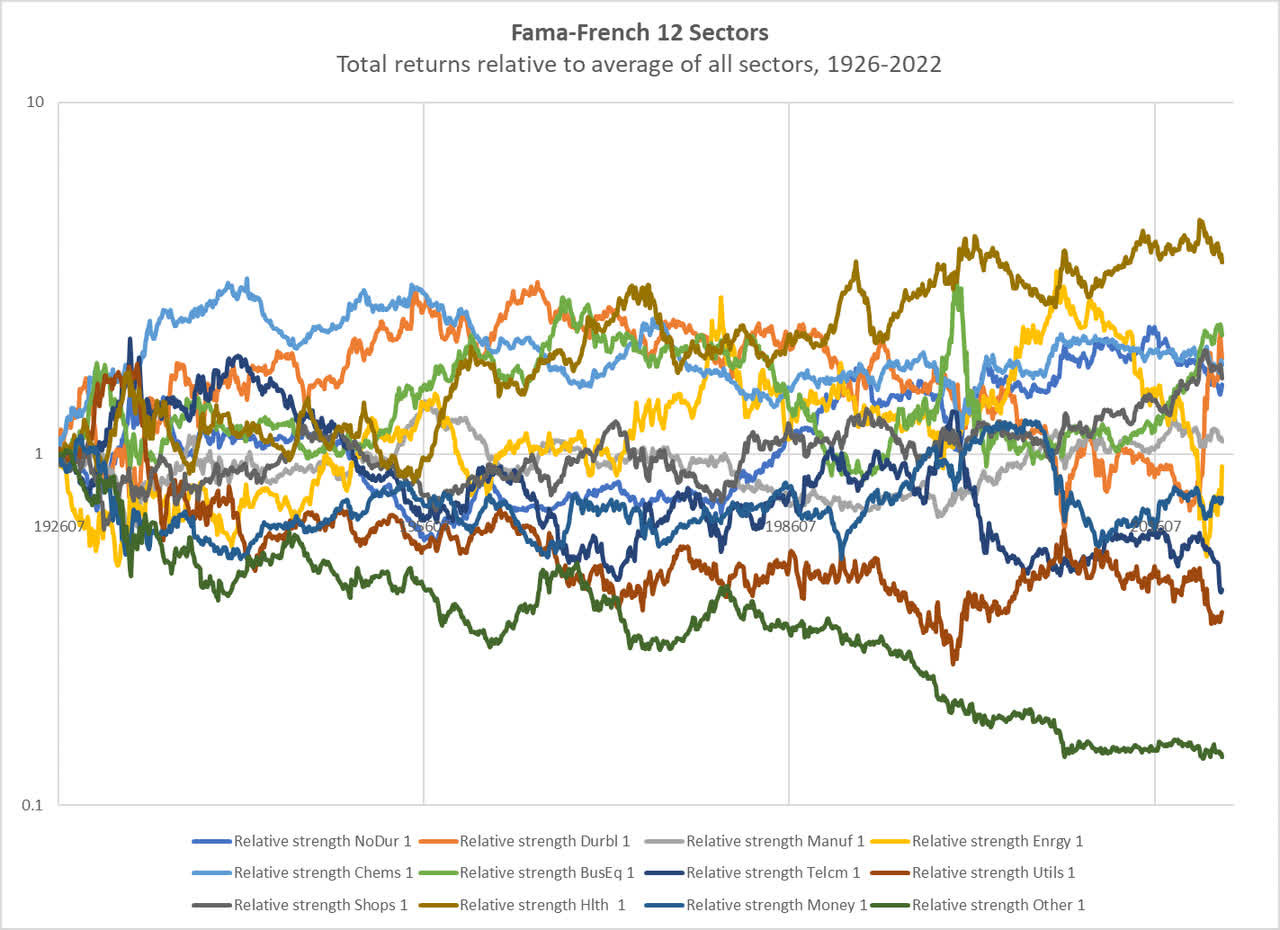
Chart Z. Healthcare stocks have been the clear winner over the last 70 years. (Fama-French)
My hypothesis is that certain sectors benefit from “Baumol’s cost disease” more so than others. Baumol’s cost disease refers to the phenomenon whereby inflation in services has a structural tendency to be higher than inflation for goods. The reason is that productivity growth in capital-intensive sectors is higher than it is in labor-intensive sectors. (If you teach one robot to fish, you can teach a million to do so, and they are likely to become more efficient over time. If you teach a man to fish, you might be able to teach a few more, but sooner or later they will start unionizing). This drives the price of goods down and the price of labor up. Higher wages and cheaper goods. As good as that sounds, there are some notable drawbacks.
Some of the negative consequences of this process is that it tends to deindustrialize and depopulate regions with high wages while raising the costs of services in that region. William Baumol first wrote about his theory in the 1960s to explain why American cities were falling apart and going bankrupt. Why keep a factory open in New York City when you can produce something more efficiently and cheaply in a suburb or in Detroit? And once land, wages, and taxes go up there, why not move South? And after that, why not move to Mexico or China?
It is under these types of pressures that the American workforce transitioned rapidly from an agricultural one to an industrial one and then to a service one from the 1910s onward. The deindustrialization of the American workforce has thus gone hand in hand with rising medical, educational, and governmental costs.
The great beneficiaries are private- and public-sector technocrats, or cyberneticians. In creating a global economy that is driven by a constant technological churn, there is a need for a workforce at the apex that is capable of combining technical skills and social organization. The society becomes cybernetic in the sense that it increasingly resembles an engineering problem or, more humanely, a design problem.
In the cores of the deindustrialized urban cores on the American coasts, for example, we find government, media, entertainment, academia, museums, NGOs, and corporations while out in flyover country, there are stagnant pools of social decay that increasingly resemble the urban decay that preceded them.
What does this have to do with the price of tea in China or the price of equities in the healthcare sector? Two things. First, perhaps coincidentally, it is the high-tech sectors and the services- and labor-oriented sectors in the stock market that seem to have benefited at the expense of, or relative to, goods-producing sectors at the same time that services costs have risen faster than the cost of goods in the real economy. Baumol predicted at one point that 60% of the US economy as measured by GDP would be healthcare expenditures by 2105.
Second, if this process is economically inevitable, it may not be socially and politically inevitable. That is to say, if the economic process continues to drive educational and medical costs up while depriving employment opportunities for broad swathes of the population and thus leading to sociopolitical chaos, the sociopolitical foundation of the economic system may crack. This economic process, in other words, may have sociopolitical limits.
It is this cost-disease quality of the healthcare sector’s equity performance that also may explain why the sector has been such a reliable bet during standard recessions or cyclical bear markets. Going back to just after World War II, the service sector had never entered recession until the 2020 Covid outbreak. Services tend to have both more constant demand and higher levels of inflation during recessions, which are driven primarily by goods, especially durable goods, demand.
Therefore, what has made the healthcare sector both a cyclical defensive and a long-term (structural rather than secular, in this instance) growth play seems to be linked to the cyclical stability of the services sector in the real economy and the long-term processes outlined in Baumol’s theory of cost disease. So long as this process can continue without interruption by political or social processes, one might expect it to last indefinitely. By the same token, a long-term bet on healthcare stocks is implicitly a bet on these processes not becoming entangled.
My own opinion is that rising costs in the services sector, perhaps especially in the healthcare sector, are socially and politically untenable over the very long term, as are the processes linked to the socioeconomic decimation of the non-globalized, non-technocratic classes in the developed world. But, that raises the question of where and when a tipping point might occur. If it did not occur a decade ago, why ought one to expect it to occur in another decade or even another century?
The analysis above does not appear (so far as I can tell) to suggest an answer to that question. One might have expected that a panic-inducing pandemic would have moved the needle on Medicare-for-all or similar such proposals, yet the political controversy has instead been entirely focused on vaccinations and lockdowns in the medical sphere and identity wars in the political sphere. The pressure for nationalization of the medical system in the US has now been overshadowed by identity politics, by which I mean a politics in which every question is seen as a litmus test of one’s humanity. If five or six years ago, the danger to the prospects of an ever-expanding service sector came from nationalization, the more likely process now seems to be decay of the body politic.
The simple point I wish to make here is that the long-term prospects of the healthcare sector ought not be taken for granted, despite the strength of its performance over the last 70 years or the forces, erupting from deep within the economy, that seem to have driven it forward.
Conclusion
Even setting aside the structural component of the healthcare sector’s performance and the threats posed to it by sociopolitical considerations, there are both long-term (to the end of the decade) and short-term (cyclical) risks that history points to.
Valuations are high relative to historical levels, to judge both from the dividend yield for the FF12 Healthcare index and the PE ratio for the XLV, and this has been a fairly reliable indicator of future long-term absolute performance.
Healthcare stocks have historically had high seven-year betas relative to an index of FF12 sectors. In an environment where it is reasonable to expect low long-term returns for the market as a whole, healthcare stocks (including tech- and financial-heavy components) ought to be expected to underperform the wider market.
Not only have PE ratios for the broader market been high, they have occurred at a time of extreme sectoral imbalances, and those imbalances appear to be in the process of shifting. Healthcare stocks are likely to be caught in the pincer of falling tech stocks and rising energy stocks (in relative terms). The bull market of the last decade appears to have been built in part on extremely low energy prices, and that period has either come to an end or is at least stabilizing around some new plateau. Historically, this has slowed healthcare performance considerably.
Healthcare stocks have done poorly during periods of rising commodity inflation, but they have done even worse in periods of deflationary growth shocks. There appears to be a risk of such an outcome in the coming years, as commodity supercycles have historically been tied to developments in technology, global political stability, and equity yields, and those indicators point more towards “secular” disinflation than high inflation. The current deceleration in commodity prices across the board support this interpretation.
Over the short term, large-cap healthcare stocks, especially in industries like Pharmaceuticals, Healthcare Providers, and Biotechnology, have lived up to the sector’s defensive reputation. But, as we saw near the beginning of the article, the sector has never been immune to cyclical selloffs. Transitions both from “secular” bull markets to “secular bears” and from one sectoral hierarchy (especially a tech-led one) to another (especially an energy-led one) tend to be cyclically volatile. Energy shocks specifically appear to trigger these transitions. Inverted yield curves appear to push in that direction, as well. The current selloff is likely to continue into 2024, even if it is marked by bear market rallies along the way.
For these reasons, I think that the XLV is likely to fall significantly lower over the next two years, probably revisiting 2020 lows (around 75) in that period and it is at considerable risk of failing to regain its 2022 levels for the remainder of the decade. In my opinion, Consumer Staples (XLP), Energy (XLE), Basic Materials (XLB), and Industrials (XLI) are likely to outperform XLV over the long term, but Treasuries (IEF, TLT, ZROZ) are likely the best asset class for now.
Be the first to comment