

Thinkhubstudio
Dear Investors,
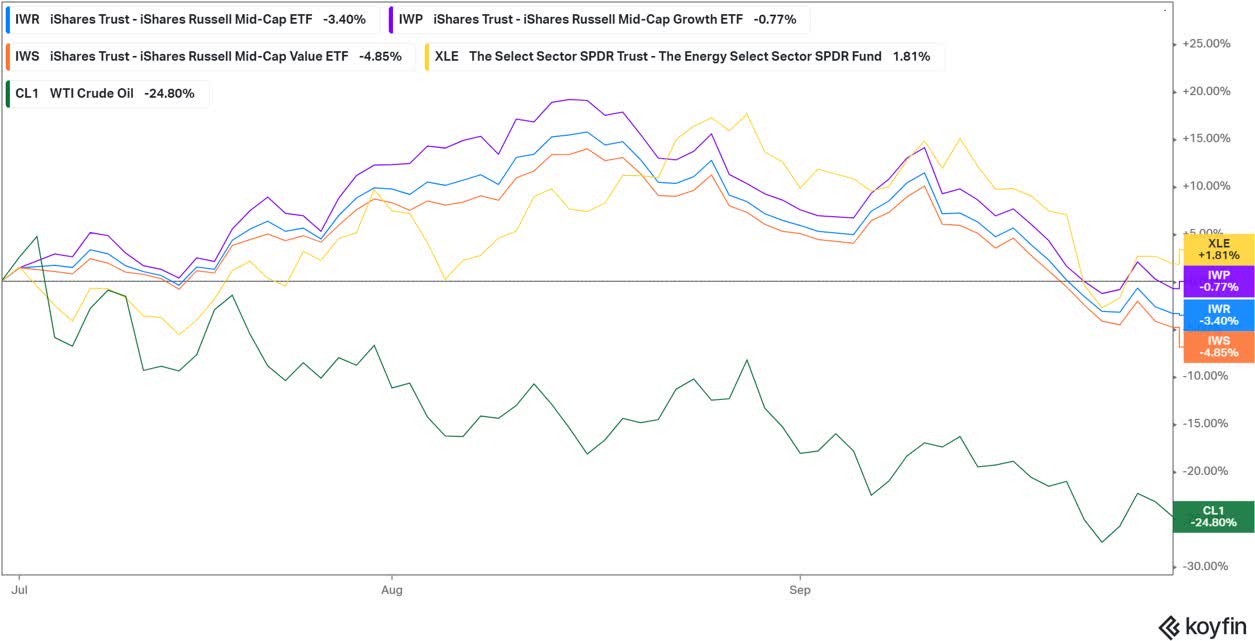
The Headwaters Capital portfolio gained +1.8% compared to a -3.4% decline for the Russell Mid Cap index in Q3 2022. A brief discussion of the performance and trading activity during the quarter is presented below.
|
Headwaters Capital Returns |
Q3 ’22 |
2021 |
YTD ’22 (9/30/22) |
Since Inception (1/4/2021) |
|
Headwaters Capital (Gross) |
1.8% |
17.9% |
-28.0% |
-15.1% |
|
Headwaters Capital (Net) |
1.6% |
17.1% |
-28.4% |
-16.2% |
|
Russell Mid Cap Index |
-3.4% |
22.6% |
-24.3% |
-7.2% |
|
*Performance for the Headwaters Capital portfolio has been calculated by Liccar Fund Services for the period presented above. **Individual SMA performance may differ from the results presented above. The composite performance (“portfolio” or “strategy”) is calculated using the return of a representative portfolio invested in accordance with Headwaters Capital’s fully discretionary accounts under management opened and funded prior to January 1, 2021. The performance data was calculated on a total return basis, including reinvestments of dividends and interest, accrued income, and realized and unrealized gains or losses. The returns also reflect a deduction of advisory fees, commissions charged on transactions, and fees for related services. For further information about the total portfolio’s performance, please contact Headwaters at the email address listed. |
Q3 ’22 Performance Review
Outperformance for the Headwaters Capital portfolio during Q3 was largely driven by stock selection (see below). The market traded with significant volatility in aggregate during the quarter, however dispersion between investment styles and sectors was less pronounced than in 1H ’22. Once again, oil and gas stocks (which the HCM portfolio does not currently own) led the market during Q3, despite the significant decline in oil prices.
The market continues to exhibit elevated volatility as conflicting factors such as extreme investor pessimism, more reasonable equity valuations, a hawkish and determined Fed and early signs of slowing economic data all create an uncertain environment for the market going forward.
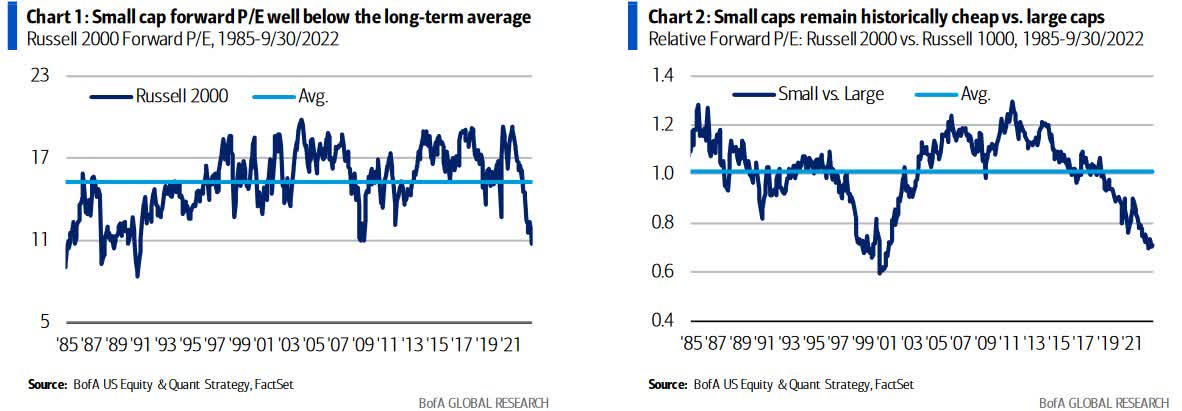
My thoughts on the future direction of the market are largely unchanged from those outlined in the Q2 Investor Letter. Three months since publishing that letter, I believe we have more clarity on the resolve of the Fed to fight inflation, but less clarity on the magnitude of economic contraction that will be caused by tighter financial conditions. Additionally, small cap valuations are cheaper on both an absolute and relative basis than a quarter ago, placing valuations for the index near trough levels.
While volatility is likely to persist in the short-term, I remain confident in the long-term underlying business fundamentals for the 22 companies owned in the Headwaters portfolio. Bear markets like we are currently experiencing are good for wringing out many of the speculative excesses in the broader market and may lead to permanent losses for these types of companies. However, for high quality businesses with durable long-term earnings growth, markets like this present a rare opportunity to buy these companies at reasonable short-term valuations and cheap long-term valuations.
Q3 ’22 Portfolio Review
Top Contributor: Inotiv (NOTV) +76%. The portfolio’s top detractor from Q2 saw a strong rebound in Q3 as the company settled the DOJ investigation and fundamentals of the business continued to outperform expectations. Despite the significant share price appreciation during the quarter, I continue to believe that shares are significantly undervalued. Insider buying continued during the quarter at prices 28% higher than the stock price at quarter end, implying that management is also optimistic about future returns for the company.
Top Detractor: Cable One (CABO) -34%. Cable One’s share price declined -34% during the quarter as investor fear around competition in the broadband market drove significant multiple compression for the stock. Fundamentals for CABO continue to be healthy, albeit with a deceleration in broadband net adds. While this slowing pace of customer additions was expected following the COVID pull forward of new subscribers, investors are grappling with the ability for CABO and the broadband industry as a whole to generate subscriber growth going forward given new competition from wireless 5G, government subsidized broadband investments and even new players such as Starlink. I believe that CABO remains more insulated than most players given its largely rural footprint leaves it less exposed to many of the industry competitive threats.
Trading Activity
Sells: Terminix (“TMX”). Rentokil UK announced its intention to acquire TMX in Q4 ’21 for a combination of cash and stock. The acquisition closed in early Q4 ’22 following regulatory approvals. I sold shares ahead the transaction closing given that I did not intend to hold shares of the combined entity.
Buys: UFP Technologies (UFPT). See below.
UFP Technologies: Materials Expertise & Specialized Manufacturing Creates a Valuable Partner to the Med Device Industry
Summary Thesis
- High single digit organic revenue growth underpinned by a growing medical end market, accelerating new product wins from increased R&D and improving customer retention. Organic growth supplemented with strategic M&A.
- Highly visible revenue growth supported by medically necessary consumable products and long duration contracts with high switching costs.
- Margin expansion as portfolio repositioning is largely complete and COVID supply chain disruptions subside.
- Management team with a proven history of execution combined with insider ownership provides confidence that the company will continue to be good stewards of capital.
Company Overview
UFP Technologies engages in the design, development and manufacturing of custom-engineered components, devices and packaging primarily in the medical end market. Leveraging its access to and engineering expertise in specialty foams, plastics and composites, the company designs and manufactures parts and devices that are single use in nature. Representative products include surgical robotic drapes, vascular tools, wound therapy products and orthopedic devices.
In many ways, UFP serves as an outsourced R&D partner for clients by assisting during front-end product design and engineering. Through the development of customized machinery, manufacturing expertise and a network of FDA certified manufacturing facilties and clean rooms, UFP can oversee the transition from prototype to commercial production. The highly engineered nature of UFP’s products and the rigorous FDA approval process for both new product introductions and manufacturing techniques leads to deep and long-lasting customer relationships for the company. UFP counts 26 of the top 30 medical device companies as customers, which highlights the company’s design, engineering and manufacturing expertise in the medical market.
UFP’s revenues are highly visible as the medical end market has relatively stable demand given the critical nature of the products and most of UFP’s end products are consumable in nature in the form of single-use or single patient devices. Long-term contracts with high switching costs provide even greater revenue visibility for the company. The steady nature of UFP’s revenue allows the company to invest confidently in both R&D and capacity expansions that generate high returns on capital. As the company continues to focus more on product development alongside customers, it not only builds stronger customer relationships, but it will also result in higher margin revenue as these more innovative products come to market.
Business Transformation
UFP has completed a significant transformation from a commoditized packaging company serving cyclical end markets to a custom manufacturer of specially engineered components and devices for the highly regulated medical end market. In 2015, 41% of UFP’s revenue was generated from the medical end market and the majority of UFP’s other revenue came from commoditized packaging to cyclical end markets such as consumer, industrial and electronics. Today, 80% of UFP’s revenue is generated from the medical market, which is the result of a multiyear strategic plan to exit commoditized, low margin packaging businesses and instead focus on highly engineered medical components and devices that carry higher margins. The regulated nature of the medical end market creates high switching costs for UFP’s customers given the time and effort required to reach FDA approval. The high switching costs combined with long product life cycles provides UFP with an annuity-like revenue stream once a contract is won. A brief timeline of the key events in UFP’s transformation is shown below.
- Creating the Platform to Grow (2013-2016): UFP undertook a multi-year strategic repositioning of the portfolio to better position the company for future growth in the medical end market. The process involved facility consolidations, investments in new production capabilities, capacity expansions and an ERP system upgrade. During this period, the company was forced to requalify programs with existing customers, incurred restructuring charges and saw margin degradation as facilities were initially underutilized. However, this comprehensive portfolio overhaul created a platform that could better serve the medical end market.
- Investing in Medical Growth (2018): Acquisition of Dielectrics, which brought specialized manufacturing capabilities to UFP and deeper penetration into the medical device end markets. Following the acquisition of Dielectrics, medical sales accounted for 60% of revenue compared to 47% in the year prior to the transaction.
- Medical Market Expansion (2021): UFP completed 3 acquisitions in the medical end market in late 2021 and early 2022. The acquisitions enhanced manufacturing capabilities, added new customers and increased the company’s offshore manufacturing footprint. Historically, as products reach maturity, med device companies have sought to move manufacturing offshore to reduce costs. UFP’s customers encouraged UFP to expand their offshore manufacturing capabilities as they wanted UFP to retain the business given that the FDA had already certified UFP as the manufacturer. Prior to the offshore manufacturing capabilities, UFP lost this business, which resulted in annual churn that UFP had to offset through new contract wins. In addition to acquisitions, UFP also built its own manufacturing facility in Mexico, which is set to come online in 2H ’22. The expansion of the company’s offshore manufacturing expertise should allow the company to retain more programs as they reach maturity, which will reduce customer/product churn. Pro forma for these acquisitions and the divestiture below, medical sales now comprise 80% of UFP revenue.
- Portfolio Pruning (2022): At the beginning of Q3 ’22, UFP divested its low margin Molded Fiber packaging business. Proceeds were used to pay down debt associated with the three acquisitions above. Pro forma for the acquisitions and divestiture, leverage is <1.0x on a net debt/EBITDA basis.
This historical background illustrates that UFP is led by a management team with a long-term focus and a proven history of successful acquisitions and divestitures. Acquisitions that add manufacturing capabilities, materials expertise or geographic expansion all serve to make UFP a more valuable partner to its customers and, given the strong cash flow of the business, I expect M&A to continue. The successful transformation of UFP into a preferred R&D and manufacturing partner for the medical device industry gives me confidence that this management team is well suited to continue programmatic M&A. Insider ownership by the CEO (6% of the Company’s stock worth $40mm) aligns management with shareholders and provides further comfort that management will be good stewards of capital.
UFP still derives 20% of its revenue from the auto, aerospace and defense and industrial end markets. A&D has many of the same characteristics as the medical end market in the form of long duration contracts and highly engineered products. The industrial and auto markets are more commoditized and could be sold or exited in the future (similar to the recent sale of the molded fiber business), although the company continues to benefit from product innovations in these end markets that can also serve the medical market.
Financials
As described above, UFP’s transformation has been a long process, but is largely complete today. The culmination of the transformation into a medical device supplier with higher organic growth and margins has been masked by COVID disruptions which have impacted both top line and profitability. Consolidated organic growth for UFP averaged 2.6% from 2015-2019 but is likely to sustain at a significantly higher level now that the portfolio repositioning is largely complete. While the company targets organic revenue growth on a consolidated basis of 57%, I believe the company will grow faster than this target given that the medical end market for UFP has grown at a +6% organic CAGR since 2015 (+9% excluding COVID impacted 2020). Additionally, UFP’s medical end market growth is likely to accelerate as broader offshore capabilities reduce churn while an increased focus on product R&D should lead to more new product wins. The accelerating organic growth will be supplemented with a steady M&A program, resulting in top-line growth of 10-15%, depending on the pace of acquisitions.
From a margin perspective, UFP expects improvement in gross margins as supply chain pressures ease and manufacturing utilization increases. Management currently expects operating margins to improve from ~11% (LTM Q2 ’22) to 12-15%, supporting operating income growth well above revenue growth. As CAPEX normalizes following the recent capacity expansions, FCF should compound at a 15-20% CAGR for the next 5 years. The strong free cash flow and low leverage (<1.0x net debt/EBTIDA) provide the company with ample capacity for strategic M&A.
At a minimum, UFP should maintain its valuation multiple of 14x EBITDA. However, as the portfolio repositioning becomes more visible in 2023, growth rates accelerate and margins improve, the company could command a valuation premium in line with other specialty manufacturers in the 16-18x EBITDA range.
Investment Summary
UFP is a perfect example of the type of business that can tax efficiently compound for many years and is ideally suited for the HCM portfolio. UFP’s competitive advantages in the design and manufacturing of medical devices and components supports a platform that can execute on the long-term growth opportunities in this market. Recurring revenue from a growing medical end market combined with long-term customer contracts provides high visibility into future revenue growth. Improving margins will generate healthy free cash flow that can be deployed into strategic M&A that serves to deepen UFP’s value proposition to customers. An experienced management team with high insider ownership provides confidence that management will be disciplined allocators of capital.
The combination of all these factors supports an expectation that UFP can compound investor capital at a 15%+ CAGR over the next 5 years. Growing investor appreciation for the transformed UFP portfolio presents an opportunity for even higher share price gains as the market begins to appreciate the durability of UFP’s revenue and the improved return profile of this primarily medical portfolio.
As always, if you have any questions, please do not hesitate to contact me.
Christopher Godfrey
Important DisclosureThis report is solely for informational purposes and shall not constitute an offer to sell or the solicitation to buy securities. The opinions expressed herein represent the current views of the author(s) at the time of publication and are provided for limited purposes, are not definitive investment advice, and should not be relied on as such. The information presented in this report has been developed internally and/or obtained from sources believed to be reliable; however, Headwaters Capital Management, LLC (the “firm”) does not guarantee the accuracy, adequacy or completeness of such information. Predictions, opinions, and other information contained in this report are subject to change continually and without notice of any kind and may no longer be true after the date indicated. Any forward-looking statements speak only as of the date they are made, and the firm assumes no duty to and does not undertake to update forward-looking statements. Forward-looking statements are subject to numerous assumptions, risks and uncertainties, which change over time. Actual results could differ materially from those anticipated in forward-looking statements. In particular, target returns are based on the firm’s historical data regarding asset class and strategy. There is no guarantee that targeted returns will be realized or achieved or that an investment strategy will be successful. Investors should keep in mind that the securities markets are volatile and unpredictable. There are no guarantees that the historical performance of an investment, portfolio, or asset class will have a direct correlation with its future performance. The composite performance (“portfolio” or “strategy”) is calculated using the return of a representative portfolio invested in accordance with Headwaters Capital’s fully discretionary accounts under management opened and funded prior to January 1, 2021. The performance data was calculated on a total return basis, including reinvestments of dividends and interest, accrued income, and realized and unrealized gains or losses. The returns also reflect a deduction of advisory fees, commissions charged on transactions, and fees for related services. For further information about the total portfolio’s performance, please contact Headwaters at www.headwaterscapmgmt.com or via phone at (404) 285 -0829 Investing in small- and mid-size companies can involve risks such as less publicly available information than larger companies, volatility, and less liquidity. Investing in a more limited number of issuers and sectors can be subject to greater market fluctuation. Portfolios that concentrate investments in a certain sector may be subject to greater risk than portfolios that invest more broadly, as companies in that sector may share common characteristics and may react similarly to market developments or other factors affecting their values. Headwaters Capital is a registered investment adviser doing business in Texas and Georgia. Registration does not imply a certain level of skill or training. For additional information about Headwaters Capital, including its services and fees, please review the firm’s disclosure statement as set forth in Form ADV and is available at no charge at IAPD – Investment Adviser Public Disclosure – Homepage. Past performance does not guarantee future results. |
Editor’s Note: The summary bullets for this article were chosen by Seeking Alpha editors.
Be the first to comment