

Sohel_Parvez_Haque/iStock via Getty Images
Back in January of this year, I published an article, Value-Based Price Targets For VOO Under Different Possible Scenarios, referring to the Vanguard S&P 500 ETF (VOO), which tracks the S&P 500 Index (SP500) very closely. In that article, I came up with price targets that would satisfy investors who take valuation into account.
To do this I looked at what the historical P/E ratio of the S&P 500 had been through multi-year periods characterized by different market conditions that took place over the past 20 years. I used Fastgraphs to calculate the long-term average value P/E ratio for each period, and suggested that the P/E ratio that prevailed in each might be useful for determining valuations now based on your perception of which kind of market condition we might be in for the next several years.
These are the four different Price/Earnings ratios that prevailed during four periods selected from the past 20 years that experienced very different market conditions:
| Market Condition | P/E Ratio |
| Priced for healthy corporate earnings growth | 20.71 |
| Priced for an extended stagnant period without a crash | 17.68 |
| Priced for a post-recession period following over-valuation | 16.97 |
| Priced for a recession that destroys confidence in the market | 13.63 |
At the time I wrote that article, the P/E of the S&P 500 was at 4410, and its forward-looking P/E was 23.54. That was still very high in contrast to even the most optimistic conditions that had prevailed for multi-year periods, even after the significant share price drop that occurred at the beginning of January.
As we all know, the S&P 500 declined another 15% since that time. Now the S&P 500 has experienced a bear market that recovered slightly, only to plunge again into bear territory, this stark division in sentiment between bulls and bears has led to increased price volatility for the ETFs that track the S&P 500. It has not been unusual to see them fluctuate 2% or more, up or down, on any given day.
S&P 500 ETFs – 1 Month Total Return
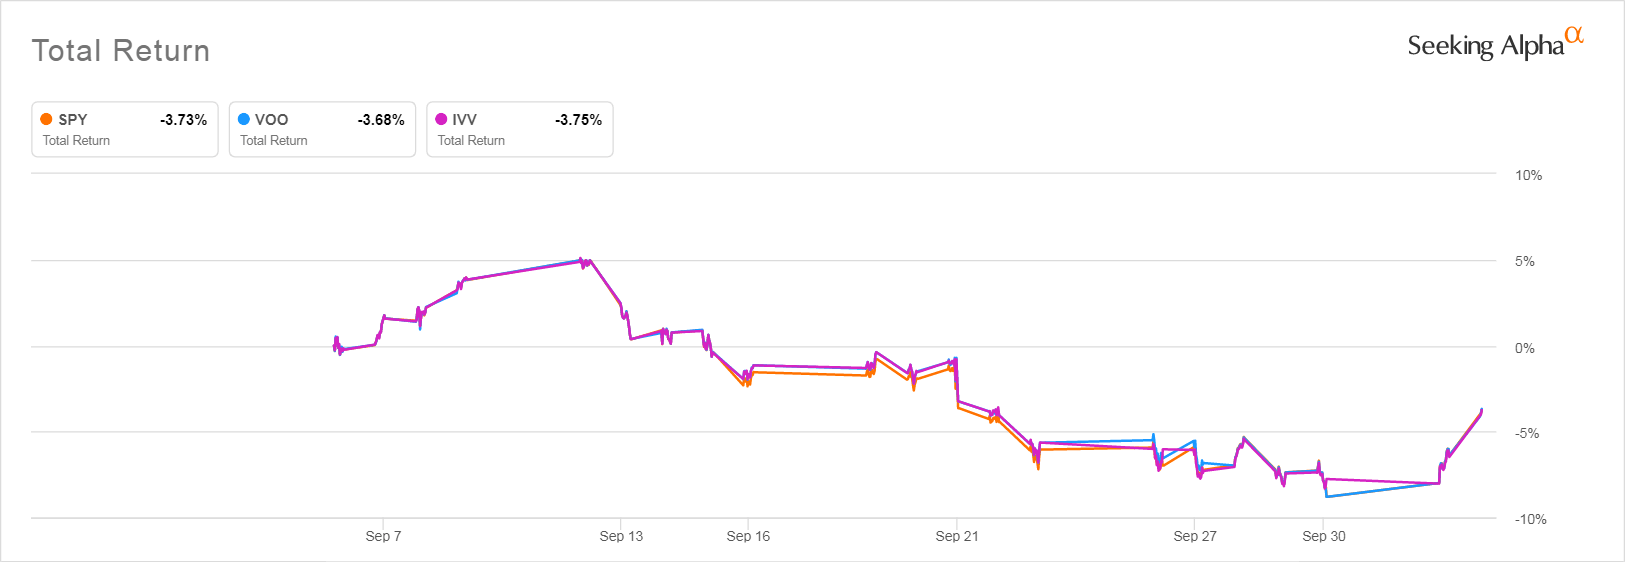
Seeking Alpha
So, with the third quarter now over, I thought this would be a good time to take another look at the S&P 500’s current P/E ratio, to see if its price has, in fact, dropped into a range where it gives it a P/E ratio that would convince a valuation-driven investor to increase their allocation to shares of one of the major S&P 500 ETFs.
Fastgraphs No Longer Reports S&P 500 Data
Since I wrote that January article, Fastgraphs is no longer reporting data for the S&P 500, due, I was told, to the exorbitant price S&P Global charges for the index data for that single index. Instead, Fastgraphs now reports data for the SPDR S&P 500 Trust ETF (NYSEARCA:SPY) which it claims performs in a manner similar enough to the S&P 500 to be used for analyses based on it.
Taking an average of the daily closing price of SPY and the S&P 500 over several months and calculating the average difference between the two, I was able to confirm that SPY’s price does track the S&P 500 very closely. You can convert an S&P 500 price to a SPY price and get a very close approximation of the actual price at any given time using this formula:
SPY Price = S&P 500 Price *.09949
You can calculate an S&P 500 Price using the inverse formula:
S&P 500 Price = SPY Price/.09949
I used this same relationship to convert the earnings estimate reported for SPY into the corresponding earnings estimate for the S&P 500. It won’t be exact, but it should be close enough, especially given how inexact the estimates are for any stock’s future earnings and how much more inexact the estimates must be for an ETF holding over 500 stocks.
Calculating Today’s P/E Based on Fastgraph’s Forward Earnings Estimate
Fastgraphs currently reports analysts’ estimates for the S&P 500’s 2022 earnings to be $22.61. Using that data, we get the following table showing what P/E ratio based on current earnings would correspond to historical fair values for the four very different market conditions we might encounter.
Here is how SPY’s Price looks as I write on 10/4/2022
SPY Valuation with Estimated VOO and S&P 500 Prices 10/4/2022
| P/E Ratio | VOO Price | SPY Price | S&P Price | SPY Estimated Earnings | |
| CURRENT CONDITIONS | 16.62 | 345.88 | $375.67 | $3,776.00 | $22.61 |
Since I personally use VOO to invest in the S&P 500, I use the conversion factor I had come up with in my previous article to convert the S&P 500 price to a close approximation of VOO’s price. That conversion formula is:
VOO Price = S&P 500 Price * .0916
Based on the analysts’ estimates that SPY’s earnings for 2022 will come in at $22.61 we come up with these prices for VOO, SPY, and the S&P 500 that would generate the P/E ratios that prevailed during periods when the market displayed the following conditions:
Estimated Fair Value P/E Ratios Under Different Scenarios
| Market Condition | P/E Ratio | VOO Price | SPY Price | S&P Price | SPY Estimated Earnings |
| Priced for healthy corporate earnings growth | 20.71 | $431.12 | $468.25 | 4,706.53 | $22.61 |
| Priced for an extended stagnant period without a crash | 17.68 | $368.04 | $399.74 | 4,017.94 | |
| Priced for a post-recession period following over-valuation | 16.97 | $353.26 | $383.69 | 3,856.59 | |
| Priced for a recession that destroys confidence in the market | 13.63 | $283.73 | $308.17 | 3,097.54 |
As you can see, using these analysts’ earnings estimates, the S&P today would appear to be priced at a price lower than the historical average P/E ratio for periods when the market went through an extended period of stagnation. As reported in my earlier article, I came up with this P/E ratio by taking the average P/E ratio of the S&P 500 over the entire period from January 2003 to January of 2022, which was 17.68.
SPY and by extension the S&P 500 and VOO also appear to be priced below the P/E that prevailed in the period several years after the Dot.com bust.
So based solely on this, admittedly crude, valuation approximation, it would look like this would be a great time to buy into an ETF like SPY, VOO, or perhaps the iShares Core S&P 500 ETF (IVV) that tracks the S&P 500. The valuation is far better than it has been since most of the period since 2013.
SPY Price and Earnings 2002 until Now
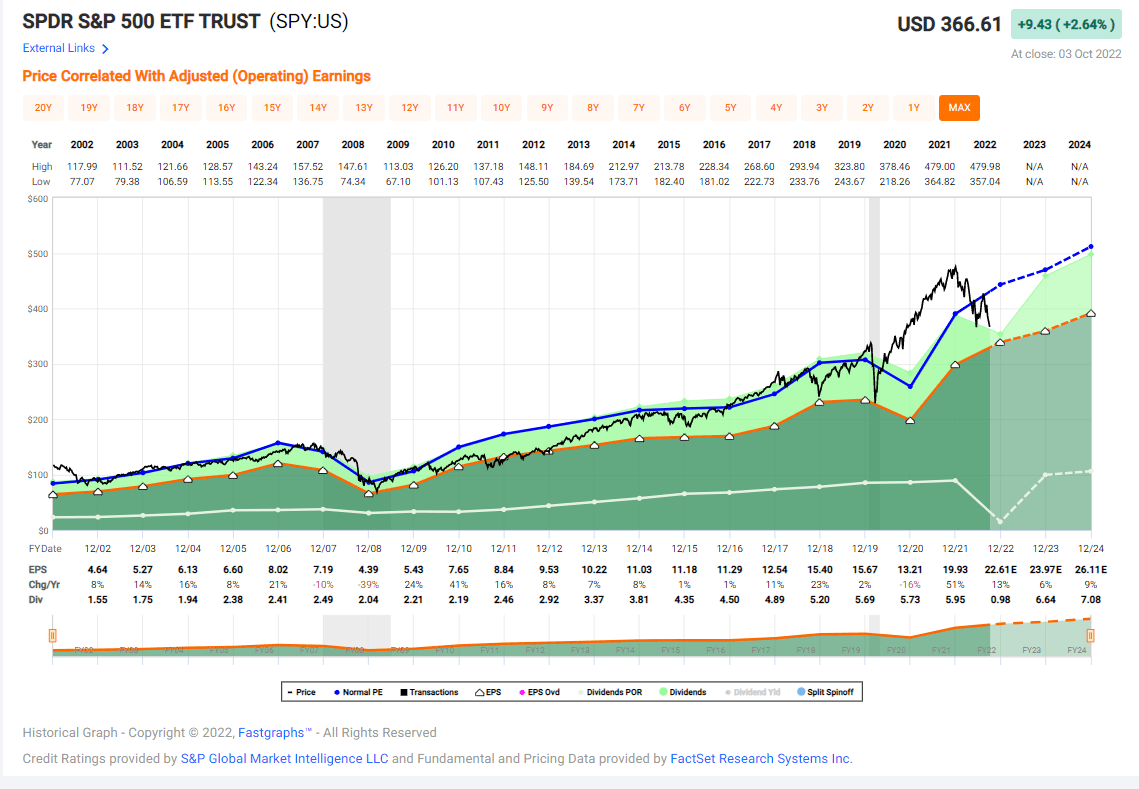
` (fastgraphs.com)
But Are These Forward Earnings Estimates Too Rosy?
The P/E ratio changes dramatically if the price remains the same while earnings fall. The earnings estimate for Year End 2022 reported by Fastgraphs now, based on Factset data, have actually risen from where they were in January when I wrote the earlier article. Back in January, analysts were predicting that S&P 500 earnings would grow by 12% in 2022. Now they appear to be assuming earnings growth of 13.46%.
Current Analyst Forecasts for SPY Earnings from Fastgraphs
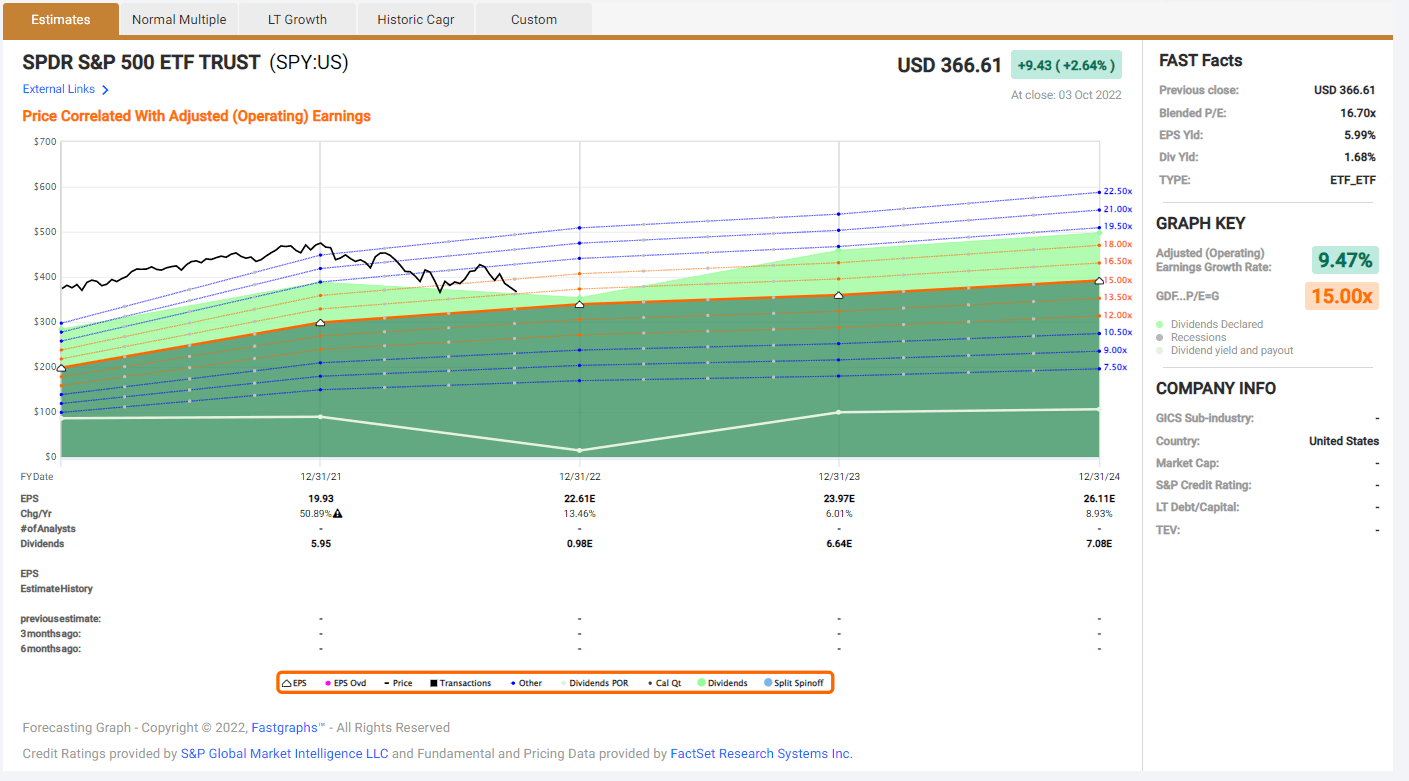
fastgraphs.com
I found it very hard to believe that these estimates were up-to-date. So I went to another useful source of information about the S&P 500, the YRI S&P 500 Earnings Forecast, published by Yardeni Research, which displays Yardeni’s estimates along with the “Analysts’ Consensus.”
Yardeni’s Data Is Up-To-Date
The report available online as I write this was just published on October 3, 2022, which is as fresh as you are going to get. I therefore give it more credence than forecast found in Fastgraphs. Here are Yardeni and Analysts’ forecasts as reported in this most recent YRI S&P 500 Forecast report.
Estimated 2022 S&P 500 Earnings
| Yardeni | Analysts’ Consensus | |||
| Level | YOY % | Level | YOY % | |
| 2022 | 215.00 | 3.10% | 223.72 | 7.30% |
Yardeni’s report tells us that the analyst consensus data used for that report comes from I/B/E/S data by Refinitiv.
As you can see, the Analysts’ Consensus reported by Yardeni is far less optimistic than the one displayed by Fastgraphs. It predicts earnings growth of only 7.30%. Yardeni’s own S&P 500 growth forecast is only half of that, at 3.10%.
Plugging in the Analysts’ Consensus reported here into the spreadsheet I use to calculate target P/E ratios based on the S&P 500’s price and earnings at any given time we come up with this up-to-date P/E ratio as of the time I am writing in the morning of October 4, 2022. I have also used the formulas given above to estimate the corresponding price of SPY and VOO.
Current P/E Ratio Based on Yardeni-Reported Analysts’ Consensus
| Market Condition | P/E Ratio | VOO Price | SPY Price | S&P Price | S&P Estimated Earnings – Yardeni Analysts |
| CURRENT CONDITIONS | 16.88 | 345.88 | $375.67 | $3,776.00 | $223.72 |
The 16.88 P/E ratio calculated here is slightly higher than the one we saw using Factset data reported by Fastgraphs. It is still lower than the historical average P/E that prevailed during a period following overvaluation following the dot.com bust.
But recall that Yardeni’s own estimate of S&P 500 earnings growth is about half that of the analysts’ he cites. If we use the Yardeni estimate and the S&P 500 level right now, we get this result.
Current P/E Ratio Based on Yardeni Research Estimate
| Market Condition | P/E Ratio | VOO Price | SPY Price | S&P Price | YRI Earnings Estimate |
| CURRENT CONDITIONS | 17.56 | 345.88 | $375.67 | $3,776.00 | $215.00 |
More Modest Earnings Estimates Push Up the P/E Significantly
As you can see, the more pessimistic earnings estimate gives us a P/E ratio that is priced for a stagnant period without a crash, but not a period following overvaluation.
This points out how fragile any P/E ratio you see reported really is if it incorporates forward looking estimates. Analysts’ estimates change and the consensus estimates from one data provider can be very different from that of another.
Take with a grain of salt, therefore, any P/E ratio you see reported for any ETF, as the only accurate P/E figures are those for past years when actual earnings can be used to compute the P/E ratio. ETF providers don’t reveal the extent to which the current P/E ratios they report embody forward estimates or if they do, whose estimates they are using.
Takeaways for Valuation-Guided Investors
Keep a close eye on third quarter earnings reports and corporate forward guidance because if earnings are declining more than expected, the P/E ratio of the S&P 500 could surge.
Ignore any reporting that focuses on whether or not earnings beat “beat analysts’ consensus.” What is important is whether earnings are rising Year over Year for the quarter, and how analysts’ full year estimates change after a significant number of S&P 500 companies have reported those quarterly earnings.
Fastgraphs subscribers should be even more cautious. Though I have found Fastgraphs very helpful in the past when beginning my research into individual stocks, I have often been misled by those rosy P/E ratios forecast for the next year. Treat any P/E ratio you see as having a wide range around the number reported.
How Useful are Any Valuations Derived from The Past 20 Years?
Back testing and historical results drawn from a period of low inflation, stable prices, and historically well-below-average borrowing costs is going to be very misleading now that none of those characteristics describes the current market environment. That might mean that the P/E ratios that prevailed throughout the past 20 years might be less helpful than I originally thought back before the Russian invasion of Ukraine pushed inflation up to levels not seen in many decades.
We know for a fact that the P/E ratios that prevailed during the 1970s were far lower than any of the targets derived from the past 20 years.
Year End P/E ratios of the S&P 500 from 1970 to 1981
Year End Date P/E Ratio
| Jan 1, 1982 | 7.73 |
| Jan 1, 1981 | 9.02 |
| Jan 1, 1980 | 7.39 |
| Jan 1, 1979 | 7.88 |
| Jan 1, 1978 | 8.28 |
| Jan 1, 1977 | 10.41 |
| Jan 1, 1976 | 11.82 |
| Jan 1, 1975 | 8.30 |
| Jan 1, 1974 | 11.68 |
| Jan 1, 1973 | 18.09 |
| Jan 1, 1972 | 18.01 |
| Jan 1, 1971 | 18.12 |
| Jan 1, 1970 | 15.76 |
Source: www.multpl.com
Inflation really took off at the beginning of 1974 with the Oil Crisis tripling the price of a gallon of gasoline. A look at the P/E ratios that prevailed during this inflationary period is sobering. At current earnings, the price of the S&P 500 that would yield a P/E of 8.0 would be somewhere around 1800.
No one knows if the current inflationary period will persist. But knowing what the possibilities are, I recommend that if you want to build a position in any S&P 500 ETF the wisest choice is to dollar cost average. Make small buys every month. Don’t try to call a bottom or let FOMO get you investing money that the price of the S&P 500 was to drop precipitously would leave you without money you would need to spend.
Compared to the situation we had over the period surrounding COVID-19, the valuation of the S&P 500 looks a lot more reasonable. But it will only stay reasonable if earnings for the year come in at a level corresponding to one of these current estimates and if companies can continue growing their earnings at a modest annual rate.
If earnings crash and the S&P 500’s earnings for 2022 decrease from what they were in 2021, especially if companies issue downbeat forward guidance, the P/E ratio of the S&P 500 will shoot up. That will put it back into overvalued territory, using the historical average P/E ratio levels drawn from the past twenty years, even though its price has declined dramatically.
Be the first to comment