

Jira Pliankharom/iStock via Getty Images
I get it, traders want to see that high volume flush that often means “capitulation” where the last of the bulls have thrown in the towel… and that “capitulation” can often mark or confirm the low in the indices after a correction / bear market as a tradeable bottom.
Ok, so maybe it hasn’t happened in the SPX/SPY but has it occurred in other areas?
How about China names?
FXI, the iShares China Large Cap ETF, traded a huge amount of volume back in 3/16 which has marked the lows of ’22 (so far)
FXI Chart (Bloomberg)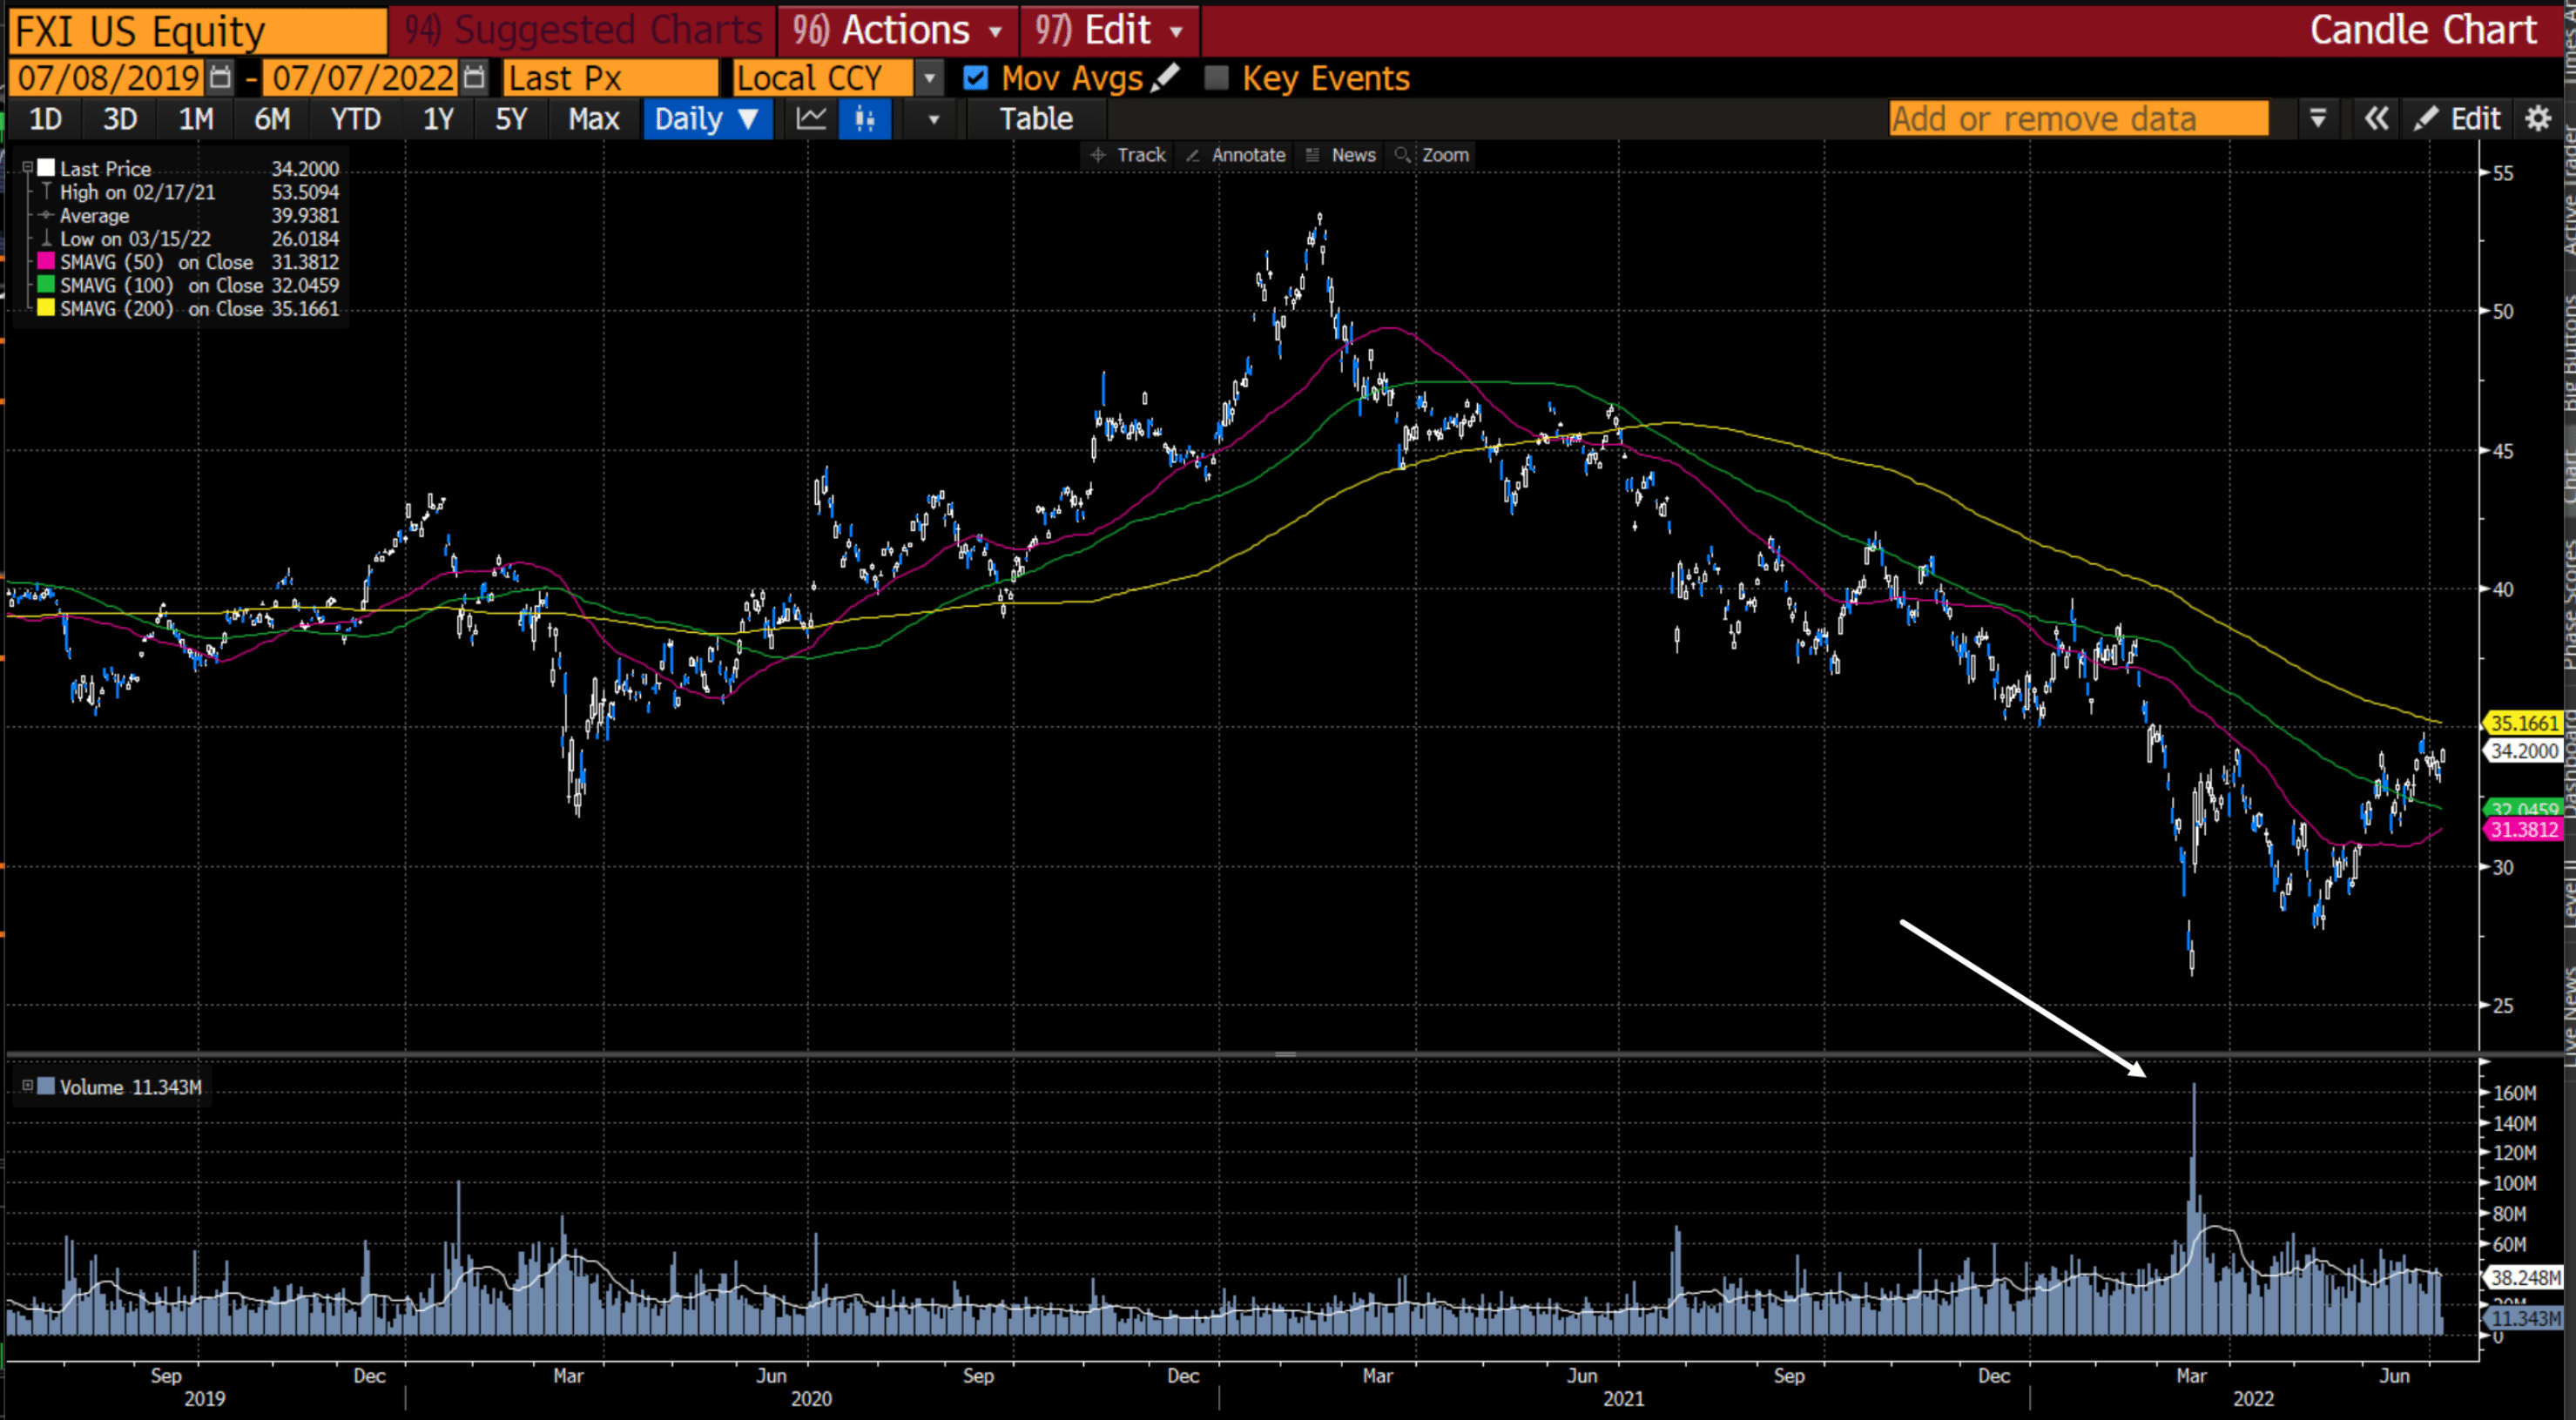
What about that ETF that gets all the attention in Growth land?
The ARK Innovation ETF (ARKK) traded its highest volume on 5/12, which was also the low so far for the year…
-
Was there big volume after a large pull back / downtrend -> YES
ARKK chart (Bloomberg)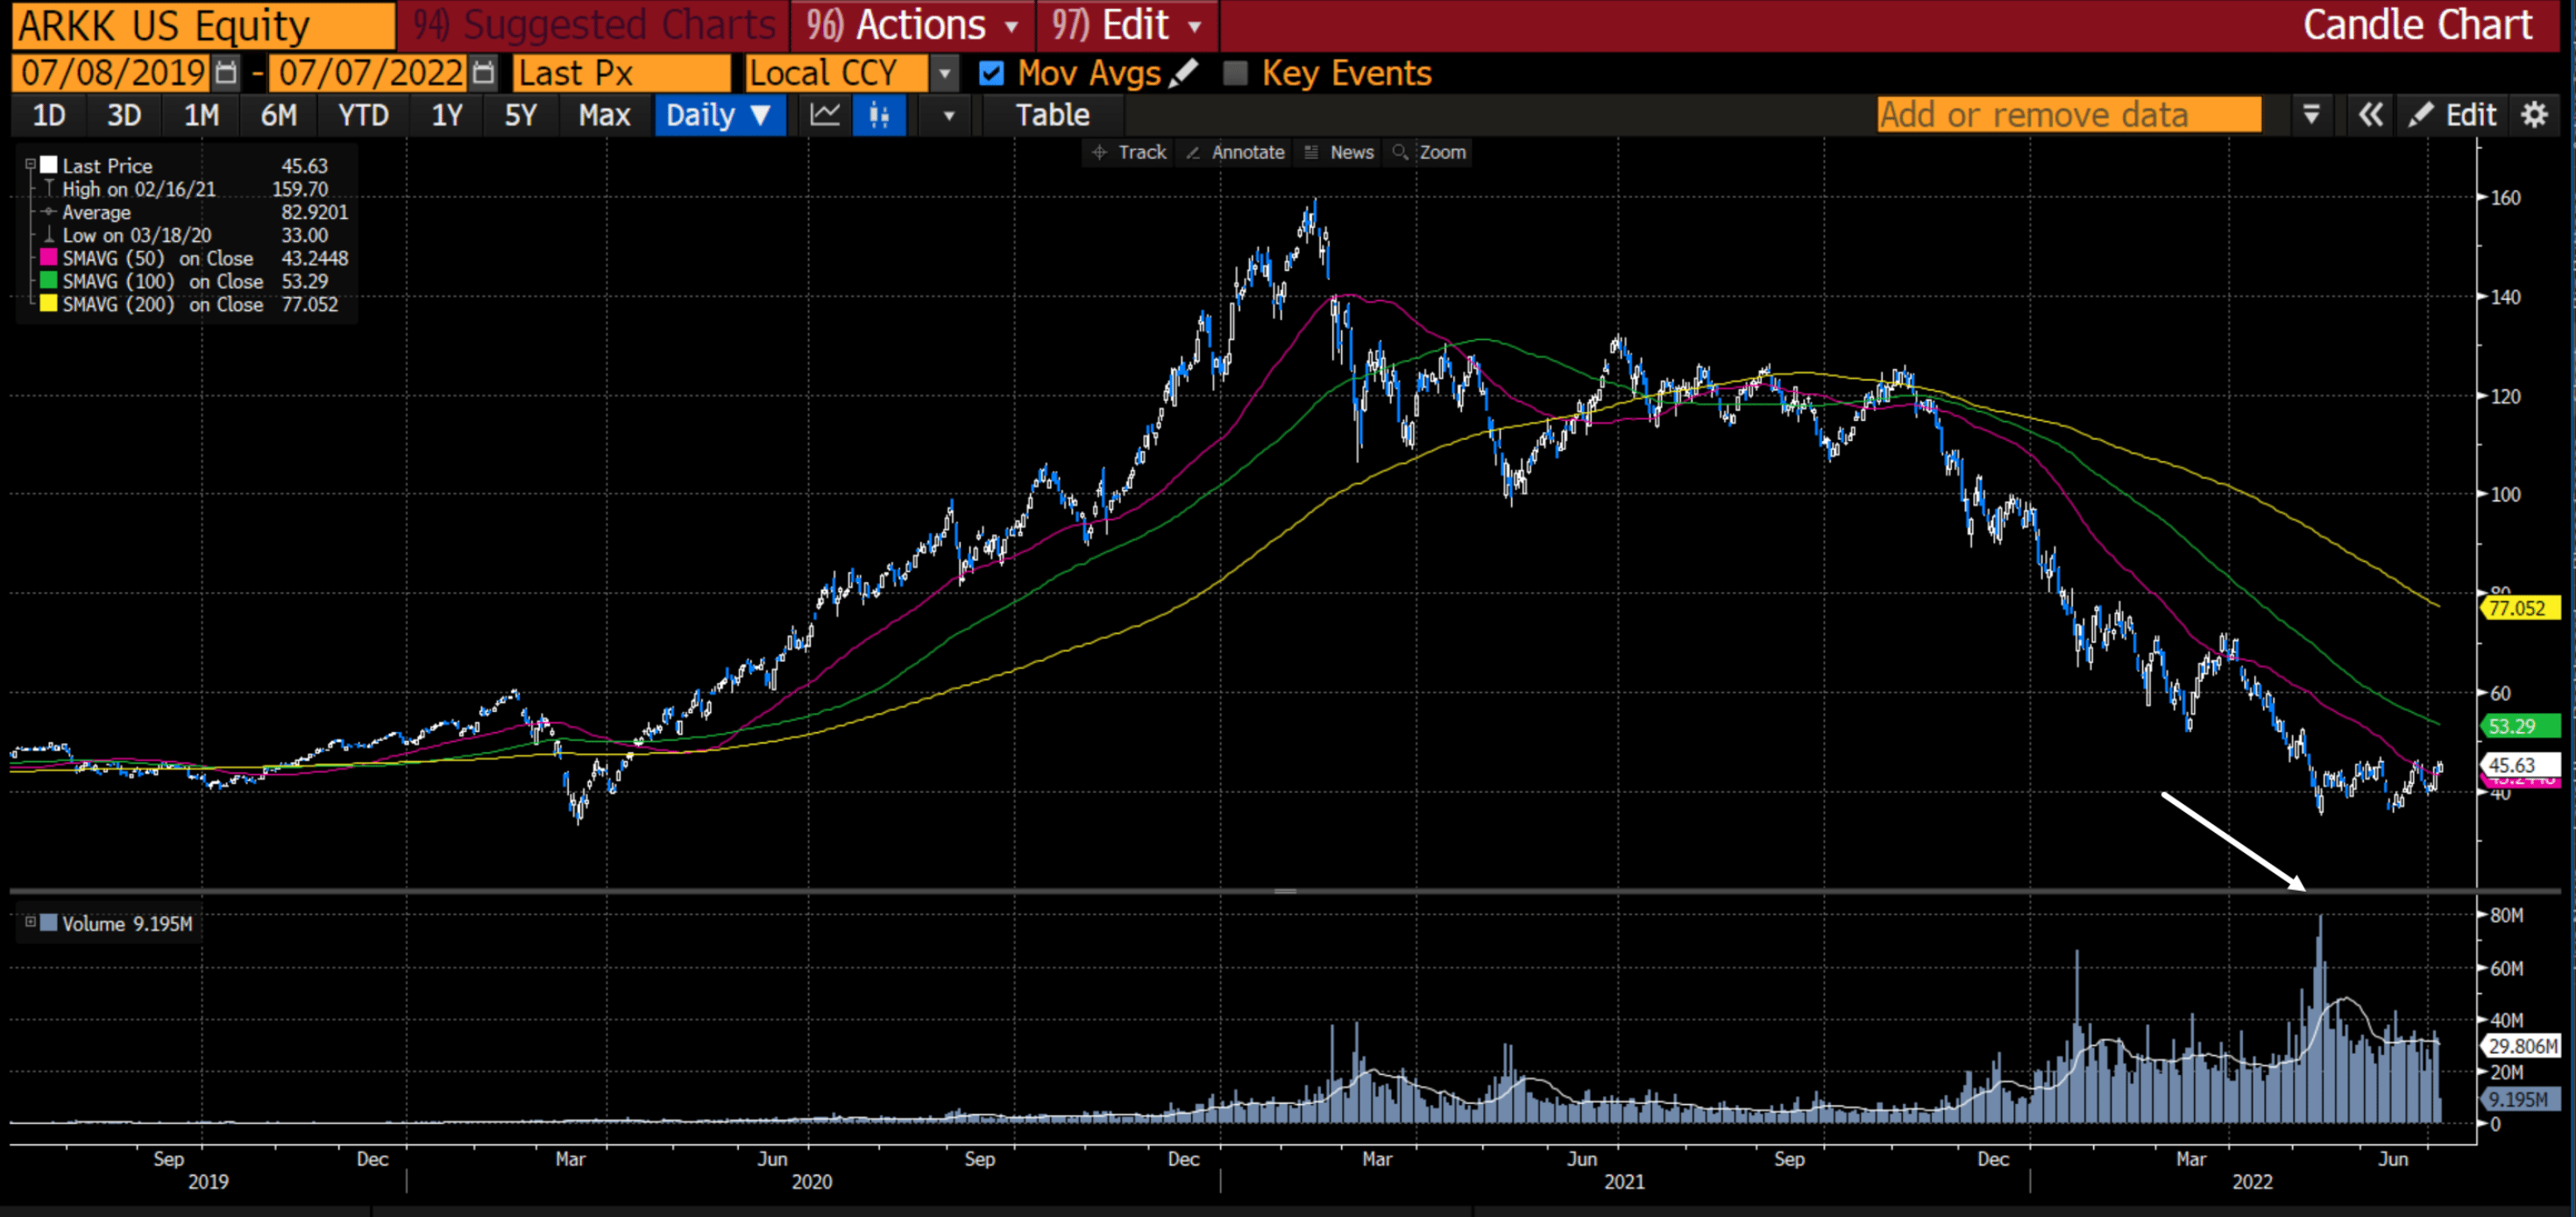
Biotech?
The XBI Equally Weighted ETF, XBI, also saw a series of high volume days in the week of 5/9 which marked a low as well this year…
- Was there big volume after a large pull back / downtrend ->
XBI chart (Bloomberg)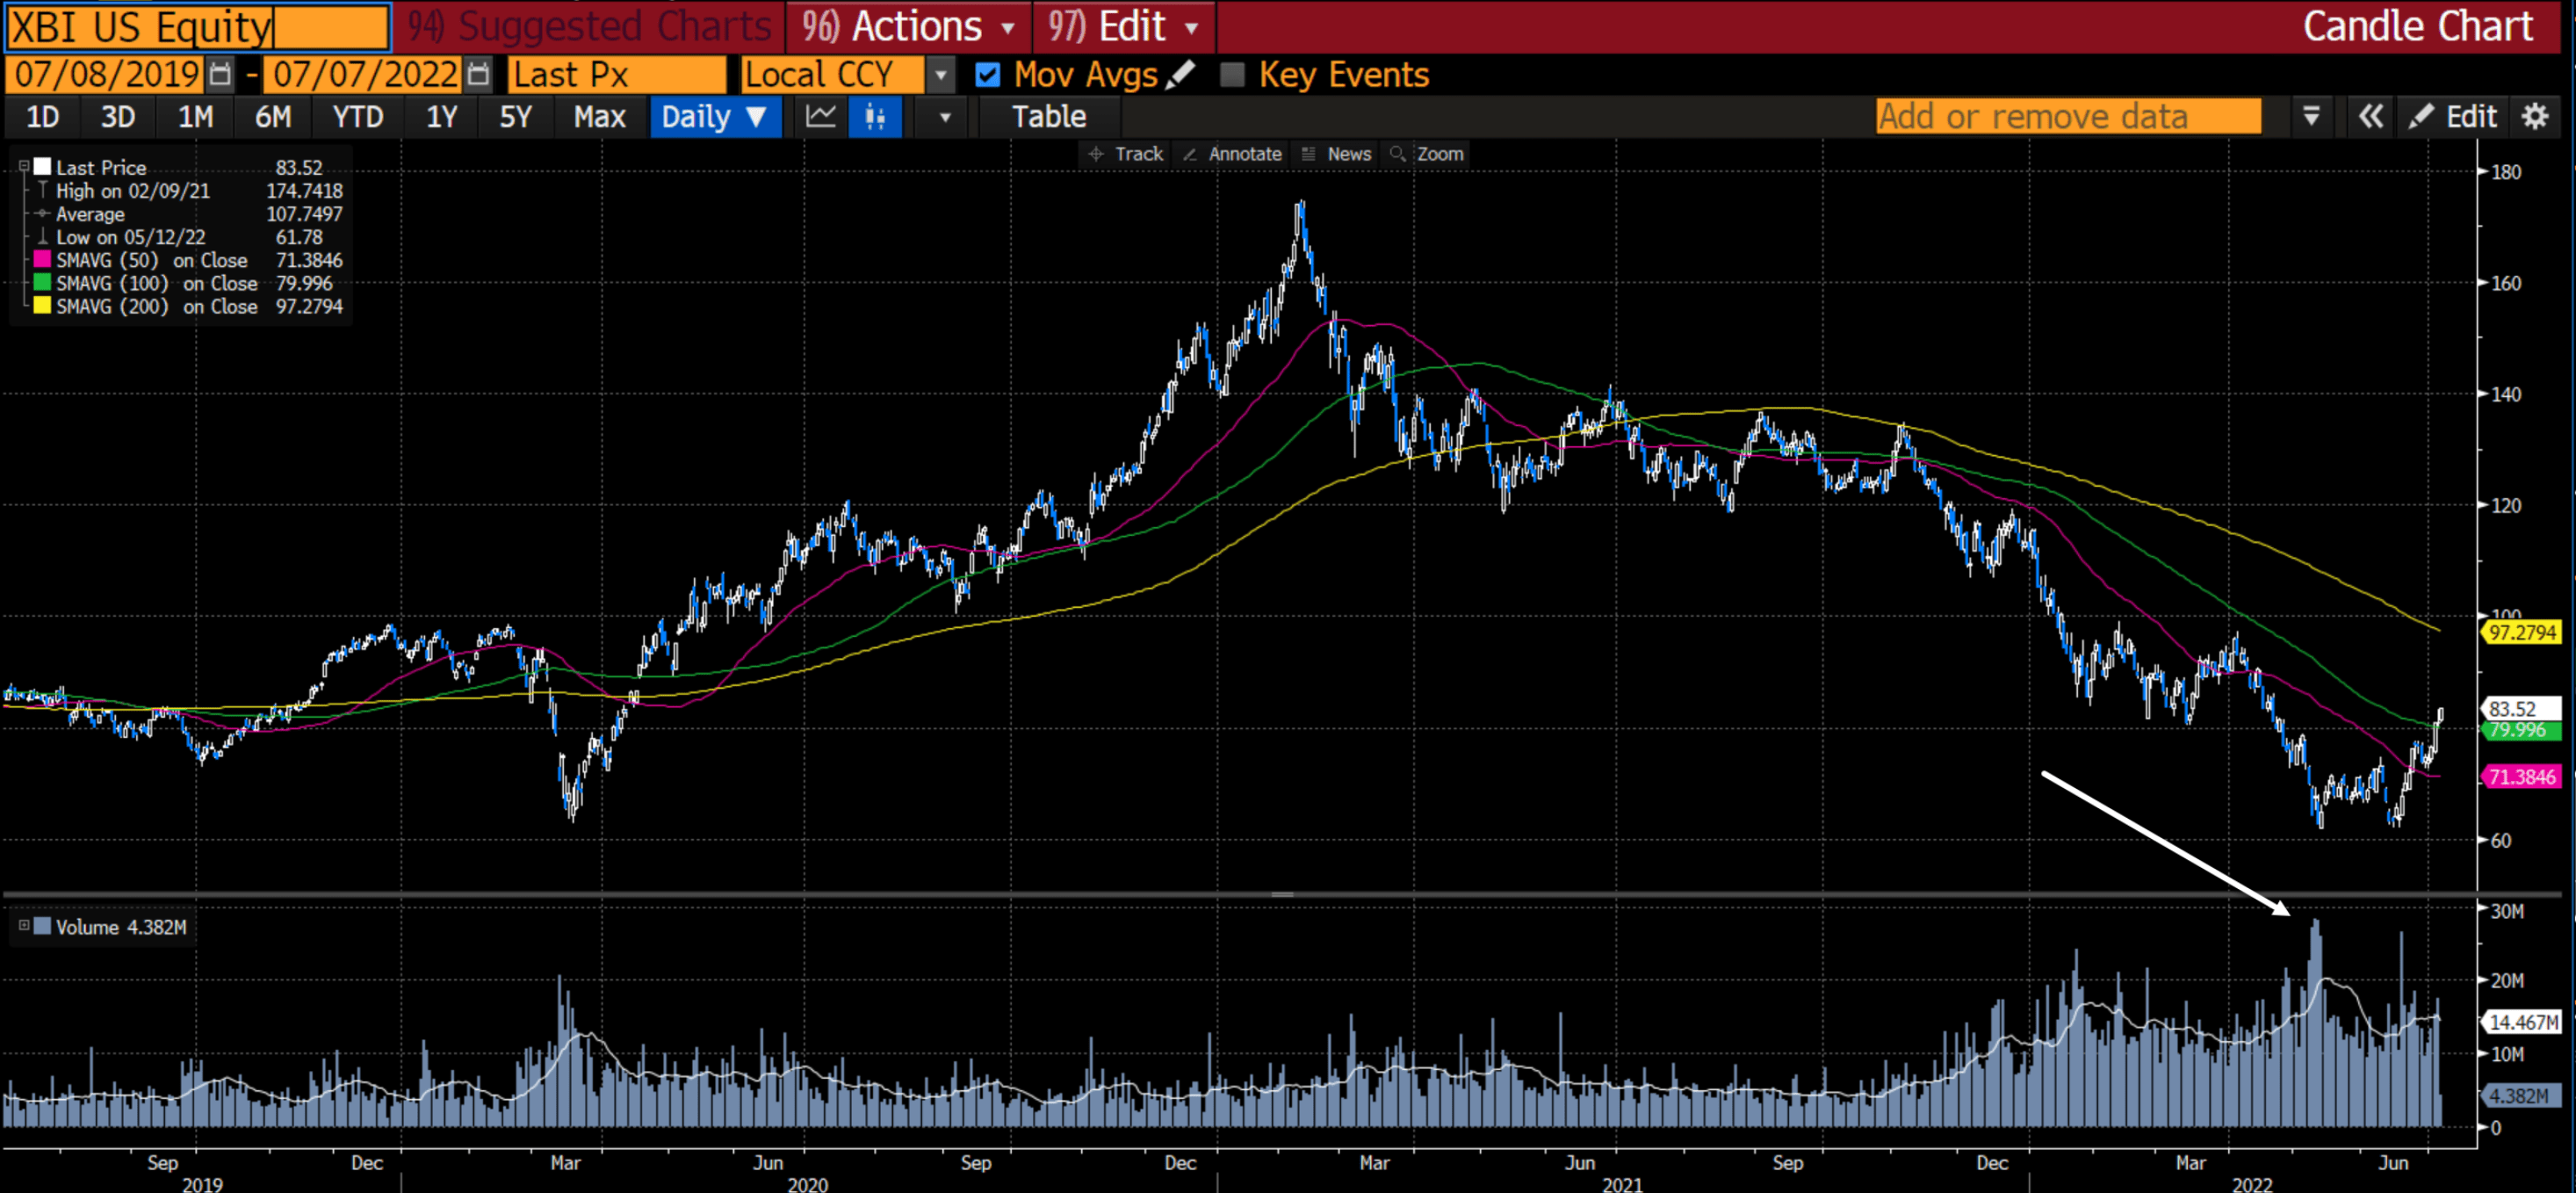
Remember, the markets (in my opinion) don’t always give us obvious signals and sometimes they are a bit more subtle. It could also be this time around that there are tradeable lows occurring at different times, different groups… I also find it interesting that China, Innovation, Biotech were one of the first areas to crack in ’21 and now appear to have “Capitulated.” Only time will tell if the bottom is in for these areas, but there are certainly levels to trade against.
For example, I like to keep things simple when we have a complicated situation as the current one at hand, and I like an easy level to trade against. One easy level in particular to trade against if it is overtaken is the 50d Moving Average on QQQ (purple line below). Note that also corresponds with a trendline break.
If the bottom is in, then I think waiting for price to retake the 50d MA as confirmation makes sense and then using that 50d Moving Average as a stop price for a trade.
QQQ chart (Bloomberg)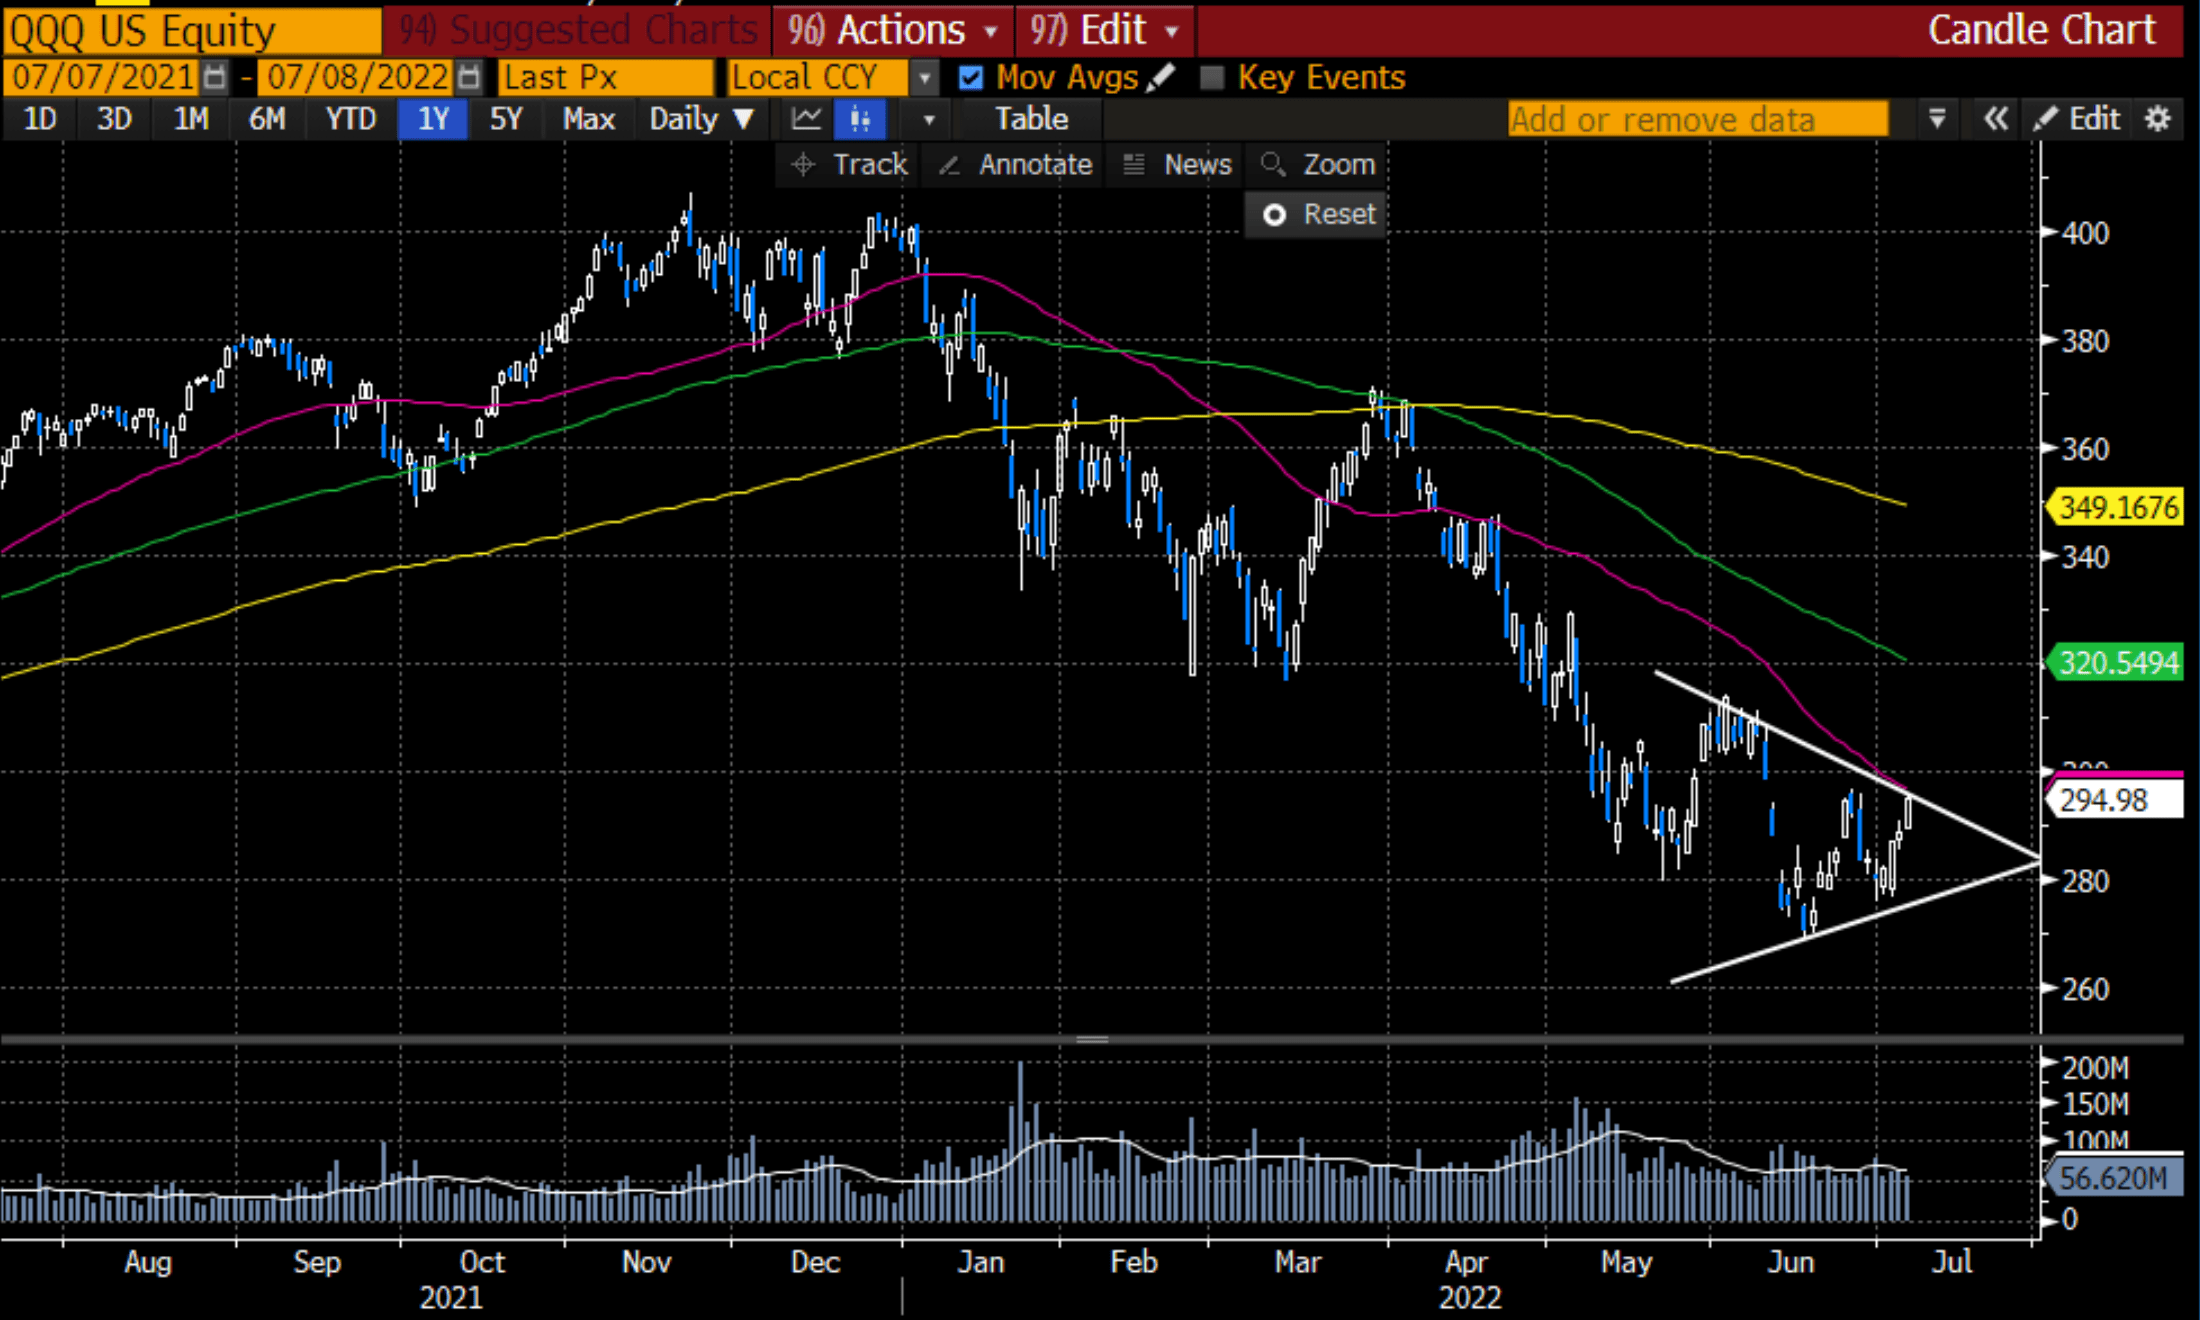
Be the first to comment