

ipopba/iStock via Getty Images
In 2018 Harte Hanks (NASDAQ:HHS) lost 24.6 M$ in terms of EBIT, equal to ~8.6% of revenue. In 2022, the numbers have almost reversed and the company reports a profit (TTM – Q3 results) of 14.9 M$ or 7.3% in margin terms.
In between, there was a long and difficult path of profound change and corporate restructuring. There have been many areas of intervention covered by the management and I want to mention the transition from property ownership to renting, the global reorganization of the plants with closures and transfers of activities, and an efficiency improvement in labor productivity with a consequent reduction in spending. There was also a drop in turnover that the company attributes to the closure of unprofitable contracts.
What I see today is a transformed company with solid economic and financial foundations and above all a streamlined and flexible operating organization capable of following market demands and being efficient in terms of costs. All this is confirmed by the good performance of the last Q3.
The company’s nature devoted to providing services to customers implies an important dose of risk linked to the possibility of losing contracts and therefore turnover and margin, but from the other point of view, we have a very attractive share price which can, in my opinion, amply compensate for these risks.
I think an investment in Harte Hanks today could yield good future income and my rate is Buy.
Company Overview
In 2023 Harte Hanks turns 100 and therefore we can say that it is a company with a long history behind it. We can identify it as an integrated services company and in its modern configuration, the business model is diversified into 3 macro areas which work side by side to provide an integrated services solution to different types of customers. Each business area is equally weighted in terms of turnover and can also exist independently.
In geographical terms, the company is present in various continents including America, Europe, and Asia.
The business model brings some structural advantages related to the fact of being able to diversify the business with multiple sources of income.
Harte Hanks Investor Presentation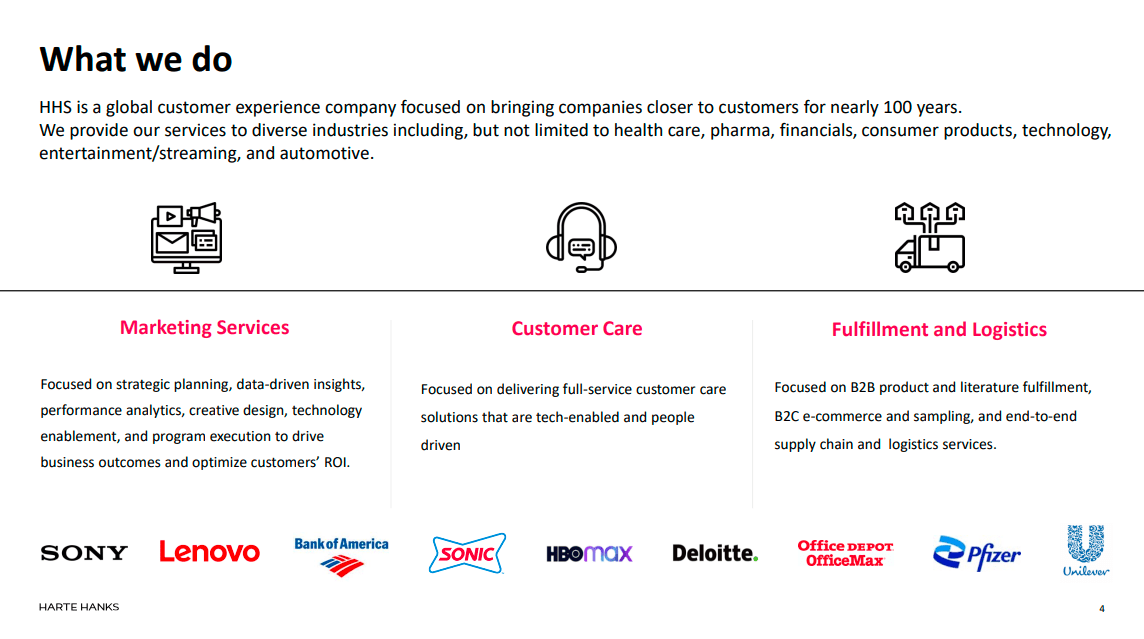
Financial and Highlights
Corporate Restructuring
Harte Hanks has been the subject of a major turnaround in the past 3 years. The main actions in terms of restructuring were: the closure of the Wilkes Barre (PA), Grand Prairie (TX), Shawnee (KS), and exited Jacksonville (FL) plants; shrinking Austin (TX) office by 50k square feet and closing an office in Manila. A new 400k square foot logistics facility was also opened in Kansas City (KS) and has become one of the company’s primary logistics hubs.
In addition to restructuring the logistics plants, some unprofitable contracts were cut (loss of bad revenue) and other cost-reduction activities were initiated (labor). It seems to date that the first phase of restructuring has been completed and that the management’s next actions can be directed toward an improvement in sales and margins.
Data Adjustment
Before analyzing the company’s profitability data, it is, in my opinion, necessary to make some corrections to the data, making them more characteristic and fitting with the HHS business. The company has a large portion of assets (plants, warehouses, and equipment) leased, and these operating expenses are not correctly accounted for in the capital employed by the company in each relevant year. Rents hide the use of an asset which, from an economic point of view, is as if it were owned and also contains a share of interest on the capital lent by the landlord.
Going into specifics, if HHS sustains rental costs of the premises equal to $5.86 million in 22, this means that:
– on the one hand, the capital employed by the company is much higher as the plants have a value that is not represented by the one-year rent. In other words, the capital employed is higher than that allocated in the balance sheet.
– on the other hand, the $5.86 million of rent contains a portion of interest on the loaned capital and which must be added to the EBIT (i.e. revenues before interest).
| 2018 | 2019 | 2020 | 2021 | TTM | |
| Revenue | 284.60 | 217.60 | 176.90 | 194.60 | 203.50 |
| EBIT | -24.60 | -15.50 | -4.80 | 12.60 | 14.90 |
| Capital employed (Total Asset-Current Liabilities) | 71.00 | 64.70 | 72.30 | 65.50 | 65.30 |
| Rental & lease | 9.65 | 9.25 | 8.65 | 7.75 | 5.86 |
| Capital leased (7xRental) | 67.52 | 64.76 | 60.52 | 54.22 | 41.00 |
| Lease-adj capital employed | 138.5 | 129.5 | 132.8 | 119.7 | 106.3 |
| Lease interest | 4.73 | 4.53 | 4.24 | 3.80 | 2.87 |
| Lease-adj EBIT (7x,7%) | -19.87 | -10.97 | -0.56 | 16.40 | 17.77 |
| Lease-adj EBIT Margin (7x,7%) | -7.0% | -5.0% | -0.3% | 8.4% | 8.7% |
| Lease-adj ROCE (7x,7%) | -14.3% | -8.5% | -0.4% | 13.7% | 16.7% |
The table shows the starting financial data (M$) from 2018 (balance sheet and profit and loss account) and the data recalculated through the adjustments. In particular, the leased capital was estimated with a multiplication factor of 7 concerning the annual rent. This is an estimate of the real value of the assets. The interest on the leased capital has also been estimated at 7% annual interest.
For example in 2021
Rental & Lease 8M$: Capital Leased = 7×7.75 = 54.22 M$
Lease-adjusted capital employed = 65.5 + 54.22 = 119.7 M$
Lease interest = 54.22×7%=3.8 M$
Lease-adjusted EBIT= 12.6 + 3.8 = 16.4 M$
Lease-adj EBIT Margin = 16.4/194.6=8.4%
Lease-adj ROCE =16.4/119.7 = 13.7%
Revenue and Profit
HHS Quarter + Author Graphics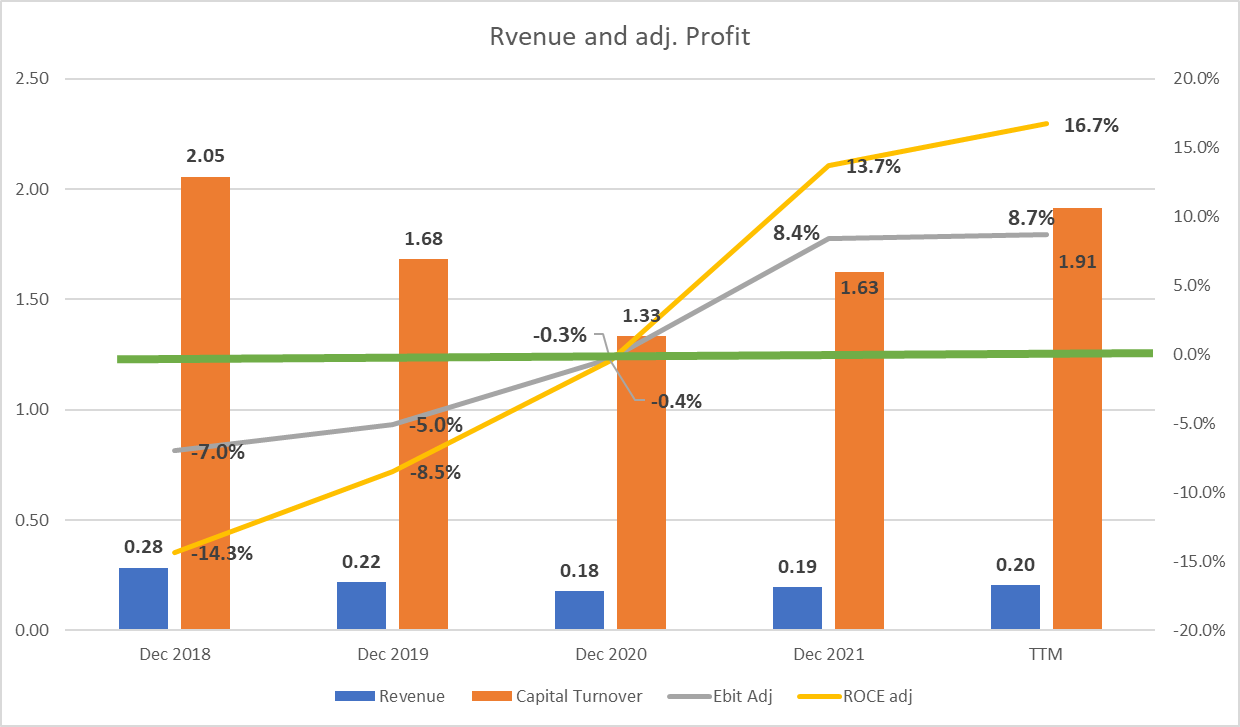
As we can see, the profitability trend is particularly positive, going from a negative figure in 2018 to a largely positive figure in 2022: +8.7% for EBIT and +16.7% for ROCE. The pivot year was 2020 (the green line is 0%) where we also record the lowest turnover and capital turnover data (1.33). 2020 also marks the turnaround in terms of turnover where in the last two years we have recorded a +11% growth.
In terms of Revenue, we can analyze the data divided by business area from the last Q3 Report:
| Business Area | YTD sept 2021 | YTD sept 2022 | delta |
| Marketing Services | 41,815 | 39,389 | -5.8% |
| Customer Care | 55,503 | 50,499 | -9.0% |
| Fulfillment and Logistics Services | 45,292 | 61,612 | 36.0% |
| Total | 142,610 | 151,500 | 6.2% |
The area that is improving significantly is that relating to the Logistics sector where the same company says in the last Earnings Call:
“Our Fulfillment and Logistics segment grew nearly 56% in the quarter, including a large wins in logistics, evaluated kitting and packaging project for a Fortune 50 retailer and increased programs from an existing pharmaceutical company.”
Logistics contracts usually have an average duration of 3-5 years and therefore this revenue figure is very likely to last also in the next quarters/years.
Other actions that the company is implementing concern the workforce as they say:
“During Q3, we added a salesperson in Marketing Services. And we are in the process of hiring a salesperson in Customer Care to expand our inbound and outbound call center opportunities.”
This could potentially improve the performance of the two sectors that are currently suffering the most.
In terms of Profitability, I underline 2 main expenses factors: labor and lease.
HHS Quarter + Author Graphics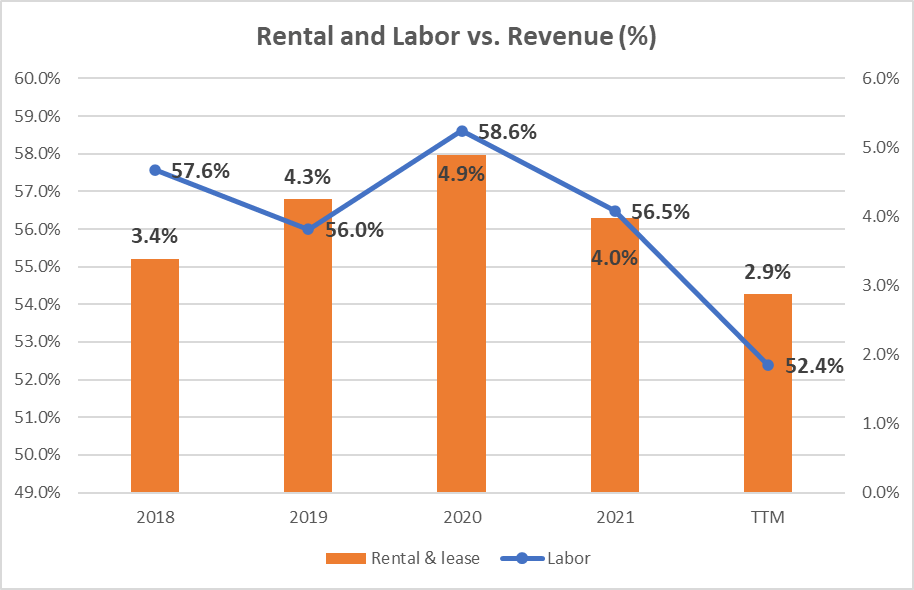
The graph above shows the trend of the two main cost factors (work and rent) concerning turnover. As we can see, the company has managed to significantly reduce the level of these expenses, going from 57.6% in 2018 to 52.4% in terms of labor costs. This made it possible to improve the gross margin by almost 5 percentage points!
Also renting expenses went from 3.4% (2018) to 2.9% (TTM). A small parenthesis deserves the cost of renting the plants: the absolute value of rents has almost halved from $10M in 2018 to $5.86M in 2022. This significant reduction has allowed for a great increase in capital turnover which, especially in 2022, has also increased ROCE. These latest data further underline the positive change that has taken place in the company and the consequent improvement in performance parameters, especially in terms of capital utilization.
Another example of an improvement in the use of capital employed is also underlined by them from another point of view:
“At the end of the second quarter, we reached an agreement to repurchase all preferred shares held by Wipro. The repurchase of the preferred shares will eliminate the dilutive impact to common shareholders and give us greater flexibility with our capital structure going forward”
Valuation
Relative Valuation
Seeking Alpha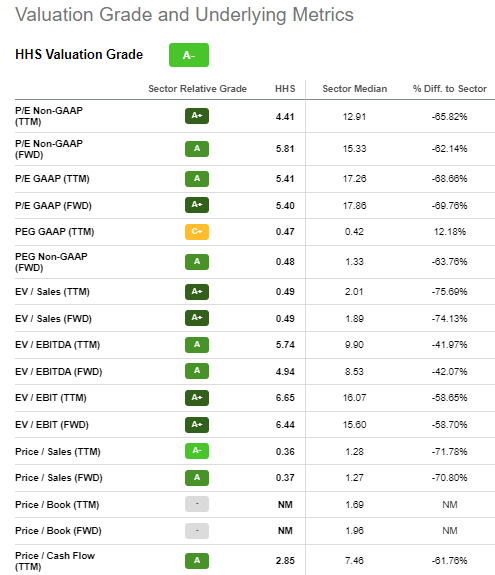
The figure represents the company valuation in terms of the main price/profitability parameters in comparison with the sector average.
Using TTM Non-GAAP parameters we can note how the price seems cheap with a P/E of 4.41 compared with 12.91 (sector median) and also EV/Sales of 0.49 compared with 2.01 (sector median) or P/Sales of 0.36 vs. 1.28.
From a relative point of view, we can affirm that Harte Hanks represents one of the best investment solutions in the company sector.
Quantitative Valuation
To define a maximum buying price, I use a simple formula based on CCF/Share and interest rate.
The formula is:
Maximum buying price = Cash profit per Share/interest rate – 20% (safety discount)
If TTM Cash Profit per share= $2.86
Interest Rate=inflation Rate = 7.75%
Maximum price before Safety discount = 2.86/7.75%= $36.9
The maximum price at 20% discount = $30.7
Under the Quantitative analysis, it seems that the actual price of $10.5 is cheap.
Peer Comparison
Since the main sector of HHS is logistics, I decided to compare the company with some logistics players of similar size:
- Covenant Logistics Group, Inc. (CVLG)
- Universal Logistics Holdings, Inc. (ULH)
- P.A.M. Transportation Services, Inc. (PTSI)
- Daseke, Inc. (DSKE)
Seeking Alpha Seeking Alpha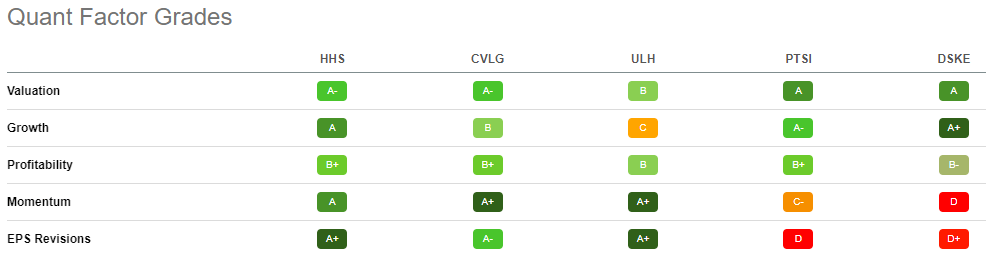
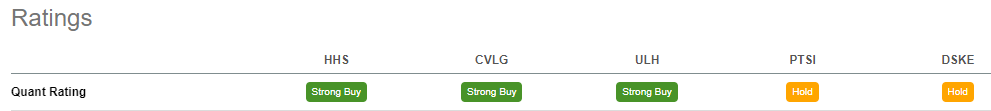
Excluding P.A.M. Transportation Services and Daseke they have a Quant Rating of Hold, lower than the others’ Strong Buy, using the Quant Factor Grades in terms of Valuation and Profitability we can see HHS is equal to CVLG and better than ULH. HHS is the best in class in terms of growth and EPS Revision: the company is coming out of a turnaround period and has significant growth in terms of sales and profitability. Momentum is not for HHS and it could represent, on the other side, a trading opportunity in the long term.
Back to the main profitability factors:
|
HHS |
CVLG |
ULH |
PTSI |
DSKE |
Peer Median |
HHS vs. Peer Median |
|
|
P/E Non-GAAP (TTM) |
4.41 |
6.89 |
7.04 |
5.73 |
4.81 |
6.1 |
-28% |
|
Price/Sales (TTM) |
0.36 |
0.5 |
0.48 |
0.7 |
0.2 |
0.5 |
-23% |
|
Price/Cash Flow (TTM) |
2.85 |
4.11 |
5.54 |
4.37 |
1.88 |
4.0 |
-28% |
we can see how HHS when compared with the peer median, is cheaper in terms of price related to Earnings/Sales/Cash Flow.
Risks
One of the typical risks of service companies is linked to the long-term turnover of existing customers. In fact, some service contracts (such as those managed by Harte Hanks) have a very short duration (even less than a year) and can also be terminated on short notice. The company, therefore, needs to develop a high-quality service level and high customer loyalty. If we look at the last Q3 turnover data, we can see how two businesses (Marketing and Customer Service) recorded a decline (respectively – 5.8% and – 9%). Indeed, the company was immediately committed to hiring new sales figures working in these sectors but in any case, these data could represent a warning and consequently a possible risk in terms of future profitability.
The pension fund, in terms of existing long debt, can represent another area of risk when compared to the possible variability of turnover. The data indicates a total pension liability of $50.7 million divided equally between non-qualified and qualified funds. If we compare the current company margins and turnover, we can identify this as a possible risk in the event of a revenue business decline.
Harte Hanks Investor Presentation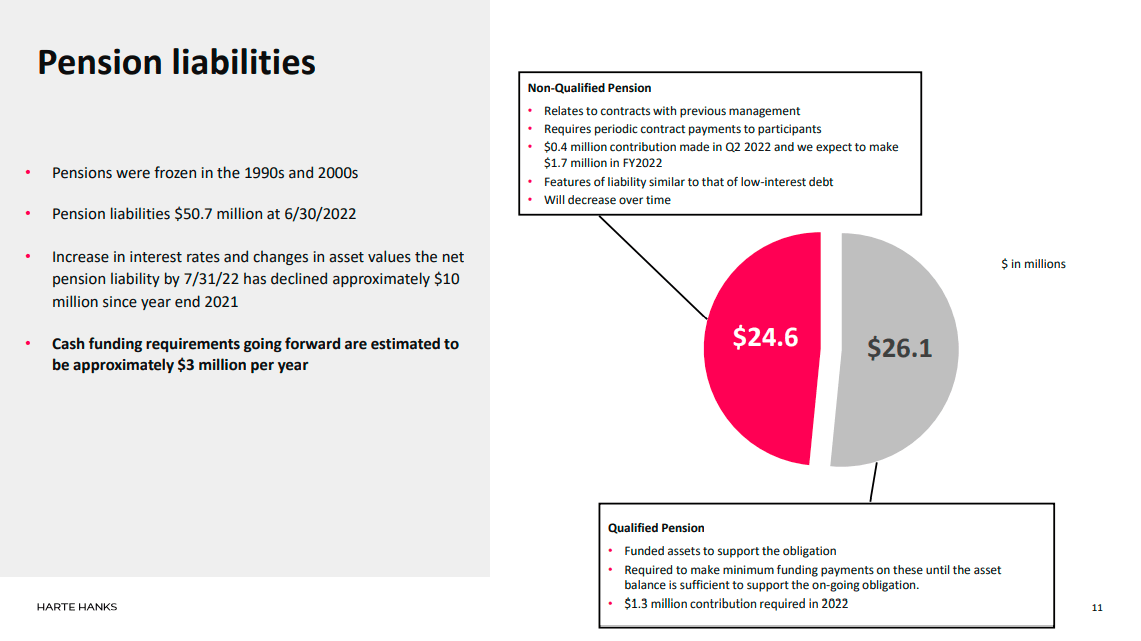
Bottom Line
Harte Hanks went through a difficult period with a major corporate restructuring. The new management was able to reduce the expenses related to labor and above all to reorganize the logistics plants proposing a new lean and flexible imprint as well as being able to follow possible future growth. The economic data have amply rewarded the efforts made and, to date, we can assert that the company has achieved financial and economic stability. The company seems also undervalued and therefore at this moment represents, in my opinion, an excellent earning opportunity. My rating is Buy.
Be the first to comment