

Minakryn Ruslan
Introduction
Harmony Gold Mining (NYSE:HMY) is one of the South African gold miners I regularly cover on Seeking Alpha. The 6-month interim results for H1 2022 were released on August 30, 2022.
Note: As always, for gold mining companies based in South Africa, analyzing the balance sheet is an arduous task because of the complexity of the reports from a quarter, nine-month, one year, and six-month, considered the most critical report. Furthermore, the results are mainly in Rand and have to be converted into US$ (I used a 15.21 ratio indicated by the company).
This article is an update of my preceding article, published on March 21, 2022. I have followed Harmony Gold regularly on Seeking Alpha since September 2019.
H1 2022 snapshot
On August 30, 2022, the company released its six-month period ending June 30, 2022 (H1 2022 or fiscal FY22).
The company operates nine underground mining operations, one open-pit mine, and four South Africa surface operations. Furthermore, Harmony Gold is active in Papua New Guinea, where it owns the Hidden Valley mine, an open-pit gold and silver mine.
HMY FY22 Snapshot (HMY Presentation )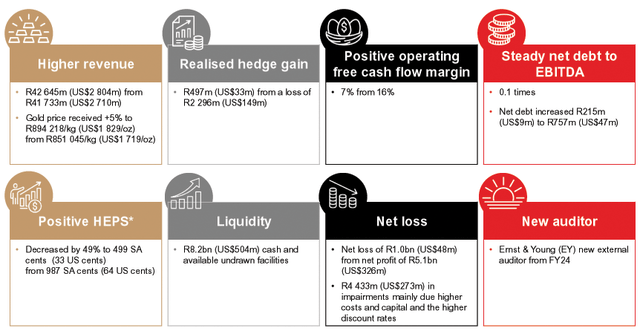
As we can see later, production for H1 2022 was 707,638 Au Oz, down 6.5% from H1 2021.
Note: Total production comprises the underground and surface output for South Africa and production in Hidden Valley in PNG.
Revenues were $1,373 million in H1 2022 compared to $1,448 million in H1 2021. Operating free cash flow went down to $205 million this semester, down from $240 million in H1 2021.
The company indicated a decrease in underground recovered grade from 5.37 g/t in H1 2022 to 5.51 g/t in H1 2021.
On October 6, 2022, Harmony Gold announced the acquisition of a near-term Australian Copper Eva Project from Copper Mountain Mining Corp. for up to $230 million. The Eva Project is located in Queensland, Australia, a Tier-1 jurisdiction. The Transaction is expected to close in the first quarter of 2023.
HMY indicated in the recent presentation that it has sufficient headroom to pay for the Transaction in Cash.
HMY The Eva Project (HMY Presentation)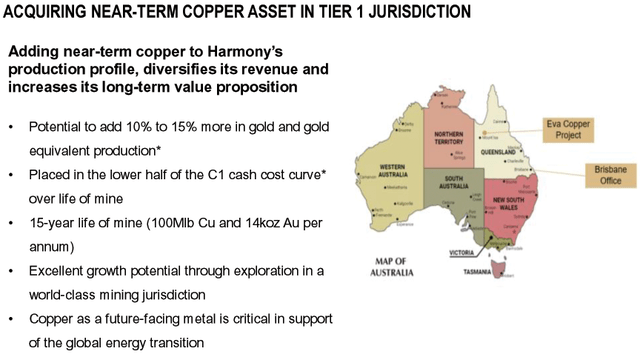
This project will add 100 Mlb Cu and 14K Oz per year with a LOM of 15 years. I believe it is a good transaction at the right time. Copper is now a bit depressed, but it is only temporary.
Investment Thesis
The investment thesis remains unchanged. The company is a good candidate for long-term investors who are not frightened to get involved in the South African gold industry, which could sometimes be concerning. As we can see later, the company has a solid balance sheet and pays a small dividend.
However, the gold sector is highly inconsistent and prone to high volatility. The Russian invasion of Ukraine and a frightening multi-year high inflation have created a challenging environment for gold, which has dropped significantly since the FED turned hawkish, hiked the interest rate by two successive 75-point and is about to hike again in November. Inflationary pressures have been a drag on the industry as well.
Thus, one great strategy I often recommend in this sector, especially for HMY, is trading LIFO about 50%-60% of your total position and keeping a core long-term position for a much higher payday down the road. Doing so allows you to take advantage of the short-term volatility while positioning for a possible future uptrend.
Stock performance
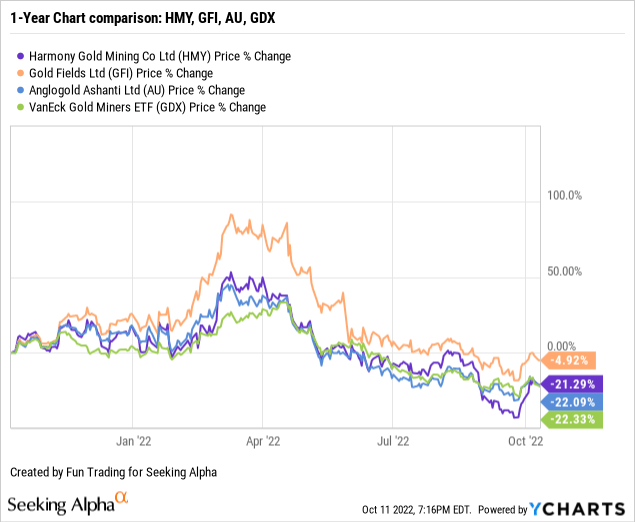
HMY is down 21% on a one-year basis. The stock performance has been disappointing and lags Gold Fields (GFI) while following AngloGold Ashanti (AU).
Harmony Gold Mining – Balance sheet ending June 2022 and Production data – The Raw Numbers
Note: The numbers indicated are in US$ with a ratio of 15.21x (Rand/US$) for H1 2022. The ADR ratio is 1:1.
| Harmony Gold Mining | 12/20/20 | 6/2021 | 12/2021 | 6/2022 |
| Total Revenues in $ Million | 1,451 | 1,448 | 1,431 | 1,373* |
| Net Income in $ Million | 307.3 | 36.9 | 90.5 | -154.2 |
| EBITDA $ Million | 402.6 | 75.54 | 128.4 | -146.0 |
| EPS diluted in $/share | 0.50 | 0.06 | 0.14 | -0.25 |
| Operating Cash flow in $ Million | 388 | 244 | 240 | 205 |
| Capital Expenditure in $ Million | 159 | 200 | 207 | 192 |
| Free Cash Flow in $ Million | 229 | 45 | 33 | 13 |
| Total Cash $ Million | 283 | 203 | 192 | 155 |
| Total Long-term Debt (incl. current) In $ Million | 322 | 214 | 206 | 201 |
| Shares outstanding (diluted) in Million | 616 | 616 | 617 | 614 |
| Production Au Oz | 12/2020 | 6/2021 | 12/2021 | 6/2022 |
| Total Production Gold | 745,347 | 756,473 | 778,879 | 707,638 |
| Underground SA | 556,011 | 547,505 | 577,457 | 526,148 |
| Surface SA | 120,276 | 118,765 | 141,269 | 122,461 |
| PGN | 69,060 | 90,602 | 60,153 | 59,029 |
Data Source: Company document
* Estimated by Fun Trading
Balance Sheet Analysis
1 – Revenue for H1 2022 (ending June 30, 2022) and other financial indicators
HMY Semester Revenues history (Fun Trading)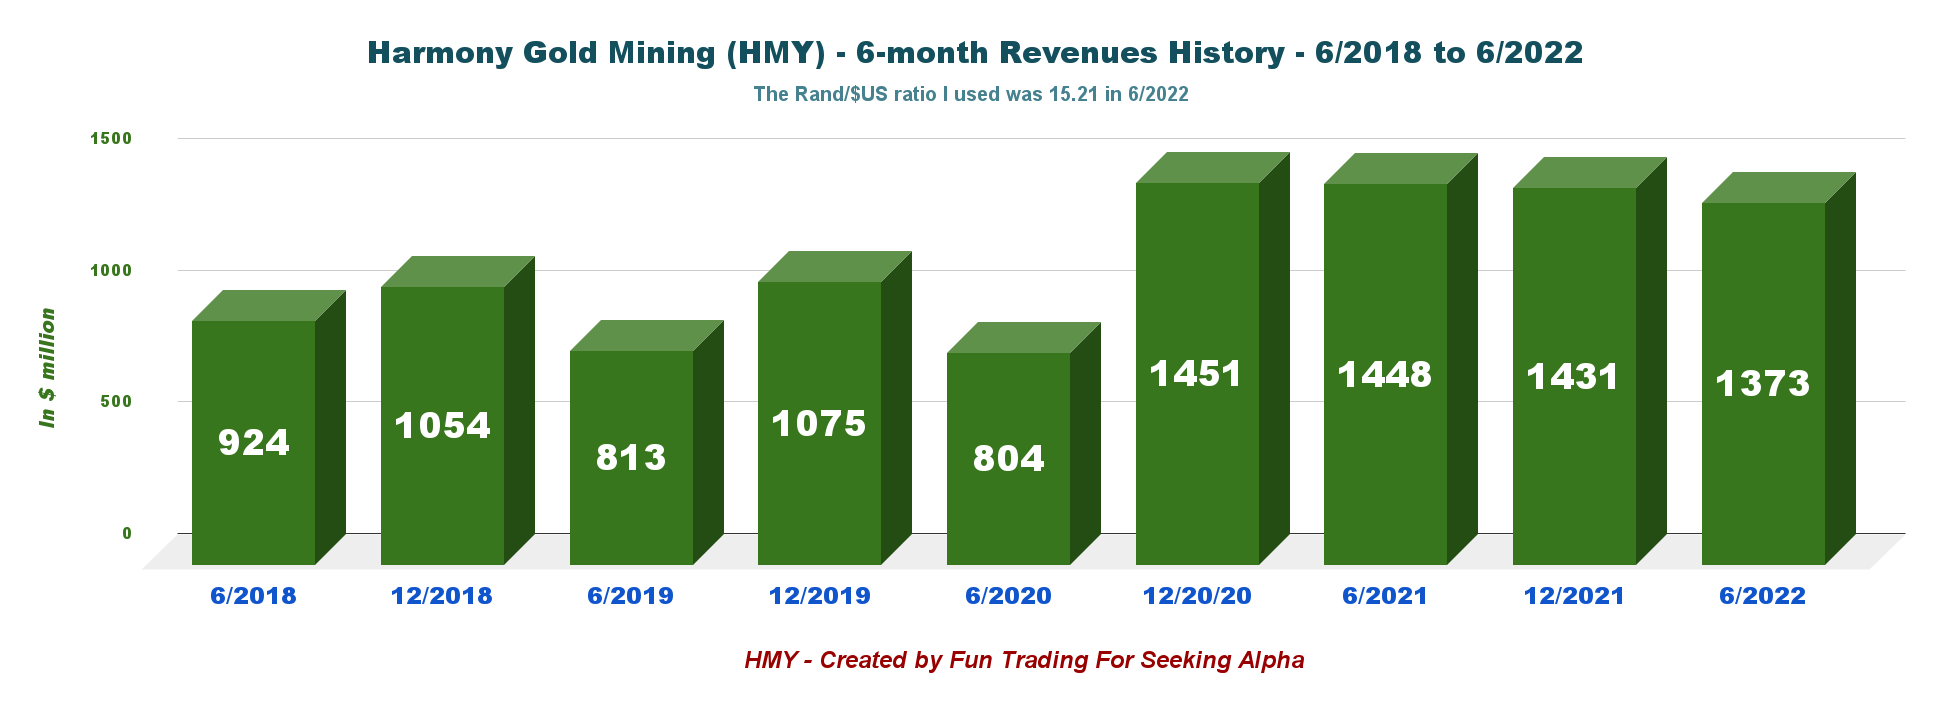
Harmony Gold posted revenue of $1,373 million in H1 2022 (fiscal H2 2022) compared to $1,448 million in H1 2021.
Production guidance for FY23 is estimated to be between 1.4 Moz and 1.5 Moz at an all-in-sustaining costs or AISC of below R900 000/kg. The underground recovered grade is planned to be between 5.45g/t to 5.60g/t.
Note: Bambanani mine is expected to be closed in FY23.
HMY Production Guidance FY23 (HMY Presentation)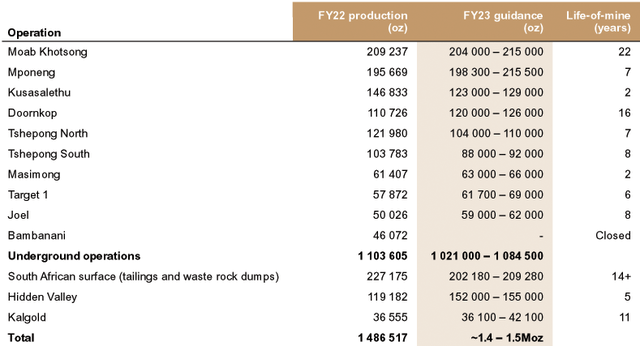
Hidden Valley’s FY23 production guidance ranges from 152K to 155K oz, much higher than FY22, which experienced conveyor belt damage on January 26, 2022, and lower planned production.
Gold and silver production were negatively impacted by the overland conveyor belt failure in January 2022. The overland conveyor belt has since been repaired and we have implemented additional controls to reduce the risk of this happening again.
2 – 6-month production analysis – historical data
Total gold production for H1 2022 was 707,638 Au Oz compared to 756,473 Au Oz in H1 2021. The total gold production for 2022 was 1,486,517 Au oz (see second chart below).
HMY Gold production history (Fun Trading)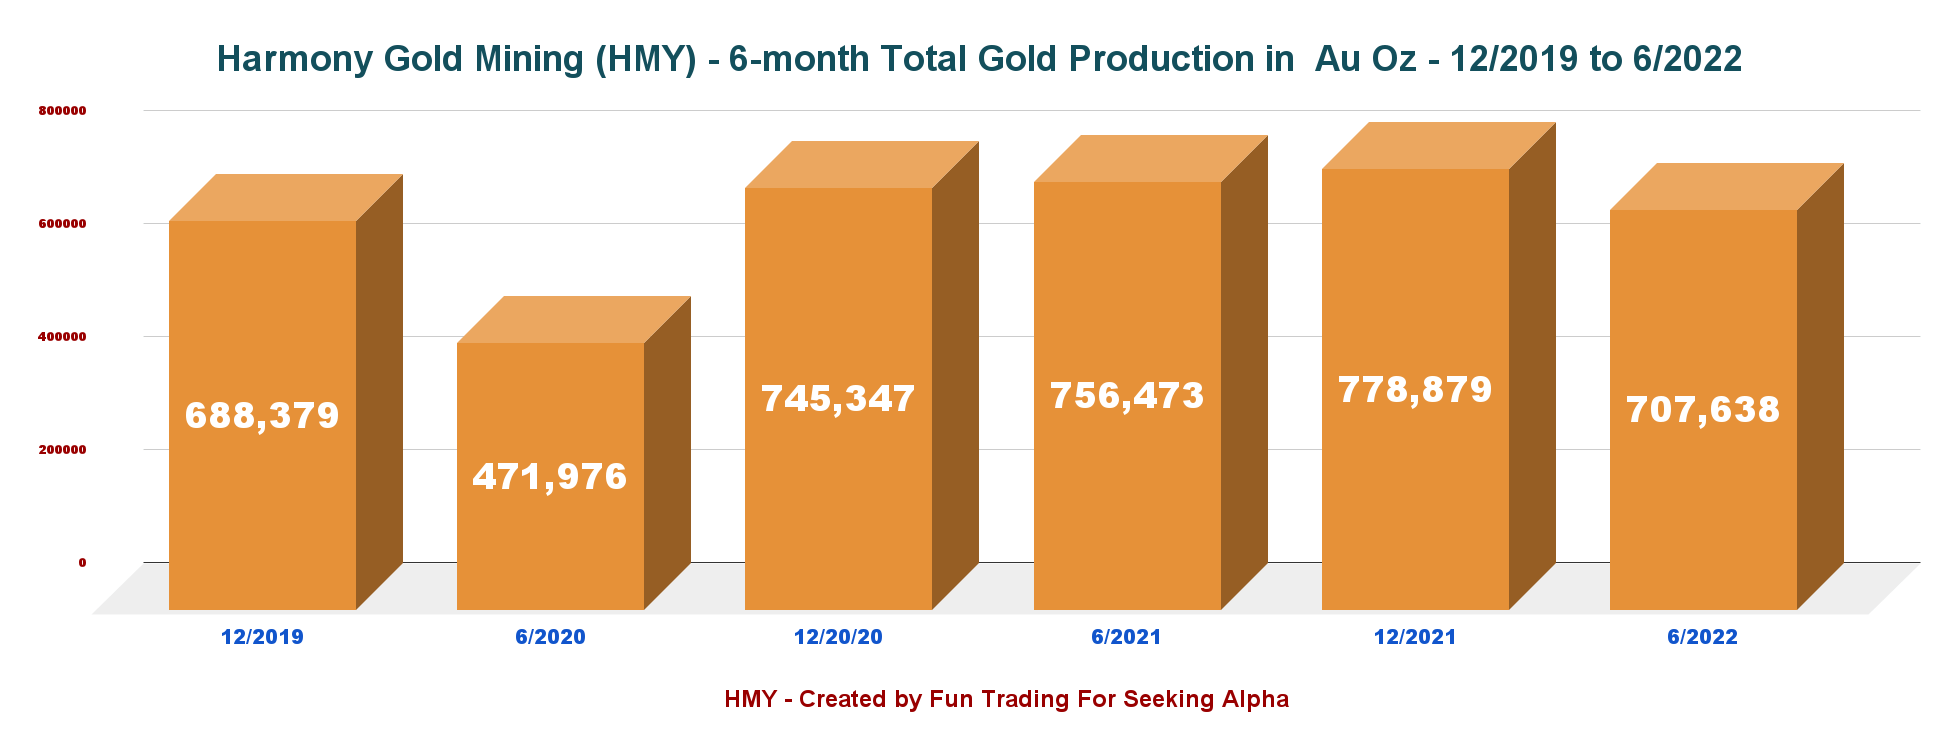
Note: HMY produces gold from three segments: Surface and underground in South Africa and Hidden Valley in PNG. The Underground production in South Africa is the most prolific.
HMY Production comparison per mine H1 2021 versus H1 2022 (Fun Trading) The average gold price received during H1 2022 was $1,829 versus $1,719 in H1 2021.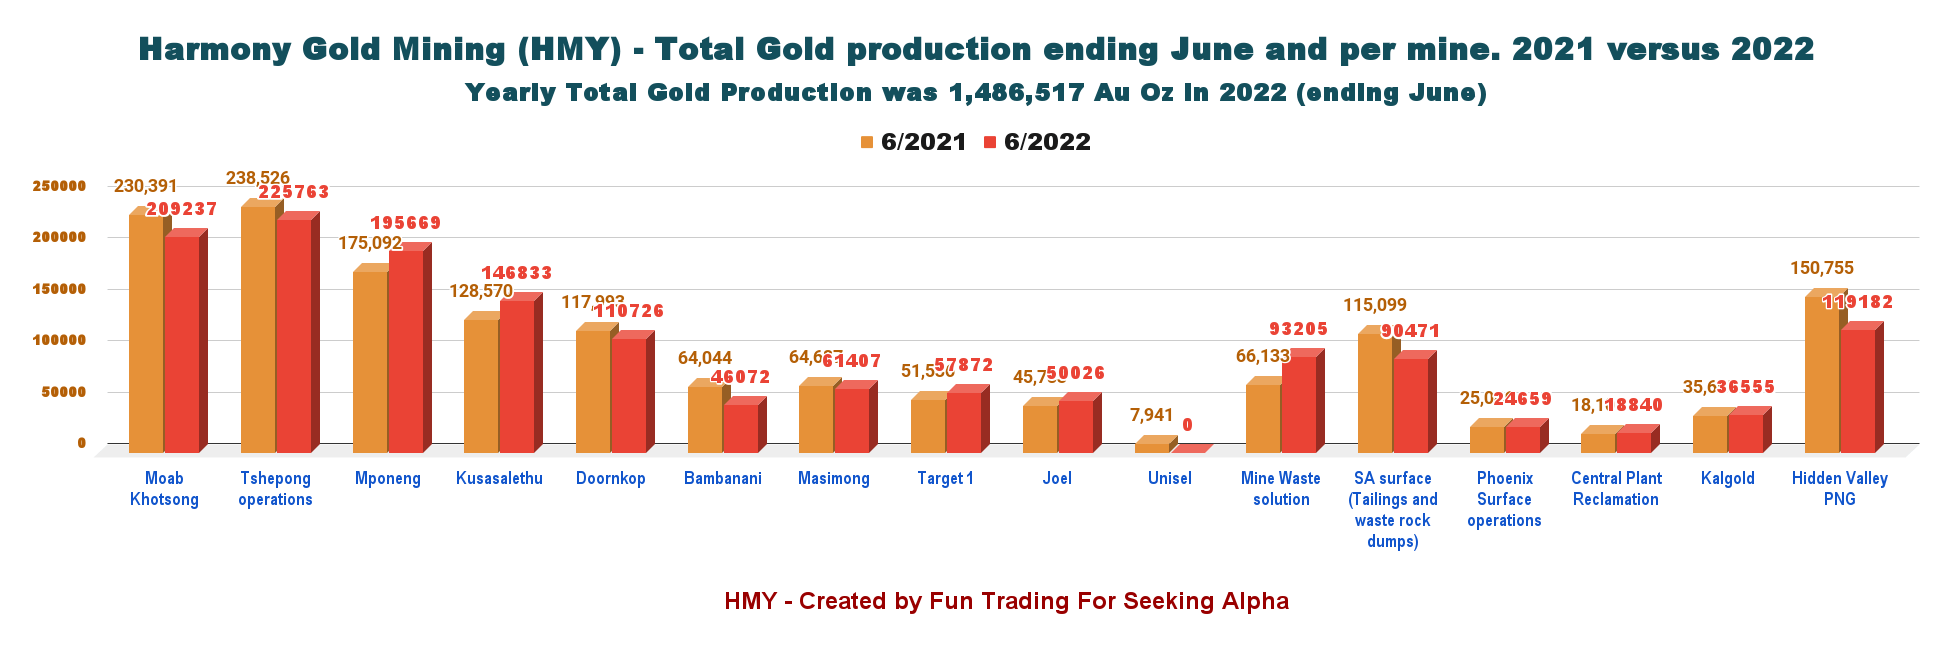
AISC for H1 2022 was $1,709 per ounce vs. $1,460 per ounce in H1 2021. AISC is exceptionally high and has even worsened in the past six months.
The AISC increased by 17.1% due to inflationary pressures.
HMY Gold price and AISC (Fun Trading)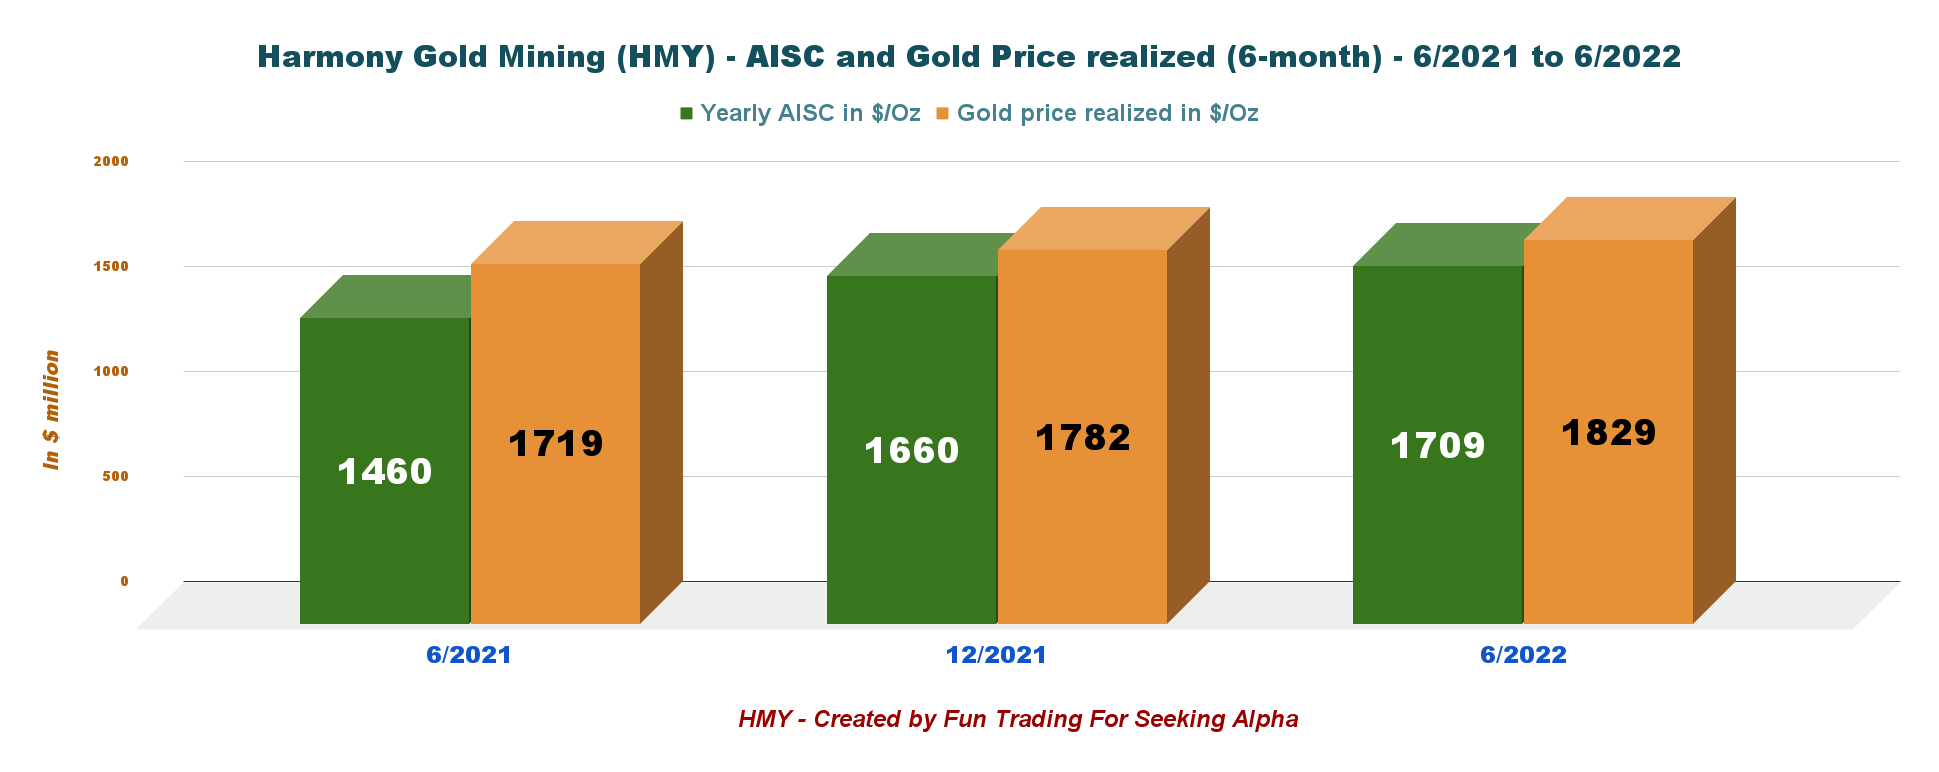
3 – Operating Free cash flow is $13 million in H1 2022
HMY Free cash flow history (Fun Trading)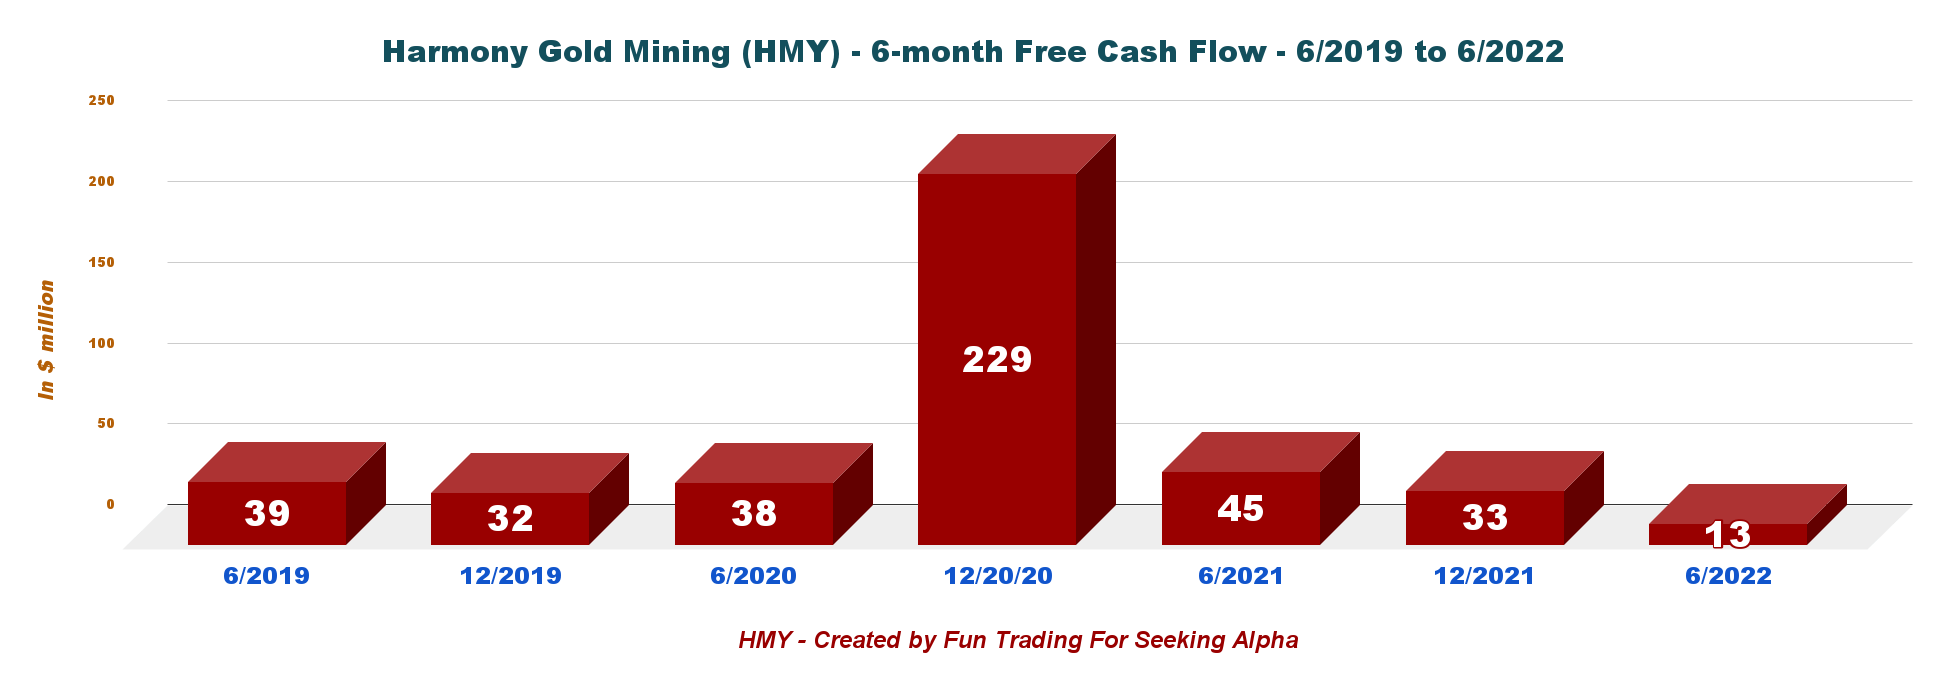
Note: Free cash flow is the Cash from operating activities minus CapEx.
Trailing 12-month free cash flow is $46 million, with a free cash flow of $13 million in H1 2022.
The company is paying a yearly dividend of about $0.04 per ADR or 1.45%, according to Finviz. Caveat emptor: The withholding tax for South Africa is 20%.
In line with our existing dividend policy, and following on the payment of an interim dividend in April 2022, we are pleased to announce that Harmony has declared a final dividend of 22 SA cents (1.3 US cents) per share on the back of the operating free cash generated throughout the financial year. The board has taken a decision to declare a dividend on the basis of consistency and adjusting for major capital and once-off items
4 – The company’s debt situation is excellent
HMY Debt history (Fun Trading)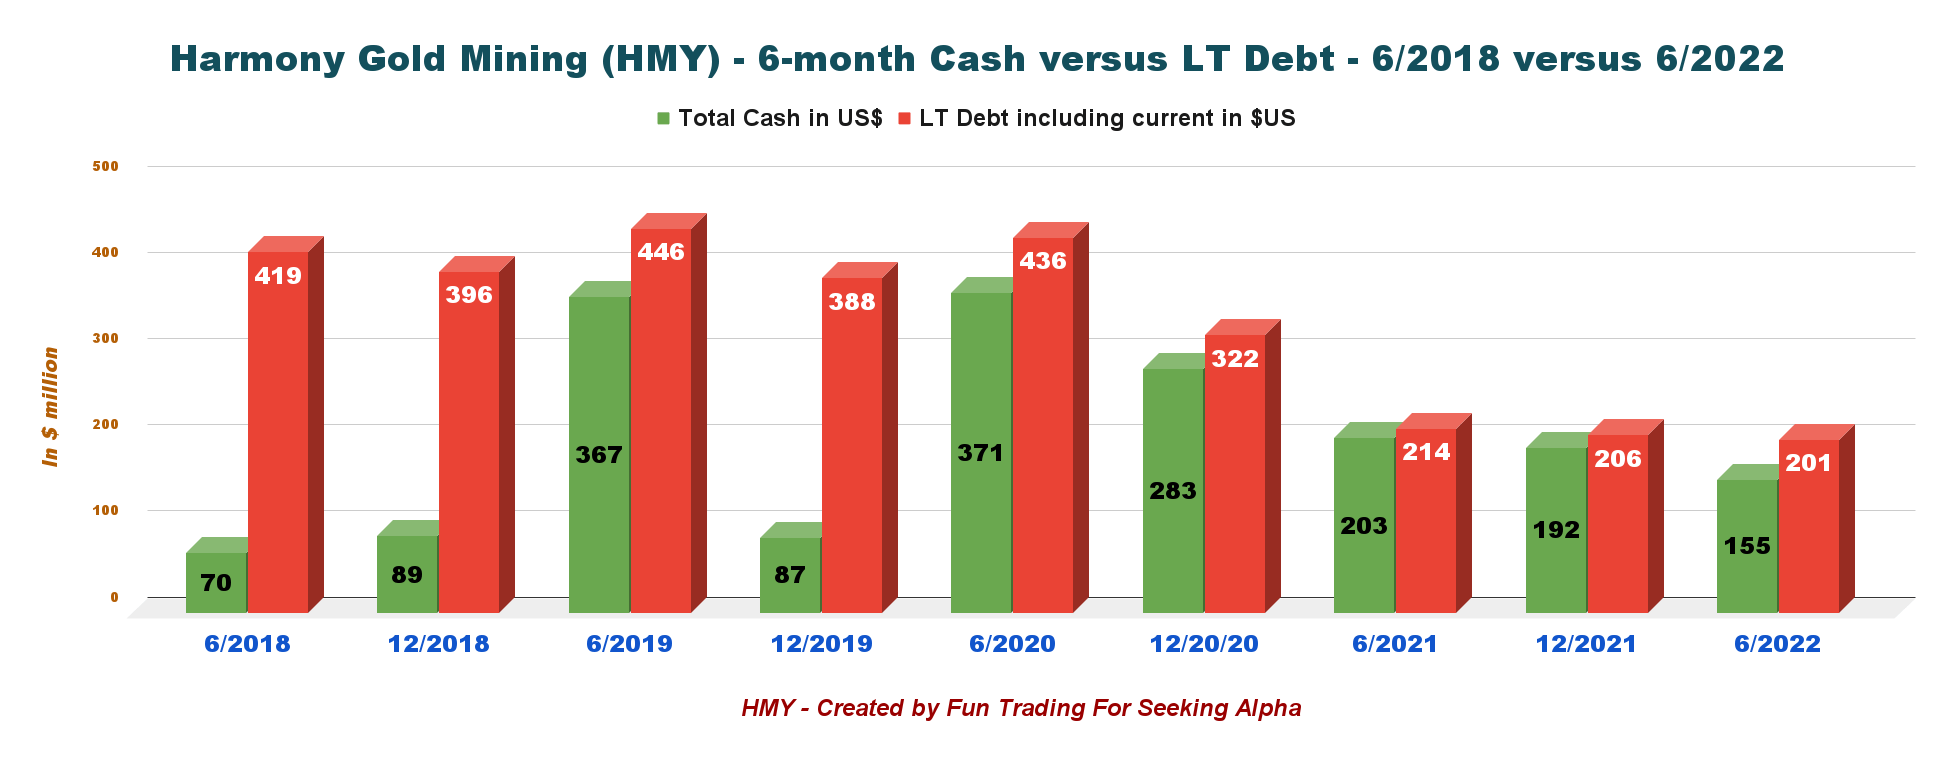
As of June 30, 2022, cash and cash equivalents declined yearly to $155 million. The debt was $201 million.
As at 30 June 2022, net debt increased by R215 million (US$9 million) to R757 million (US$47 million). This was mainly attributable to a lower cash position due to the increased capital expenditure and lower production. (Press release)
The company indicated liquidity of $504 million available through cash and available facilities and will be used to help Harmony achieve its strategic and growth objectives.
Technical analysis and commentary
HMY TA Chart short-term (Fun Trading StockCharts)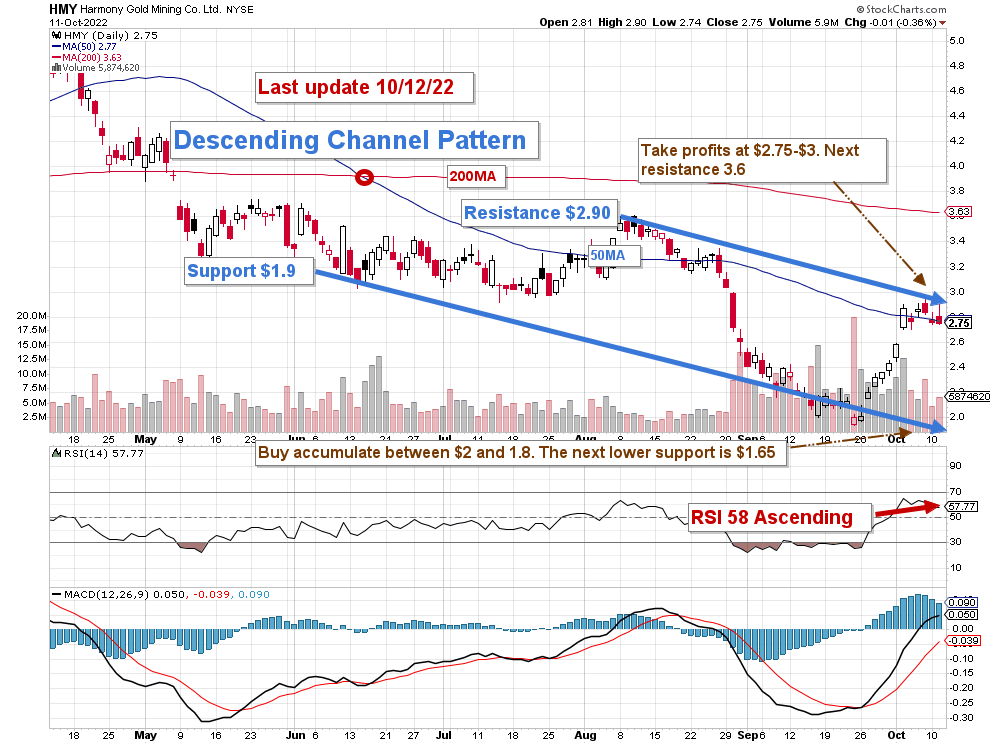
Note: The chart is adjusted for the dividend.
HMY forms a descending channel pattern with resistance at $2.90 and support at $1.90. However, I see intermediate support at $2.75 (50MA).
The short-term trading strategy is to take profits between $2.75 and $3 and accumulate at or below $2 if the intermediate support at $2.75 is not holding. Possible lower support is $1.65 if gold continues to drop below $1,625 per ounce. Conversely, if the Fed turns more dovish to spare the global economy from a recession which is unlikely, HMY may jump to $3.60 or even above $5.
Thus, I recommend short-term trading LIFO for about 65% of your total position and keeping a core long-term holding for a much higher target.
Warning: The TA chart must be updated frequently to be relevant. It is what I am doing in my stock tracker. The chart above has a possible validity of about a week. Remember, the TA chart is a tool only to help you adopt the right strategy. It is not a way to foresee the future. No one and nothing can.
Author’s note: If you find value in this article and would like to encourage such continued efforts, please click the “Like” button below to vote of support. Thanks!
Be the first to comment