

urzine
Investment Summary
We reiterate the buy thesis on Haemonetics Corporation (NYSE:HAE) following second quarter earnings and an extended outlook for plasma collections in FY23. We advocated the investment debate hinges on this point for HAE in previous analysis here, noting this idiosyncratic risk factor has potential to drive uncorrelated equity returns. HAE has since delivered, and probable outcomes for the stock are compelling. Rate buy $98 valuation in line with previous analysis.
Exhibit 1. HAE 1-year price action, with net volume and money flow
Data: Refinitiv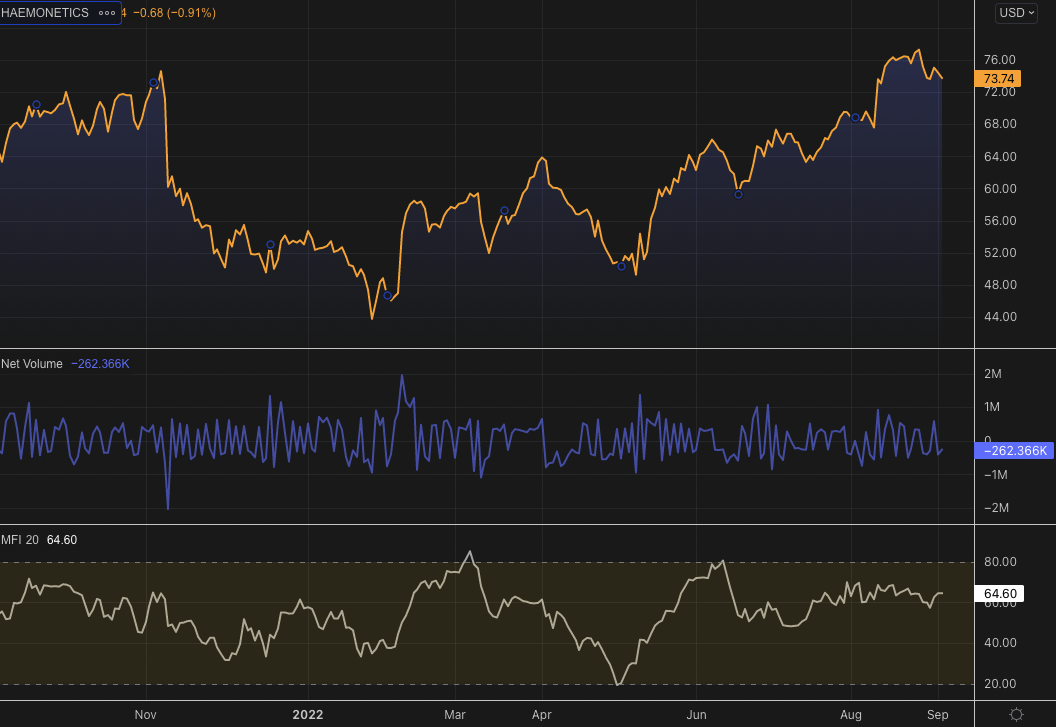
Q1 FY23 earnings exhibit strengths to plasma
In our last analysis we made the supposition that “HAE is set for a period of accelerated earnings growth into the coming years by our estimation.” This was carried through in Q1 FY23 and were exemplary of the recovery in plasma volumes our investment thesis hinges on. As seen in Exhibit 2, plasma revenues of $103 million (“mm”) were up 44% YoY, with the bolus of turnover still derived from North America. This was backed by a 15% YoY gain to Hospital revenues and an over 17% gain for the both on aggregate terms.
Exhibit 2. Growth in turnover heavily skewed towards plasma with above-consensus results at the top and bottom line from the segment
We called for this kind of growth in plasma collections earlier in the year and this demonstrates the normalization of the market to reflect more recognizable growth trends looking ahead.
Data: HB Insights, HAE 10-Q Q1 FY23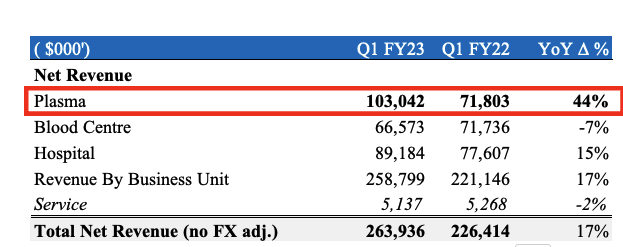
As seen in Exhibit 3, quarterly turnover from plasma has made a sequential recovery after showing signs of imminent collapse in late FY21. These are still well behind FY19 levels but growth trends indicate that volumes have normalized somewhat. We need volumes to tick higher in order to driver additional uncorrelated earnings to the rest of the equity risk budget to med-tech across our portfolios.
Exhibit 3. Growth trends in plasma collections normalizing to the upside however still have a while to reach FY19 range
This is incredibly important to see with contracted revenues [from the CSL contract] diminishing, plasma sales are still expanding organically as well
Data: HB Insights, HAE 10-Q: Q1 FY23
Touching on the CSL agreement – recall, it also allows CSL to use its PSC2 device and continue purchasing disposables until expiry. Management forecasted a $88mm [~$1.70/share] accretion to the top-line in FY23 revenues. Management reaffirmed this on the Q1 earnings call – per CEO Chis Simon, in response to analyst questioning:
“In our revenue guidance for the year, we’ve made no change to the previously communicated $88 million in revenue. That’s the minimum commitment from CSL. So that’s where we stand as of now.”
Ex-CSL collection volumes were also up 40% YoY and 12% QoQ, ahead of seasonal trends. This is the 3rd quarter of sequential growth in non-CSL revenue. This continues to provide a bullish underweight to the investment debate, as we firmly believe the market is under-reflecting these growth probabilities. In other words, in the distribution of probable outcomes for HAE, for the next 12 months, the data increasingly corroborates an outsized performance in plasma volume even walking into a weaker economic outlook.
Management guide FCF conversion [gross of restructuring expenditures] of $100–$130mm for FY23. We are aligned with that view. In fact, we project plasma revenues of $415mm by FY25, with ~$90mm in sequential revenues for the company up until this point. We believe HAE will generate ~$3.70 in earnings per share by this mark, up from a projected $2 per share in FY23 in our modelling, as seen below.
Exhibit 4. HAE forward estimates FY23–25′
Data: HB Insights Estimates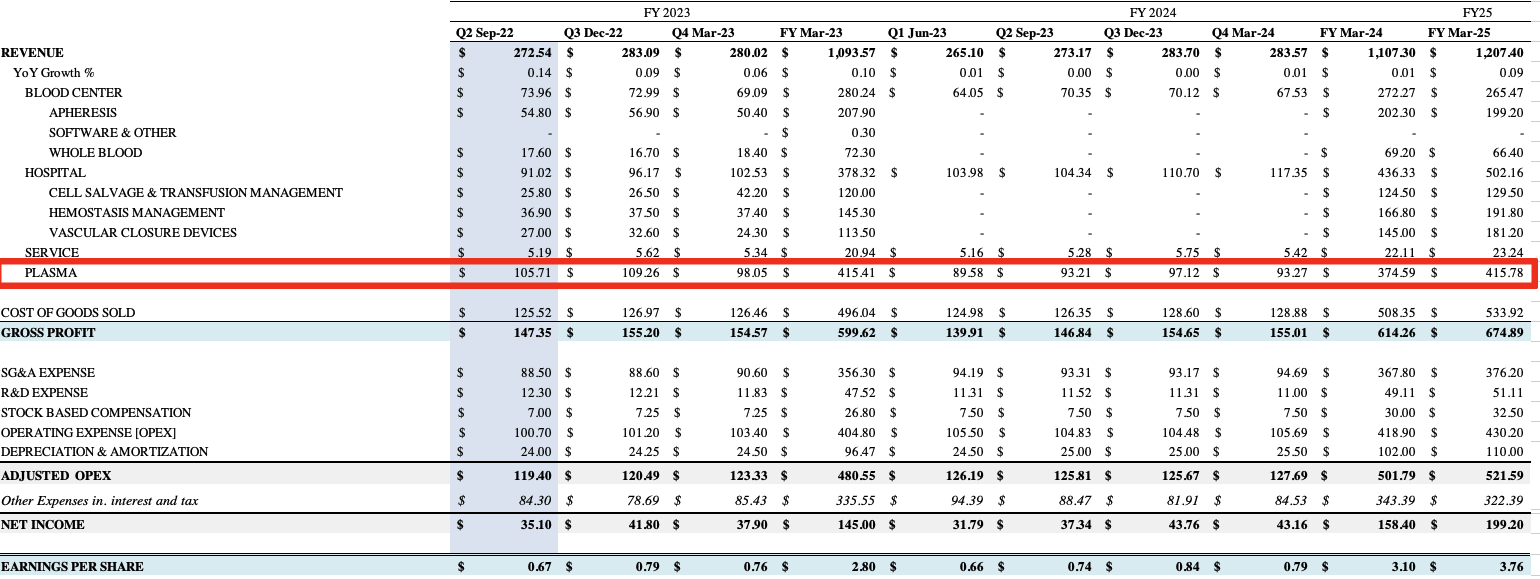
Meanwhile, we are satisfied with HAE’s intangible and tangible equity value that serves as a good indicator to what we’re buying in the company. After removing $466mm in goodwill from the balance sheet, shareholder equity adjusts down to $421mm from $770mm, however, within this net amount is $288mm in tangible assets, $313mm in adjusted intangible asset value, and niche exposure to plasma collection.
This is important to recognize in the investment debate, as return on assets has remained steady and printed 3.8% on a T12M basis last quarter. So the 77% increase resulted in a 48% leverage to ROA, and this will be integral to HAE’s growth story looking ahead as it continues to invest in R&D and therefore will grow its intangible asset base.
Technical factors
On the chart, shares have bounced from support 3x before looking topping and rolling over to the downside. We are now testing the support level again with the mouth of the ascending triangle being squeezed to the upside with long-term buying support, as seen in on balance volume (“OBV”) in the Exhibit below. We do note a mismatch in the rate of change between the HAE share price and long-term trend indicators shown below. We believe there is good reason to believe the current upside move has additional legs.
Exhibit 5. Ascending triangle with prices testing support after looking toppish in late August
Data: Refinitiv Eikon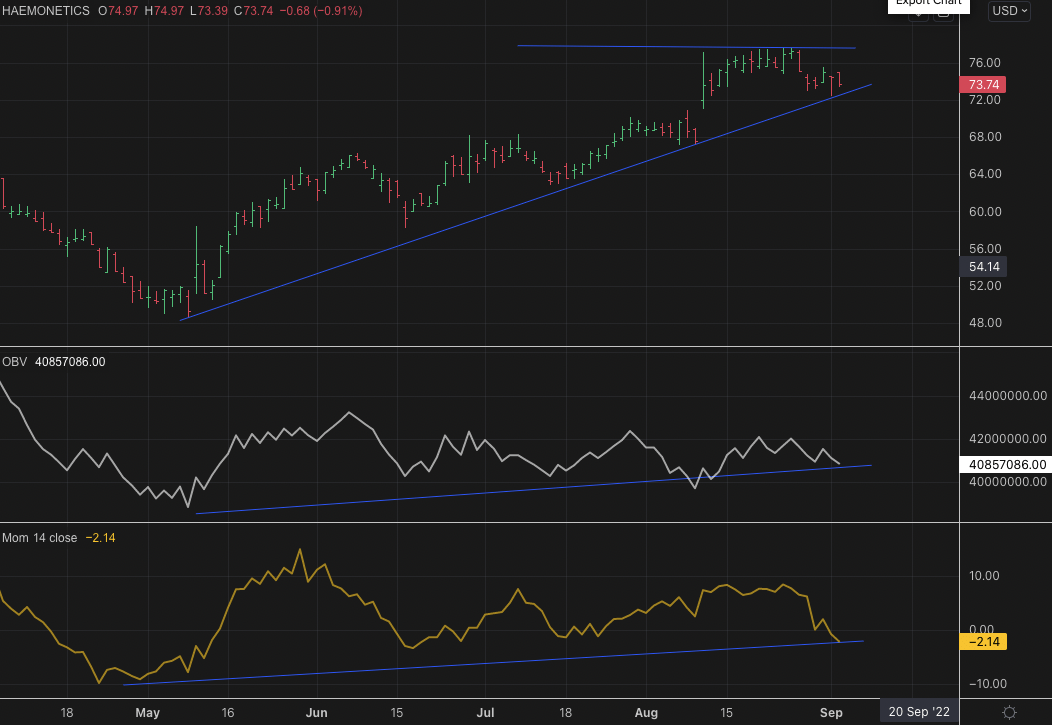
Shares are also positioned well above the cloud on a 9-month cloud chart with the lag line positioned equally as high above the cloud. This presentation bullish to us and confirmation of further bullish trend to be expected on the daily chart.
Exhibit 6. Shares trading above cloud support
Data: Refinitiv Eikon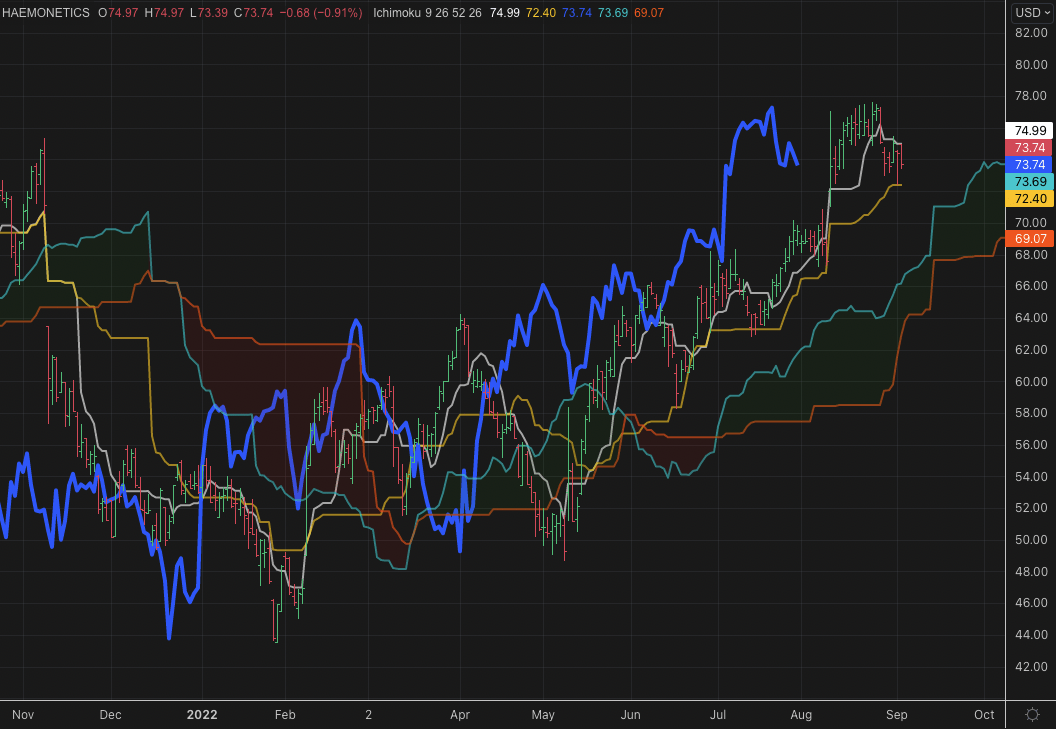
With these factors in mind we rate HAE a buy in continuation without previous investment thesis. Rate buy, price target $98.
Be the first to comment