

Foto-Video-Studio/iStock via Getty Images
Last week featured important bearish engulfing patterns on several major market indices. Fundamental investors might scoff at such a technical observation, but it’s a sign that the bears remain in control ahead of poor seasonal trends during the final third of September. It is not all doom and gloom, however, as we are almost to one of the most bullish parts of the election cycle – the start of Q4 of a mid-term year. Getting out your long-idea playbooks might be wise. One Chemicals company also endured a tough bearish engulfing weekly candlestick, but I see opportunities ahead of its Q3 earnings report Wednesday.
Bearish Engulfing Candles Commonplace Last Week
Stockcharts.com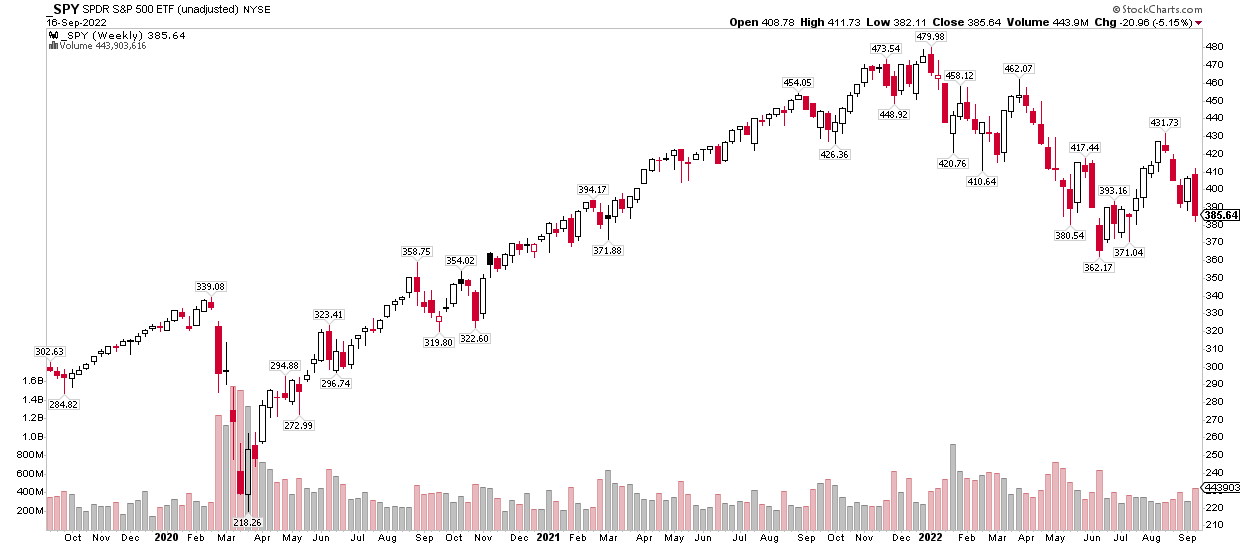
According to CFRA Research, H.B. Fuller Company (NYSE:FUL), together with its subsidiaries, formulates, manufactures, and markets adhesives, sealants, coatings, polymers, tapes, encapsulants, additives, and other specialty chemical products worldwide. The company operates through three segments: Hygiene, Health, and Consumable Adhesives; Engineering Adhesives; and Construction Adhesives.
The Minnesota-based $3.2 billion market cap Chemicals industry company within the Materials sector trades at a near-market GAAP earnings multiple of 18.1 using data from the last four quarters. H.B. Fuller pays a small 1.3% dividend yield, according to The Wall Street Journal.
On valuation, the firm’s earnings have been volatile over recent quarters, but its annual EPS picture shows a clearer uptrend. Using this year’s forecast EPS, FUL trades at just 14.2 times earnings. Looking to next year, $4.71 of per-share profits yields a somewhat cheap 12.7 operating P/E ratio.
FUL: Earnings & Valuation Forecasts
CFRA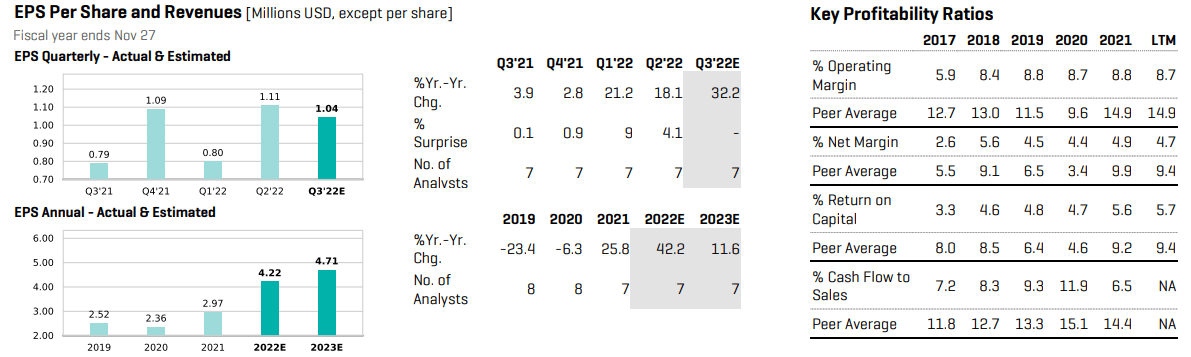
Wall Street Horizon’s corporate event data show a confirmed earnings date of Wednesday, Sept. 21 AMC with a conference call to follow on Thursday morning. Investors can listen live here.
Corporate Event Calendar
Wall Street Horizon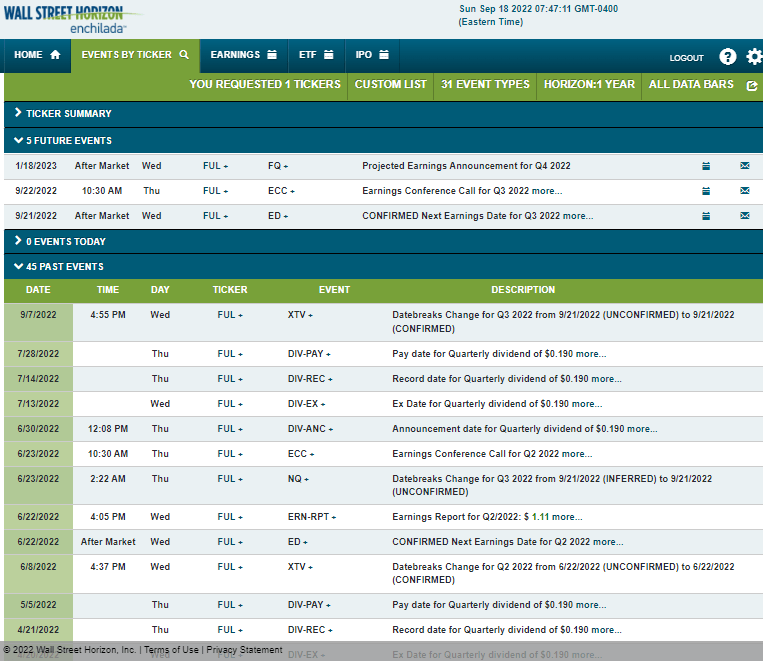
The Options Angle
Option Research & Technology Services (ORATS) data show a consensus EPS estimate of $1.05 for HB Fuller’s Q3 report. The options market has priced in a low 5.5% post-earnings share price swing using the soonest-expiring at-the-money straddle options, but that is actually a smidgen higher than the average over the previous seven quarters. Moreover, FUL shares do not have a history of producing big earnings-related stock price moves.
On the upside, the company’s positive earnings beat-rate history is an arrow in the bulls’ quiver for this week’s profit report.
A Strong Per-Share Earnings Number Expected
ORATS
The Technical Take
With decent earnings growth, a respectable forward valuation, and a positive earnings beat rate trend, does the chart support a bullish thesis here?
I see key support in the $57 to $59 range. With a big bearish engulfing weekly candle during options expiration week, FUL is right near that important zone in a descending triangle pattern. That’s not a bad thing, though. Shares are simply consolidating after a massive uptrend off the March 2020 lows. The presumption is that this corrective pattern should resolve with price breaking out and making new highs.
If the upper $50s does not hold, however, then a bearish measured move price objective of toward the mid to high $30s would trigger. You can also interpret the current pattern as a potential head and shoulder top.
On the upside, there’s some resistance in the $70 to $71 range.
FUL: Descending Triangle, Shares at Support
Stockcharts.com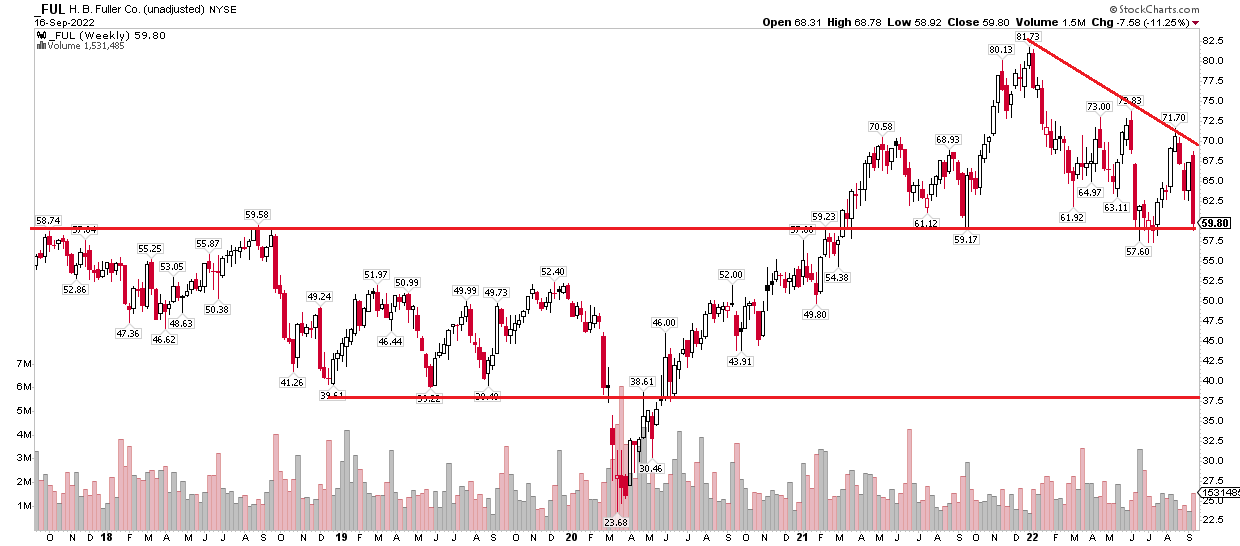
The Bottom Line
I think a long position on FUL stock ahead of and through earnings makes sense. Being long call options is a good play given low implied volatility, but an investor can also buy shares here with a stop in the mid-$50s based on the charts. Fundamental investors should like the valuation, too.
Be the first to comment