

StockByM/iStock Editorial via Getty Images
The prolonged stock market sell-off that disproportionately affected the most expensive names, principally large-cap players from the tech sector (defined broadly) which bear sizeable growth and quality premia, makes investors rethink their allocations.
There is no denying that being self-sufficient is essential for a period of more expensive capital and slower growth. And a point could be made that exiting the large-cap echelon completely would be a precarious move right now as the larger the company, the greater the chance it has superior profitability, and, hence, it should be resilient enough to survive the higher rates era comparatively unscathed.
And here smart-beta vehicles spring to mind. Moving away from traditional weighting schemas allows maintaining optimal exposure to the large-size factor without becoming too concentrated in mega-size companies and taking too many growth premia-related risks. In this regard, equal weight strategies are probably worth considering.
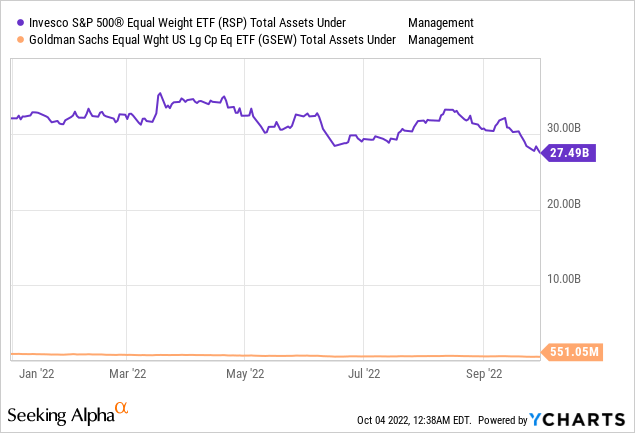
Aside from some better-known ETFs like the Invesco S&P 500 Equal Weight ETF (RSP), there are other smaller and somewhat underfollowed funds with similar strategies like the Goldman Sachs Equal Weight U.S. Large Cap Equity ETF (BATS:GSEW) which we will be discussing today.
Unfortunately, its strategy has not demonstrated that it is capable of consistently outperforming either the iShares Core S&P 500 ETF (IVV) or RSP. Surprisingly higher volatility and subsequently weaker risk-adjusted returns are among other disappointments. In this regard, I see little reason to invest in the fund.
Strategy basics and the portfolio structure
Incepted in September 2017, GSEW tracks the Solactive US Large Cap Equal Weight Index.
In essence, this is a smart-beta strategy focusing on the most expensive U.S. companies with an equal-weight approach at its core instead of traditional market cap weighting. In theory, this should be supportive of less steep drawdowns during times of market stress and potentially lower volatility. Besides, large-cap equal-weight portfolios should also have a natural tilt towards value, without becoming too vulnerable in terms of quality, which is frequently the case with smaller companies. Yet the reality is a bit more complex, and I will elaborate on that later in the note.
The major difference between this benchmark and the S&P 500 Equal Weight index tracked by RSP is that the latter follows a quarterly rebalancing schedule instead of monthly. This could be one of the reasons behind performance differences touched upon below in the article.
Expectedly, we see that the top ten holdings of GSEW are entirely different from IVV’s, with no trillion club members present, yet the cohort unsurprisingly bears some resemblances with RSP, with Biogen (BIIB) as a key investment. This pharmaceutical company has just ~0.13% weight in the S&P 500 ETF owing to its market cap of ~$38.8 billion.
Created by the author using data from the funds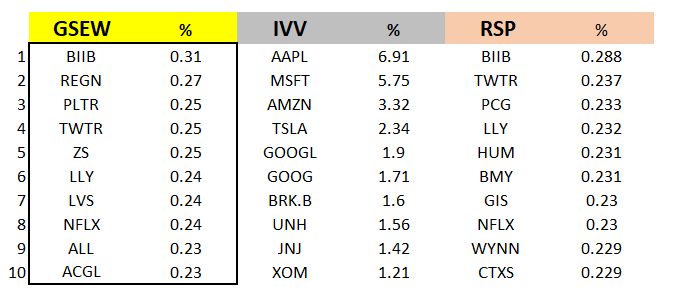
Sector allocation differences are also supervening from the weighting schema. Specifically, in contrast to IVV, GSEW and RSP are not that heavy in tech, which could be a tailwind should investor exodus from the sector amid interest rate concerns continue. Meanwhile, both allocated a materially larger share of the net assets to cyclical sectors like industrials and financials, which, in my view, can easily result in both underperforming IVV in case of a monetary policy misstep triggering a full-scale recession.
Created by the author using data from the funds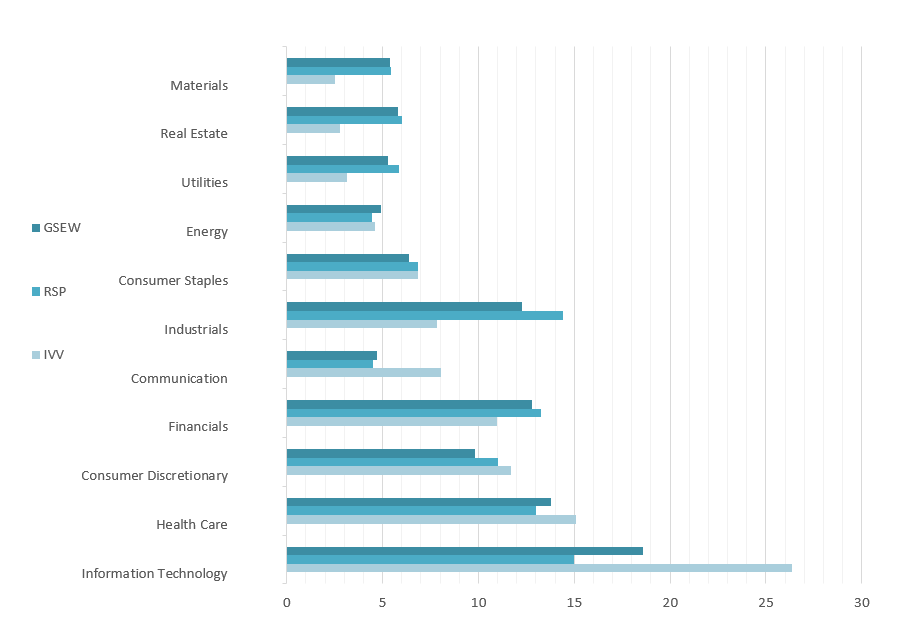
Smaller exposure to tech has likely been supportive of the Invesco ETF’s stronger performance compared to IVV this year, yet this has not helped GSEW which has trailed both.
In terms of factors, GSEW overweights value stocks compared to IVV. For instance, the share of сompanies with an at least B- Quant Valuation grade is over 15% vs. around 10% in IVV. Again, even though we see larger exposure to value, one of the best-performing factors in 2022, it did little to prop up GSEW’s returns.
Besides, the flip side of this equal-weight strategy is comparatively weaker quality. Just 87% of GSEW’s holdings have a B- Profitability rating or higher, vs. ~96% in the case of IVV. Here, it clearly has an edge.
How did GSEW perform compared to peers in the past?
The ETF’s past performance is fairly confusing.
Created by the author using data from Portfolio Visualizer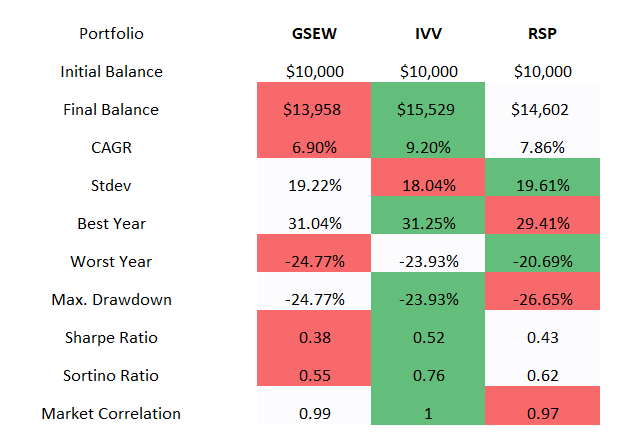
First, we see GSEW lagging behind the S&P 500 ETF since inception, with only a 6.9% compound annual growth rate delivered over the October 2017 – September 2022 period. This is explainable given that equal-weight portfolios were less capable of reaping benefits from the tech and growth rally of 2020 bolstered by the ultra-loose monetary policy designed to support the ailing economy. To corroborate, in 2020, GSEW delivered around 16.3% total return, while tech- and growth-heavy IVV advanced by 18.4%. RSP failed to keep pace with both, delivering only 12.7%.
GSEW & IVV returns comparison (Created by the author using data from Portfolio Visualizer)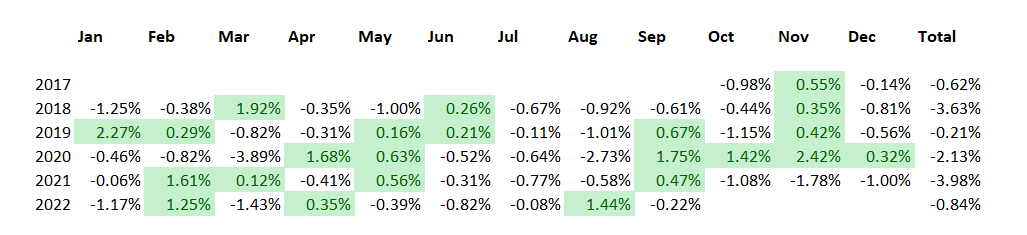
Overall, this Goldman Sachs ETF had trailed IVV every year since inception, in sharp contrast to its peer, which managed to achieve alpha in 2021, during the vaccines-induced capital rotation, and also during 2022 YTD marred by inflation and hasty attempts of central banks to tame it without hurting economic growth.
RSP & IVV returns comparison (Created by the author using data from Portfolio Visualizer)
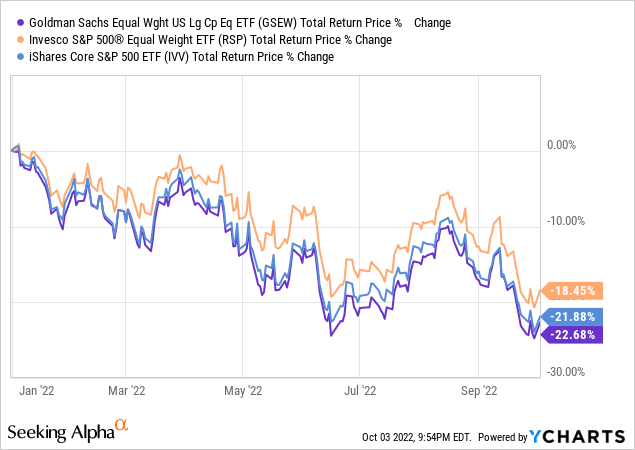
What is fairly surprising is that the strategy that is supposed to eliminate the issues inherent to top-heavy portfolios somewhat (e.g., overreliance on just a handful of most expensive stocks and deeper drawdowns in case they face a painful valuation reset like the one triggered this year by inflation and interest rate increases) suffered more in the first nine months of 2022, even compared to IVV and especially to its peer, RSP, which outperformed both. However, if we look at the max drawdown over the period analyzed, RSP has the weakest result in the group.
Moving to standard deviation, neither GSEW nor RSP managed to deliver a figure lower than IVV, so the corollary here is that these equal-weight large-cap strategies are not that capable of suppressing volatility. For better context on risk, both score weaker compared to the iShares fund, which has an A Risk rating while both the Invesco and Goldman Sachs ETF have A-.
Final thoughts
Equal-weight strategies should have lower volatility and perform better during times of market stress. Unfortunately, this is not always the case.
GSEW’s historical performance does not look supportive of a bullish thesis. Even this year, despite larger exposure to the value factor and a smaller allocation to tech, the ETF has underperformed IVV.
In terms of risk, the fund was not capable of reducing volatility as successfully as one might expect. Meanwhile, it has a smaller allocation to highly profitable companies compared to the S&P 500 ETF, which is a disappointment.
It does have one major benefit, namely its paper-thin expense ratio of only 9 bps. Nevertheless, this did not translate into stronger returns in the past, as with a much higher ER of 20 bps, RPS still outperformed it. In sum, GSEW is a Hold at best.
Be the first to comment