

imagedepotpro
Skewness in asset returns is a perplexing phenomenon and evokes different behavior from investors. Some show a preference for stocks with significant right skewness, which is much like playing the lottery, hitting the jackpot every once in a while, and delivering outsized returns. Other investors try to steer clear of such volatility and opt for stocks that have no skewness or even demonstrate left skewness.
But how does skewness in returns relate to other factors in asset pricing? Might investors be betting on particular factors precisely because they want lottery-like skewness in their returns?
To answer these questions, we constructed cross-sectional growth and value portfolios and examined the distribution of monthly returns over five-year periods. From an investing universe of all the equities traded on the NYSE and NASDAQ since 1975, we created our growth and value portfolios out of the quintile of stocks with the highest and lowest P/E ratios, respectively.
Our growth portfolio exhibited more right skewness in its returns, on average, than our value portfolio did. This held true over 6 of the 10 time periods.
Growth Stocks: Monthly Returns
| Mean | Median | Volatility | Skewness | |
| 1975 to 1980 | 3.02% | 0.78% | 53.24% | 8.92 |
| 1980 to 1985 | 1.33% | 0.02% | 44.26% | 1.10 |
| 1985 to 1990 | 2.04% | 0.85% | 55.99% | 20.44 |
| 1990 to 1995 | 1.88% | 0.38% | 59.80% | 10.51 |
| 1995 to 2000 | 3.44% | 1.44% | 67.22% | 8.99 |
| 2000 to 2005 | 1.43% | 0.01% | 71.05% | 2.54 |
| 2005 to 2010 | 0.71% | 0.02% | 48.44% | 2.14 |
| 2010 to 2015 | 1.50% | 0.90% | 41.30% | 7.30 |
| 2015 to 2020 | 6.94% | 0.57% | 50.22% | 9.97 |
| 2020 to 2022 | 1.22% | 0.28% | 59.21% | 5.10 |
| Average | 2.35% | 0.52% | 55.07% | 7.70 |
Value Stocks: Monthly Returns
| Mean | Median | Volatility | Skewness | |
| 1975 to 1980 | 2.44% | 0.00% | 47.26% | 2.07 |
| 1980 to 1985 | 1.66% | 0.01% | 44.25% | 1.94 |
| 1985 to 1990 | 1.26% | 0.02% | 48.23% | 14.73 |
| 1990 to 1995 | 1.26% | 1.02% | 55.05% | 2.55 |
| 1995 to 2000 | 1.23% | 0.00% | 52.13% | 5.62 |
| 2000 to 2005 | 2.43% | 1.15% | 18.08% | 9.31 |
| 2005 to 2010 | 0.68% | 0.00% | 48.75% | 2.24 |
| 2010 to 2015 | 1.70% | 1.02% | 38.59% | 1.85 |
| 2015 to 2020 | 0.86% | 0.56% | 36.92% | 1.45 |
| 2020 to 2022 | 1.38% | 0.53% | 82.10% | 9.30 |
| Average | 1.49% | 0.43% | 47.13% | 5.10 |
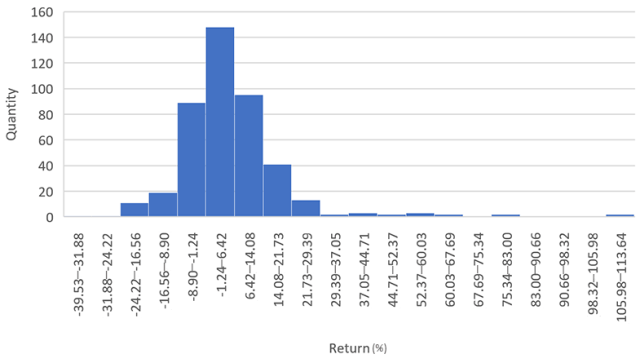
So, what can we glean from these results? Our theory is that skewness tends to move based on investor preferences. That is, when a particular factor is in vogue, skewness significantly increases while it’s in fashion. For instance, growth stocks were all the rage as the dot-com bubble inflated from 1995 to 2000, and they demonstrated significant skewness while value stocks showed a distinct lack of it.
Growth Stocks: Monthly Returns, 1995 to 2000
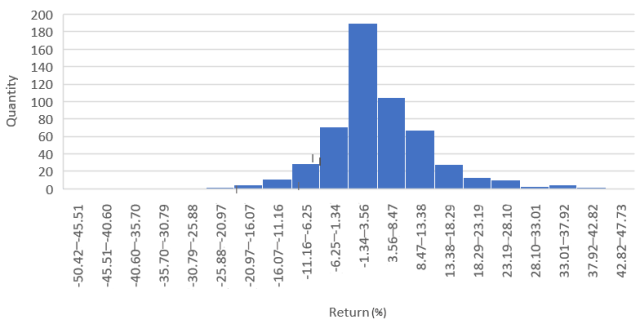
Growth’s popularity took off again in the 2010 to 2020 period, while value underperformed and again showed a lack of skewness in returns.
Value Stocks: Monthly Returns, 2010 to 2015
Now, these results don’t tell us which direction the association goes, only that an association exists. The data suggests to us that when a particular asset pricing style is popular among investors, returns for that style exhibit greater skewness.
In sum, investors in growth stocks may be pursuing lottery-like payouts, especially when such stocks are in style.
| All posts are the opinion of the author. As such, they should not be construed as investment advice, nor do the opinions expressed necessarily reflect the views of CFA Institute or the author’s employer. |
Editor’s Note: The summary bullets for this article were chosen by Seeking Alpha editors.
Be the first to comment