

Khanchit Khirisutchalual
Written by Nick Ackerman, co-produced by Stanford Chemist. This article was originally published to members of the CEF/ETF Income Laboratory on September 23rd, 2022.
First Trust Energy Infrastructure Fund (FIF) has been enjoying some gains this year, which is more than can be said of most other investments. The fund is tilted towards holding a healthy weighting in energy primarily through MLPs. However, the fund also has a strong tilt towards utilities in the portfolio. That’s another area of the market that has been holding up relatively better.
The last time I covered the fund, I suggested that strong distribution coverage could lead to a distribution boost. Well, that boost happened, but it looked more like a rounding error than an actual boost.
First Trust Energy Infrastructure Fund (FIF) (the “Fund”) (NYSE: FIF) has increased its regularly scheduled monthly common share distribution to $0.063 per share from $0.0625 per share. The distribution will be payable on October 17, 2022, to shareholders of record as of October 4, 2022. The ex-dividend date is expected to be October 3, 2022.
This still puts the distribution at a very conservative level. With strong distribution coverage, I’d continue to believe that they have the capacity to boost it further. However, given the current economic environment, they might be more reluctant to do so. They probably don’t want to raise aggressively, only to potentially cut in the future Before March 2020, this was a fund that had never cut its distribution since its 2011 inception. That’s quite a feat for a fund that focuses so much on energy exposure through the oil collapse in 2015. The heavier utility sector exposure would have significantly helped the fund during that time.
The Basics
- 1-Year Z-score: -0.44
- Discount: -13.60%
- Distribution Yield: 5.49%
- Expense Ratio: 1.43%
- Leverage: 20.60%
- Managed Assets: $341.3million
- Structure: Perpetual
The objective of FIF is “to seek a high level of total return with an emphasis on current distributions paid to shareholders.” They intend to achieve this through “investing primarily in securities of companies engaged in the energy infrastructure sector. These companies principally include publicly-traded master limited partnerships and limited liability companies taxed as partnerships, MLP affiliates, YieldCos, pipeline companies, utilities and other infrastructure-related companies that derive at least 50% of their revenues from operating, or providing services in support of, infrastructure assets such as pipelines, power generation industries.”
To sum up, in fewer words, they simply invest in anything infrastructure-related in the energy and utility sectors. That leaves them quite flexible in investing within these sectors.
The fund’s more moderate use of leverage can be seen as beneficial. Although on the other hand, had the fund been more aggressive, the returns for this year could have been even greater. Of course, we only know that now with the superpower of hindsight.
That being said, should we go into a real recession, this moderate amount of leverage could be better. In 2019, the fund went into 2020 with $107.5 million in borrowings. This was slashed to just $55.3 million by the end of 2020, meaning the fund had to deleverage its portfolio.
Today, borrowings have inched back up to $70.3 million. The underlying portfolio’s growth has outpaced the leverage they’ve been adding to the portfolio. Thus, that leverage ratio has been coming down over the last year or so. The borrowings they have are based on floating rates. So, as the Fed raises interest rates, the fund’s leverage expense will increase.
…the borrowing rate is either (i) the applicable Term SOFR rate plus 85 basis points plus (a) 10 basis points for a loan with a one month interest period, (b) 25 basis points for a loan with a three month interest period, and (c) 40 basis points for a loan with a six month interest period, (ii) Daily Simple SOFR Rate plus 85 basis points plus 11.448 basis points, or (iii) the greatest of (a) the Prime Rate in effect, (b) 2.00% plus the Federal Funds Effective Rate, or (c) 2.00% plus the Daily Simple SOFR. The borrowing rate for any loan advanced prior to February 9, 2022, was the applicable LIBOR rate plus 85 basis points.
The good news is that they aren’t completely susceptible to these interest rate changes. They have hedged some of this with interest rate swaps that can appreciate as rates rise.
FIF Interest Rate Swaps (First Trust)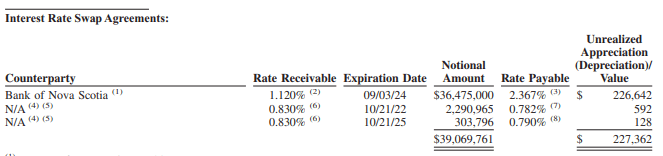
The fund’s expense ratio, when including leverage, comes to 1.71%.
Performance – Attractive Discount
Despite the fund’s deleveraging that we touched on above, the fund had still reclaimed its prior pre-COVID NAV level. That’s generally not something that should be relied on after such a big deleveraging event has occurred.
YCharts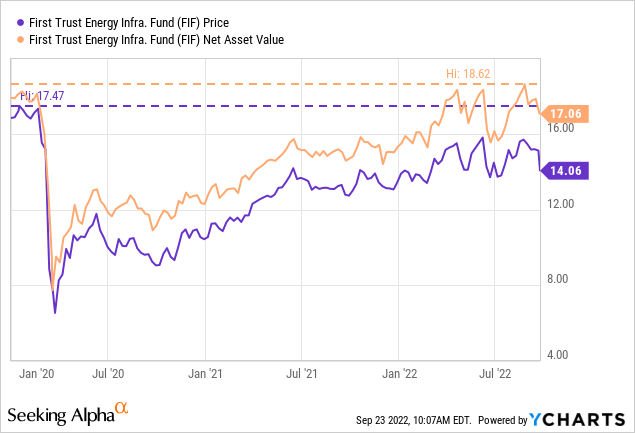
On the other hand, the price has not reached the same level. That is due to the fund’s discount widening significantly after the COVID crash. A distribution cut and a sharp drop-off in a fund’s price will certainly spook investors away. Still, over the longer term, it is looking as though the fund is still trading well below its historical discount.
YCharts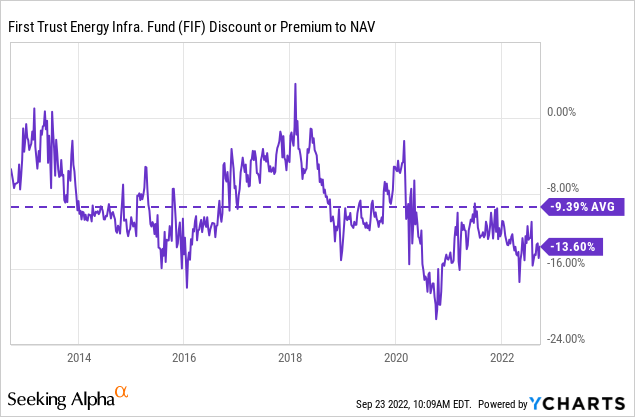
Overall, the fund has performed quite well relative to the market due to the weighting in energy and utilities. Here’s a look at the fund’s annualized performance compared to several indexes that they have selected themselves. Naturally, the utility sector has done much better over the longer-term. Although that has reversed in the last couple of years due to the significant rebound from the COVID lows and crude oil pushes rushing higher.
FIF Semi-Annual Report (First Trust)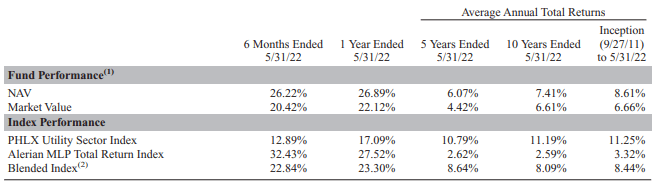
Distribution – Conservative Yield
The fund is one of the lowest paying CEFs out there with a regular distribution. That is likely also contributing to the fund’s rather deep discount. That being said, it is also what is contributing to the fact that the fund’s NAV has recovered too. Despite the weakness in the energy space from 2015 to 2020, FIF never cut until the final 2020 plunge put the final nail in the coffin.
FIF Distribution History (CEFConnect)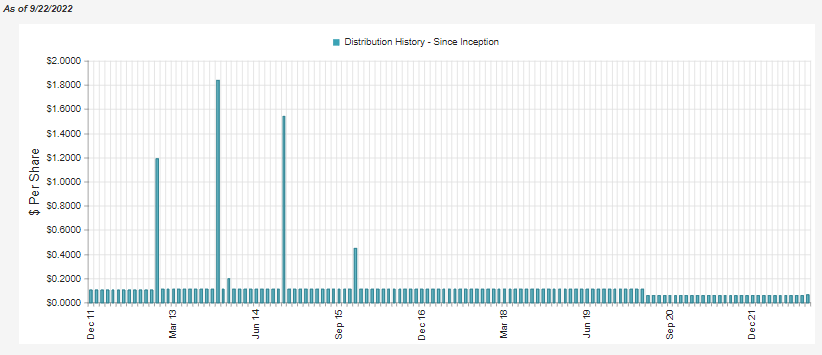
As I mentioned above, I had previously suggested that the fund would boost its distribution. The rather meager distribution we received means that the fund still has the capacity to raise further but is fairly conservative given the environment. The fund’s distribution rate comes to 5.49%, with a NAV rate of 4.75%.
The net investment income coverage of the fund comes to 11.54%.
FIF Semi-Annual Report (First Trust)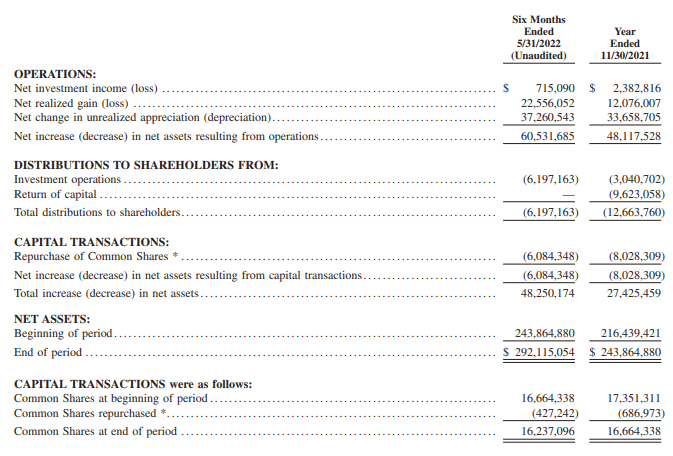
Now, one might be wondering why I keep saying the fund has further capacity to raise. That comes because a significant portion of the portfolio is invested in MLPs. MLP distributions are return of capital that are NOT factored into the NII of a fund.
When looking at the fund’s cash flows, we can see that MLPs contributed another $4,189,909 in cash to the fund that was classified as ROC.
FIF Semi-Annual Report (First Trust (highlight from author))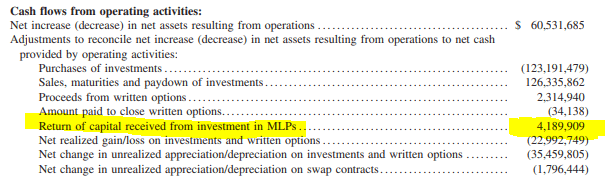
The distribution coverage comes in at around 80% when factoring that in. That leaves a small gap for the fund to pay the distribution from capital gains. As an equity fund, this is some of the strongest distributable cash flow you will find in the space.
Some of these gains will come from the fund’s options writing too. In fact, if you include the latest reports realized gains from the written options contracts and the DCF, you’ll see coverage jump to 108.6%. That doesn’t include any realized gains in the underlying investments either, which would only further contribute to the coverage.
FIF Semi-Annual Report (First Trust)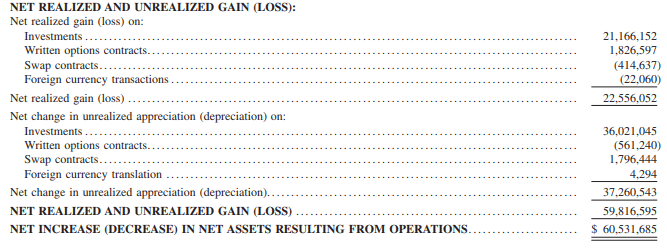
Given the figures we see here, we would often see a fund that might be required to boost their distribution or pay a year-end special. To comply with regulated investment company status, they have to pay out the majority of their earnings to shareholders.
However, since the fund had significant losses previously, they had capital loss carryforwards at the end of fiscal 2021 of over $26.5 million. They can utilize those to eliminate the gains they have realized now.
For tax purposes, we see that return of capital makes up the majority of the distribution classification for the prior year. This is because of the MLP exposure and the capital loss carryforwards that the fund had.
FIF Tax Classification (First Trust)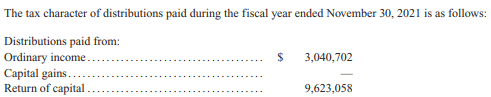
The fund can regularly have ROC classifications in its distribution. At least to some degree due to the MLP distributions. This was the case even if you look back in 2013 and 2014. Those were years when the energy sector was doing really well.
FIF’s Portfolio
The managers can be fairly aggressive with repositioning their portfolio, as reflected in the portfolio turnover rate. In the last six months, it came to 38%. For fiscal 2021 it was 73% and then 80% in fiscal 2020. That being said, the actual weighting in terms of sectors or their largest holdings stays relatively familiar.
With this latest update, electric power & transmission have declined a touch, with natural gas transmission and petroleum product transmission increasing their exposure. The last time we looked at the industry breakdown was at the end of February 28th, 2022.
FIF Industry Weighting (First Trust)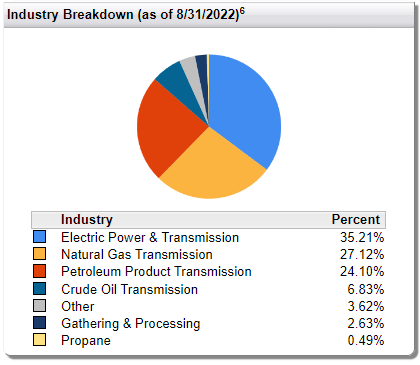
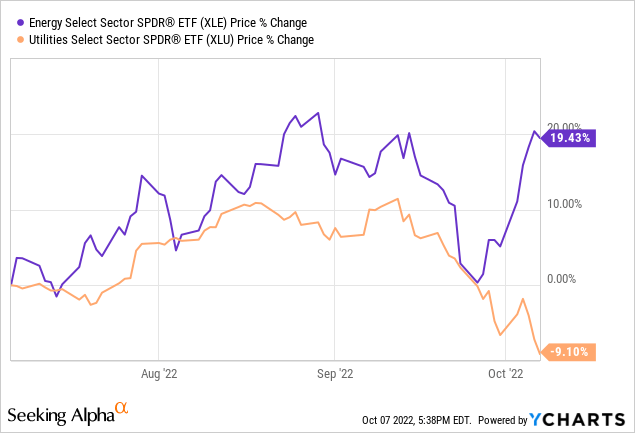
It wasn’t an overly material shift and could be just a reflection of the market conditions during this time. Energy has continued to perform quite well, outpacing the utility sector. Therefore, even if the fund didn’t make any changes, some of these weighting shifts would have happened anyway. We see this reflected in a comparison of the Energy Select Sector SPDR (XLE) and Utilities Select Sector SPDR (XLU) below.
One thing to note is how volatile the energy sector continues to be. Despite the recent strong performance, you never know what energy will do. After such a strong run, it is one area that I was becoming a bit cautious. It is more susceptible to economic downturns. That being said, OPEC coming to the rescue with big production cuts definitely has put new life into the sector recently.
Looking at the top ten, we see several of the same names as we did earlier this year.
FIF Top Ten (First Trust)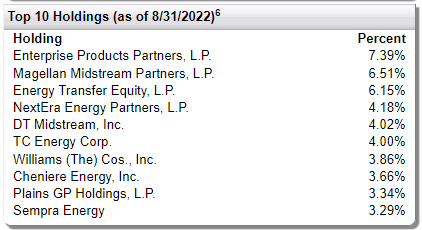
Enterprise Products Partners (EPD) has maintained its top spot. However, the weighting has inched up from the 6.65% weighting it had previously. This is a top MLP player with strong consistency in its distributions. That also includes a position in Magellan Midstream Partners (MMP) with the same reputation.
A new entrant to the top ten that catches my attention is DT Midstream (DTM). I had recently looked at DTM as I became a shareholder due to the spin-off from DTE Energy (DTE). While I liked the name and will continue to hold it, I felt the share price was becoming rather elevated. Since then, shares have come down nearly 11%. The “market” also came down 9% during that time.
When covering FIF, one thing that comes up is the fund’s low distribution. We’ve already touched on this, but it is materially lower than some of the fund’s top holdings’ own yields. Therefore, it could be a bad look when holdings pay out 7% yields, and you don’t have over 100% coverage of your ~5% distribution yield. While that is certainly true, especially for several MLP funds, it isn’t true across the board. Of course, the fund’s expense ratio also plays a role in reducing coverage.
YCharts is showing an error for LNG; they started paying a dividend out over a year ago. With the latest quarterly dividend at $0.395, we have a dividend yield of 1%.
YCharts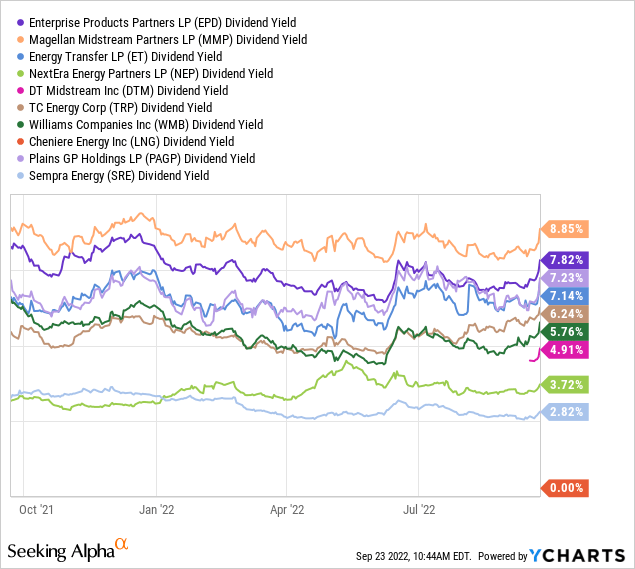
The utility holdings in the fund pay materially less, as we can see in SRE and even NEP. If we move into other utility names that aren’t represented in the top ten but are held in the fund, we can see a similar trend. Several of these utility names that hold a fairly sizeable allocation of assets in the fund are Southern Co (SO), American Electric Power (AEP), NextEra Energy (NEE) and IDACORP (IDA).
YCharts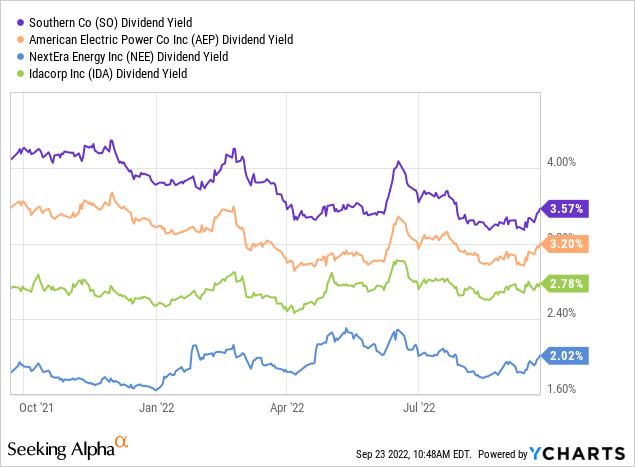
Investing directly into individual MLPs is obviously a viable approach. However, it does add single stock risk and risks that might be specific to MLPs or the energy space. Investing in these names via FIF provides more diversification to avoid those two risks. This happens by gaining exposure to nearly 70 names and exposure to both energy and utilities.
Conclusion
FIF has held up relatively well to the broader downturn. It is invested in energy and utilities, mixing in highly cyclical but defensive names under one fund. That has seen the fund hold up better in terms of its share price and distribution. The latest distribution boost was tiny, and I believe there could be more increases in the future, barring any black swan event.
Be the first to comment