

hxyume
Given difficult times, especially over the past few years and now in the light of inflation, it should come as no surprise that the value category of retail has proven to be an area of attractive growth. One company that operates in this space that has exhibited attractive upside from a revenue perspective is Grocery Outlet Holding Corp. (NASDAQ:GO). That trend continues into the current fiscal year. Although lumpy, profitability for the company has also been trending higher. But this doesn’t necessarily mean that the firm makes sense for investors to buy into today. Given how shares are priced, the stock does look to be rather expensive at this time. This is true on both an absolute basis and relative to similar players. Because of this, I would even go so far as to rate the company a soft ‘sell’, reflecting my belief that it is likely to underperform the broader market for the foreseeable future.
Value retail does not make a value stock
According to the management team at Grocery Outlet Holding Corp., the company operates as a high-growth, extreme value retailer of quality, name brand consumables and fresh products. The company sells these products through 418 stores located across California, Washington, Oregon, Pennsylvania, Idaho, Nevada, and New Jersey. Generally speaking, the stores that it operates are of these small box format and management prides itself in what it calls a “WOW” shopping experience. According to them, this involves providing everyday staple products that generate customer excitement and that encourage frequent visits from bargain-minded shoppers. By having a flexible buying model instead of a rigid one where the firm knows well ahead of time what it’s going to purchase, it’s able to provide name brand products at prices that are often 40% to 70% lower than the prices provided by conventional retailers.
The overall corporate structure of the company is definitely interesting and warrants some consideration. According to management, its stores are run by independent operators. These are different from store managers in the sense that the operators are responsible for store operations, including the ordering, merchandising, and management of inventory. They are also responsible for local marketing and for directly hiring, training, and employing their store workers. Just like a franchisee, these independent operators contribute capital upfront in order to establish their business and, in return, they share in store-level gross profits with the corporation. Approximately 50% of its store-level gross profits are shared with these independent operators. Likewise, any losses incurred are also generally split in the same manner. Unlike in a traditional franchise arrangement, however, the independent operators do not actually own the store. The corporation itself builds each location and leases it out to the independent operators, granting them the right to occupy the store solely for the purpose of operating it.
Author – SEC EDGAR Data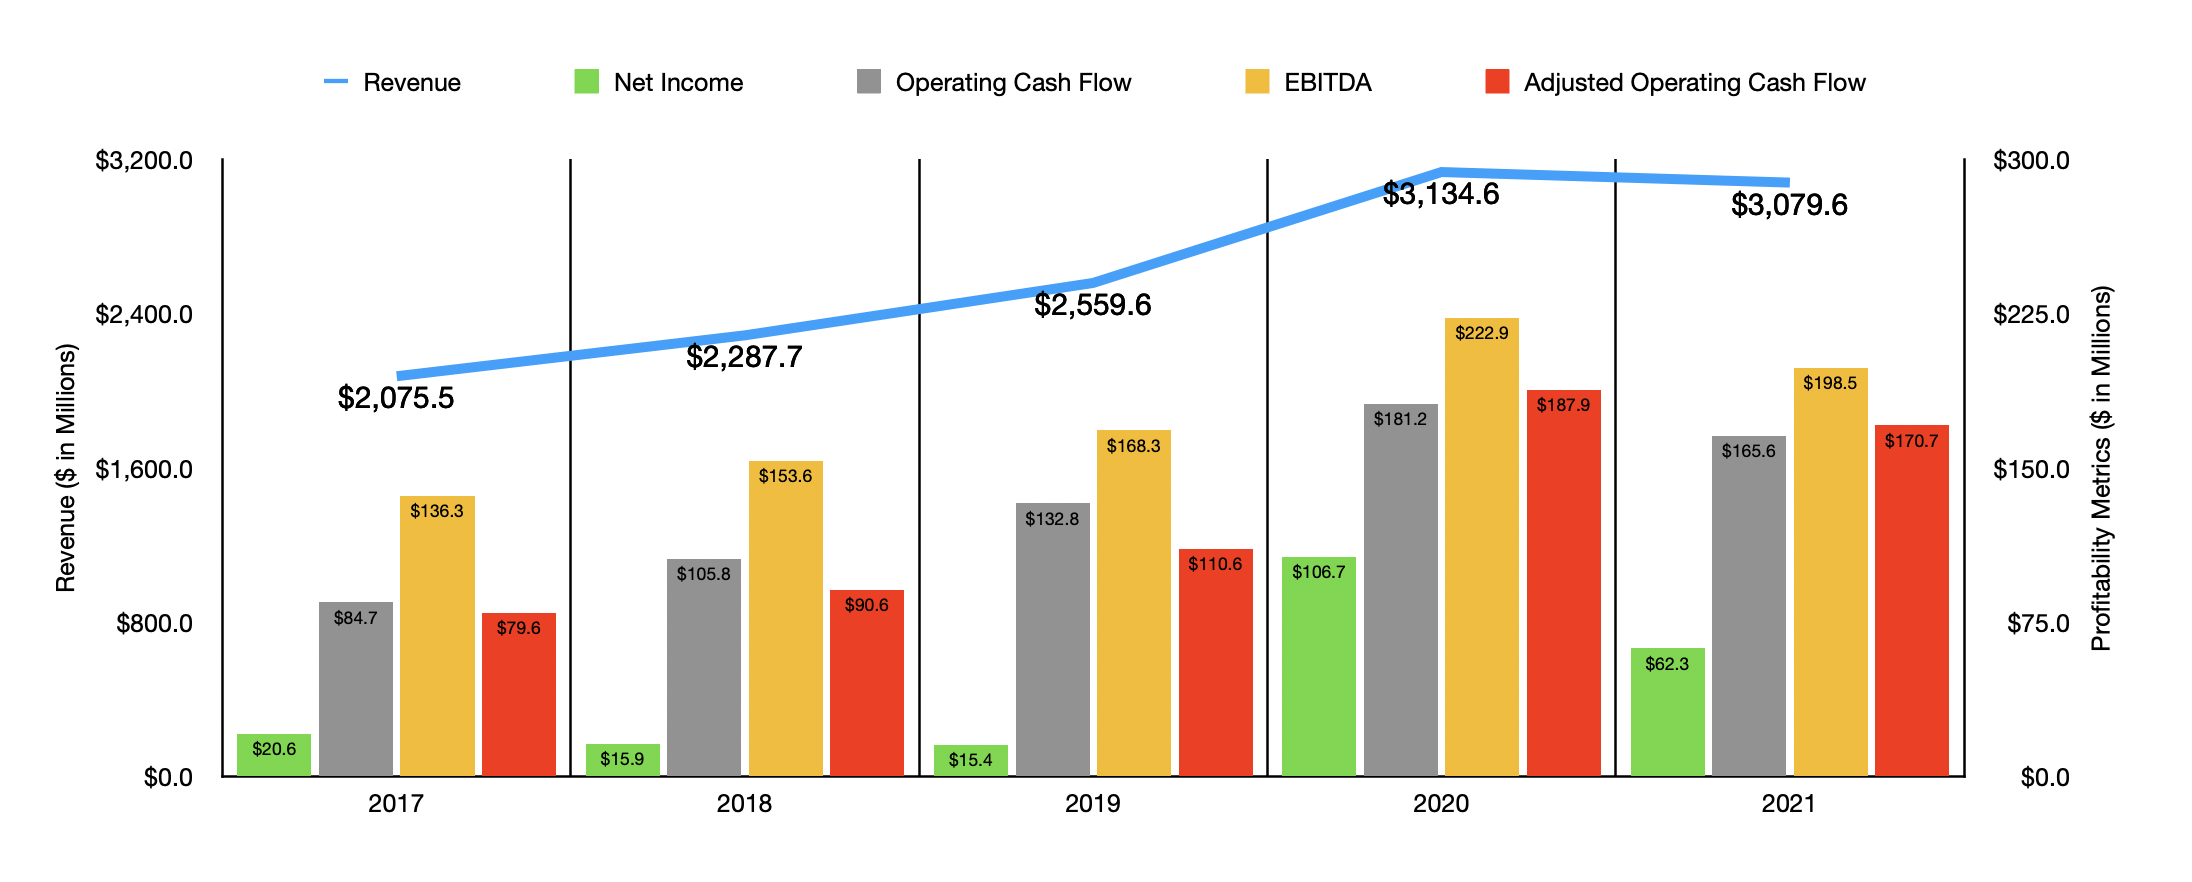
This enterprising, value-oriented business model has created a nice bit of growth for investors in recent years. From 2017 through 2020, sales of the company expanded from $2.08 billion to $3.13 billion. Sales then drop slightly to $3.08 billion in 2021. The general trend toward growth for the firm has come about because of two key factors. First and foremost was a rise in the number of stores in operation. In 2017, the company had 293 locations in operation. By the end of 2021, this had grown to 415. The other contributor has been growing comparable store sales. Between 2017 and 2020, the aggregate increase in-store sales has been 29.7%. But then, in 2021, this metric dropped by 6%.
Author – SEC EDGAR Data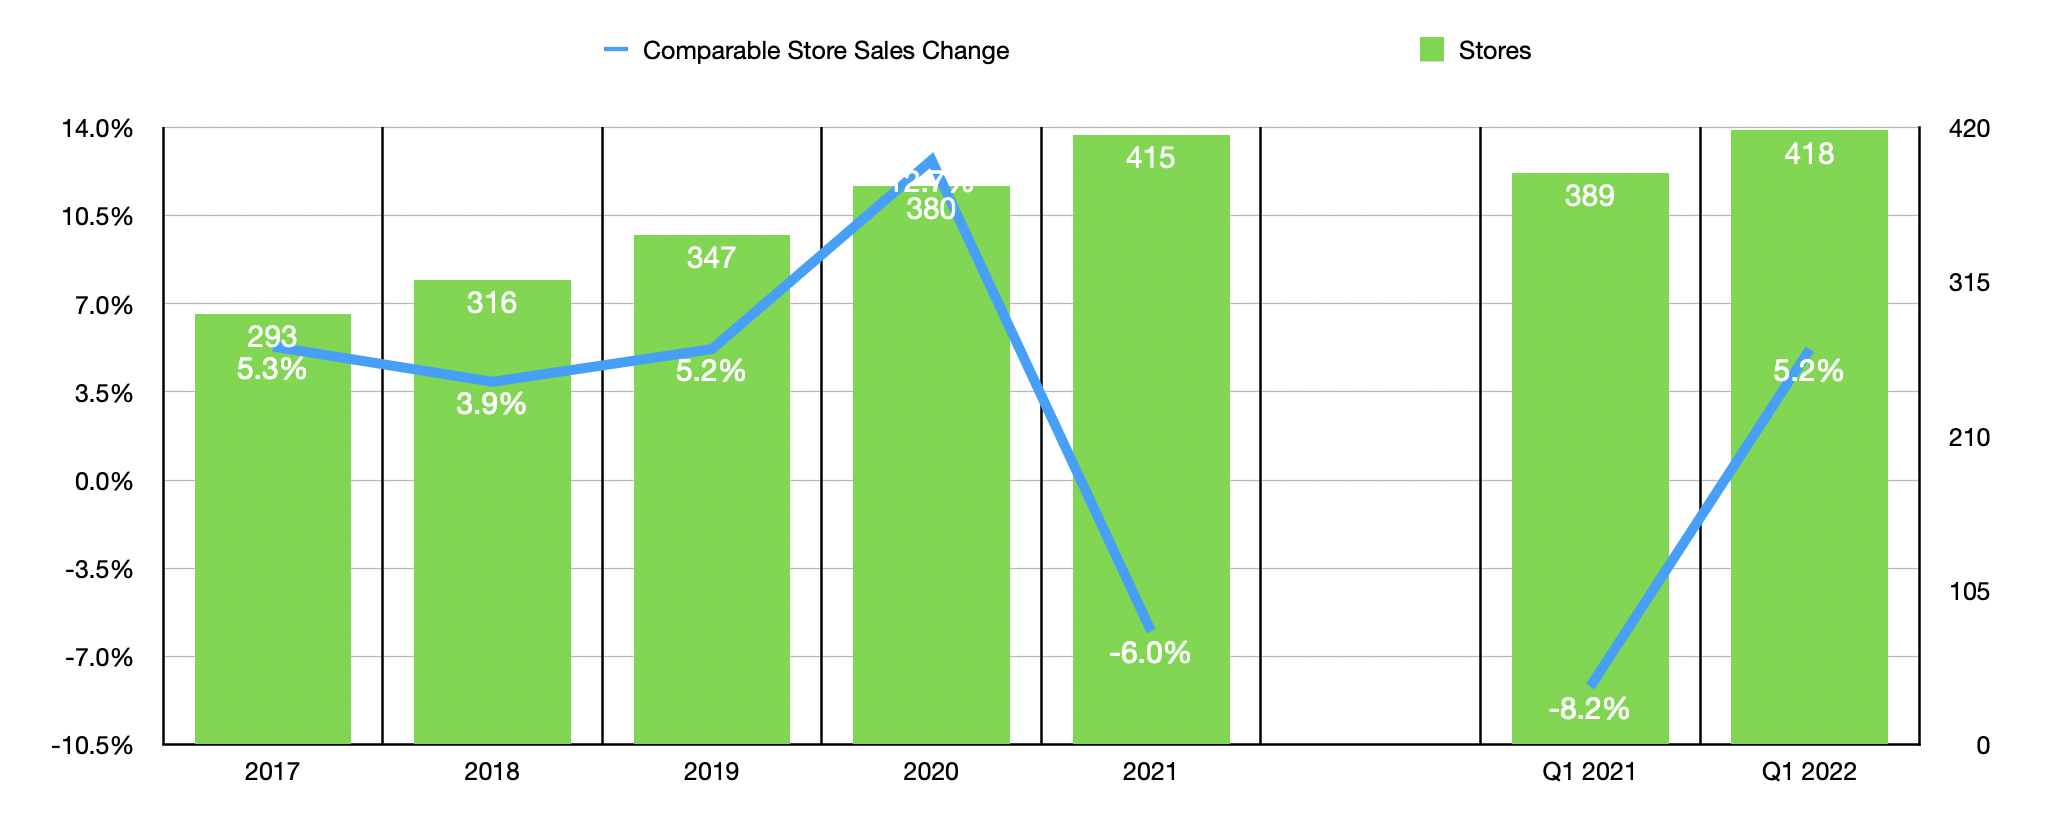
Profitability for the company has not been quite as consistent. Between 2017 and 2019, net income dropped from $20.6 million to $15.4 million. Profits then spiked to $106.7 million in 2020 before being cut to $62.3 million last year. Operating cash flow, on the other hand, rose consistently between 2017 and 2020, climbing from $84.7 million to $181.2 million. In 2021, this metric fell to $165.6 million. If we adjust for changes in working capital, the trend would have been similar. A similar relationship can also be seen when looking at EBITDA, with the metric ultimately climbing from $136.3 million in 2017 to $222.9 million in 2020 before dropping to $198.5 million last year.
Author – SEC EDGAR Data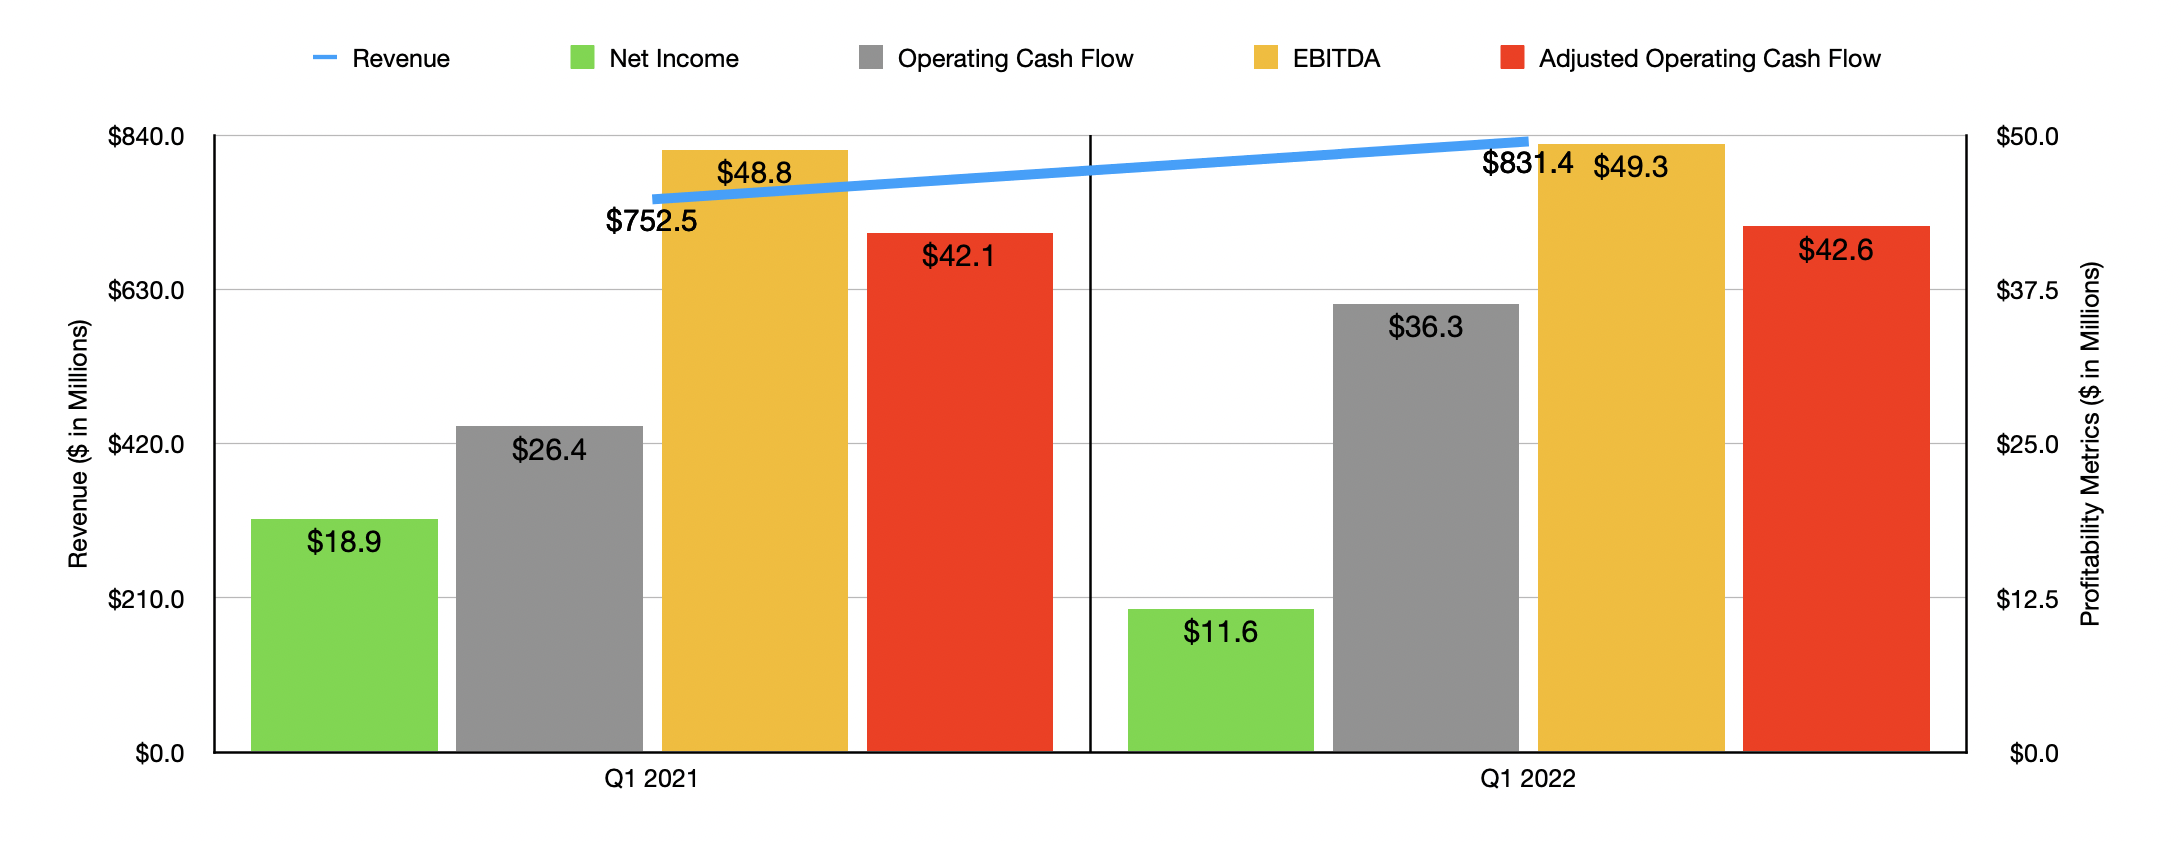
When it comes to the 2022 fiscal year, the picture for the business has been largely positive. In the first quarter of the year, sales came in at $831.4 million. That represents an increase of 10.5% compared to the $752.5 million generated the same quarter one year earlier. This came as the store count for the company rose from 389 locations to 418 and as the comparable store sales for the business expanded by 5.2%. Profitability has been somewhat mixed, but generally positive as well. Net income dropped from $18.9 million in the first quarter of 2021 to $11.6 million the same time this year. On the other hand, operating cash flow rose from $26.4 million to $36.3 million, while the adjusted figure for this inched up from $42.1 million to $42.6 million. Meanwhile, EBITDA expanded from $48.8 million to $49.3 million.
When it comes to the 2022 fiscal year as a whole, management expects revenue to continue climbing, likely coming in at between $3.39 billion and $3.42 billion. This should be driven in part by the addition of 28 net stores to the company’s network, with the rest of the growth attributed to a comparable store sales increase of between 5.5% and 6.5%. Using midpoint expectations, net income should be around $93 million, representing a partial recovery from the 2021 decline. When it comes to EBITDA, management expects a reading of between $213 million and $220 million. Using midpoint figures there, and applying that same growth to operating cash flow, we should anticipate a reading on that front of $186.2 million.
Author – SEC EDGAR Data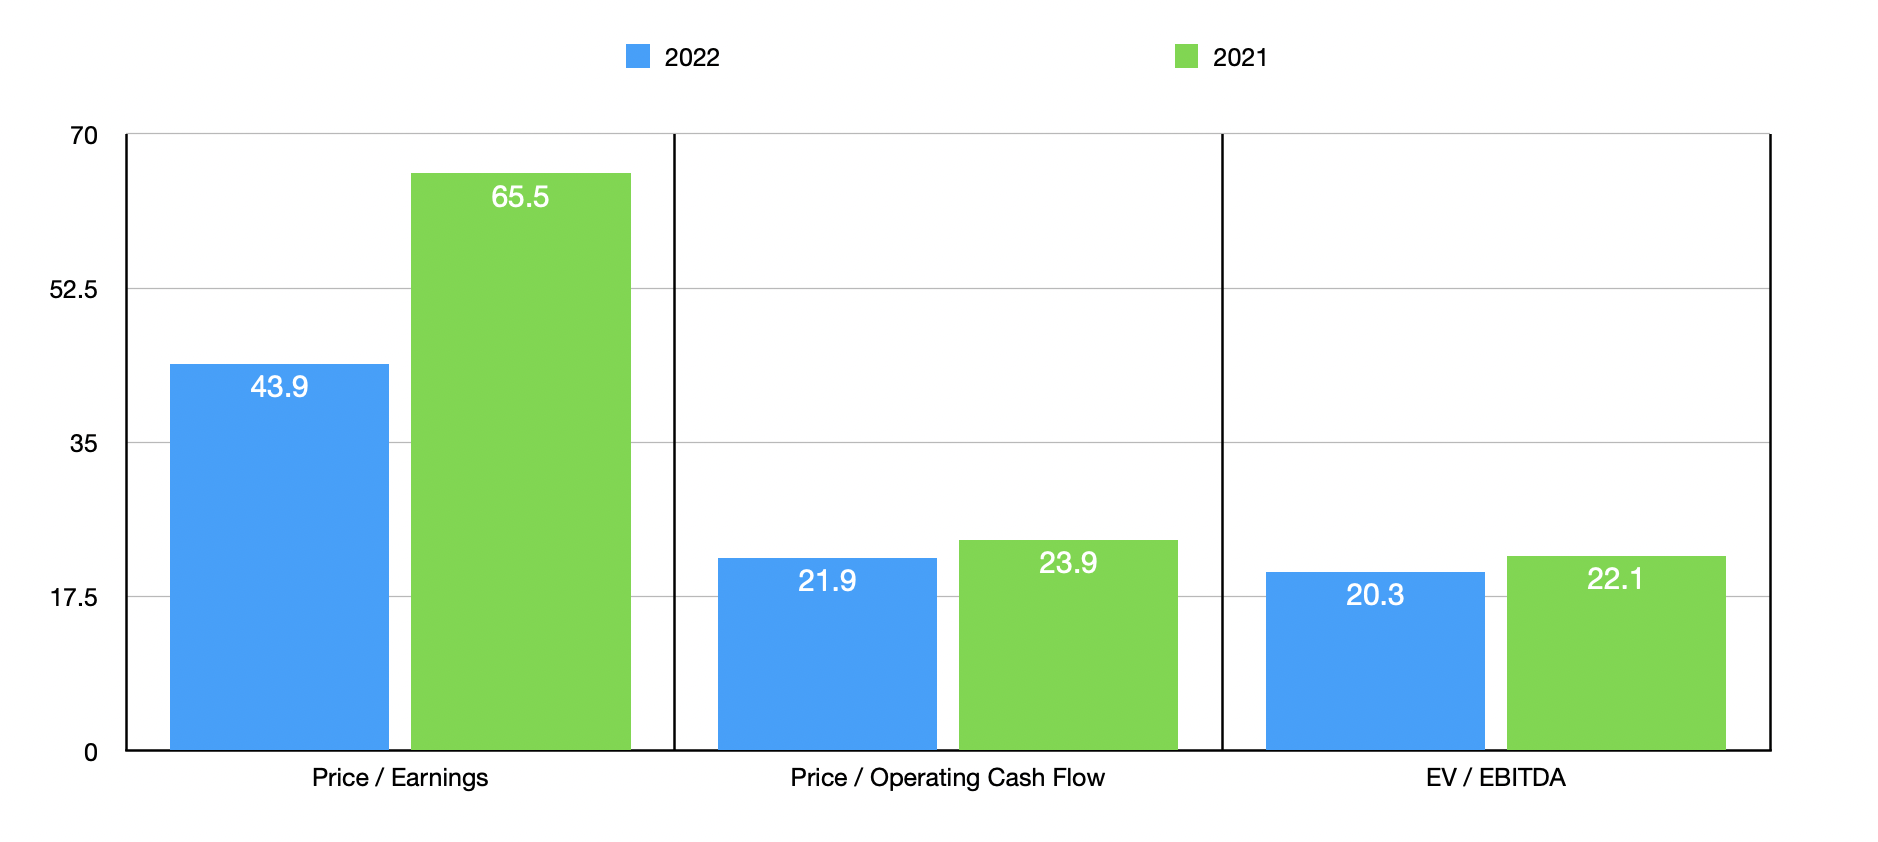
Taking these figures, it’s not difficult to value the company. On a forward basis, the company is trading at a price-to-earnings multiple of 43.9. This is down from the 65.5 reading that we get if we use 2021 figures. The price to adjusted operating cash flow multiple should fall from 23.9 using last year’s results to 21.9 this year. And the EV to EBITDA multiples should decline from 22.1 to 20.3. As part of my analysis, I also compared the company to five other retailers. On a price-to-earnings basis, these companies ranged from a low of 9.8 to a high of 22.6. Using the price to operating cash flow approach, the range is from 4.6 to 9.7. And when it comes to the EV to EBITDA approach, the range is from 6.4 to 11.4. In all three cases, Grocery Outlet Holding Corp. was the most expensive of the group.
| Company | Price/Earnings | Price/Operating Cash Flow | EV/EBITDA |
| Grocery Outlet Holding Corp. | 65.5 | 23.9 | 22.1 |
| Sprouts Farmers Market (SFM) | 12.7 | 7.3 | 9.0 |
| Natural Grocers by Vitamin Cottage (NGVC) | 14.0 | 6.0 | 11.0 |
| The Kroger Co. (KR) | 16.2 | 6.6 | 7.3 |
| Albertsons Companies (ACI) | 9.8 | 4.6 | 6.4 |
| Casey’s General Stores (CASY) | 22.6 | 9.7 | 11.4 |
Takeaway
Based on the data provided, Grocery Outlet Holding Corp. is definitely a very interesting firm in my book. I like its approach to value-oriented shoppers. That should prove useful, especially during these difficult times. However, shares of the business do look very expensive, even on a forward basis. They are so expensive, in fact, that I have a difficult time believing that any material upside is warranted in the near term. Because of this, I have decided to rate the business a soft ‘sell’ for now.
Be the first to comment