

Nasdaq, Bitcoin Talking Points:
- Both the Nasdaq and Bitcoin are testing key spots of support after aggressive sell-offs.
- It’s been a brutal 2022 for Bitcoin but much of that pain was relegated to the first-half of the year. Matters haven’t been much prettier in the Nasdaq and both are sitting on key supports ahead of next week’s FOMC.
- When markets go into risk-off mode, we’ll often see correlations align but that doesn’t mean that the correlation is going to last and thusly makes it difficult to plot strategy around.
- The big driver of both bearish trends has been higher rates and this is something that can remain until we reach a point of capitulation at the Fed.
- The analysis contained in article relies on price action and chart formations. To learn more about price action or chart patterns, check out our DailyFX Education section.
Recommended by James Stanley
Download our USD Forecast
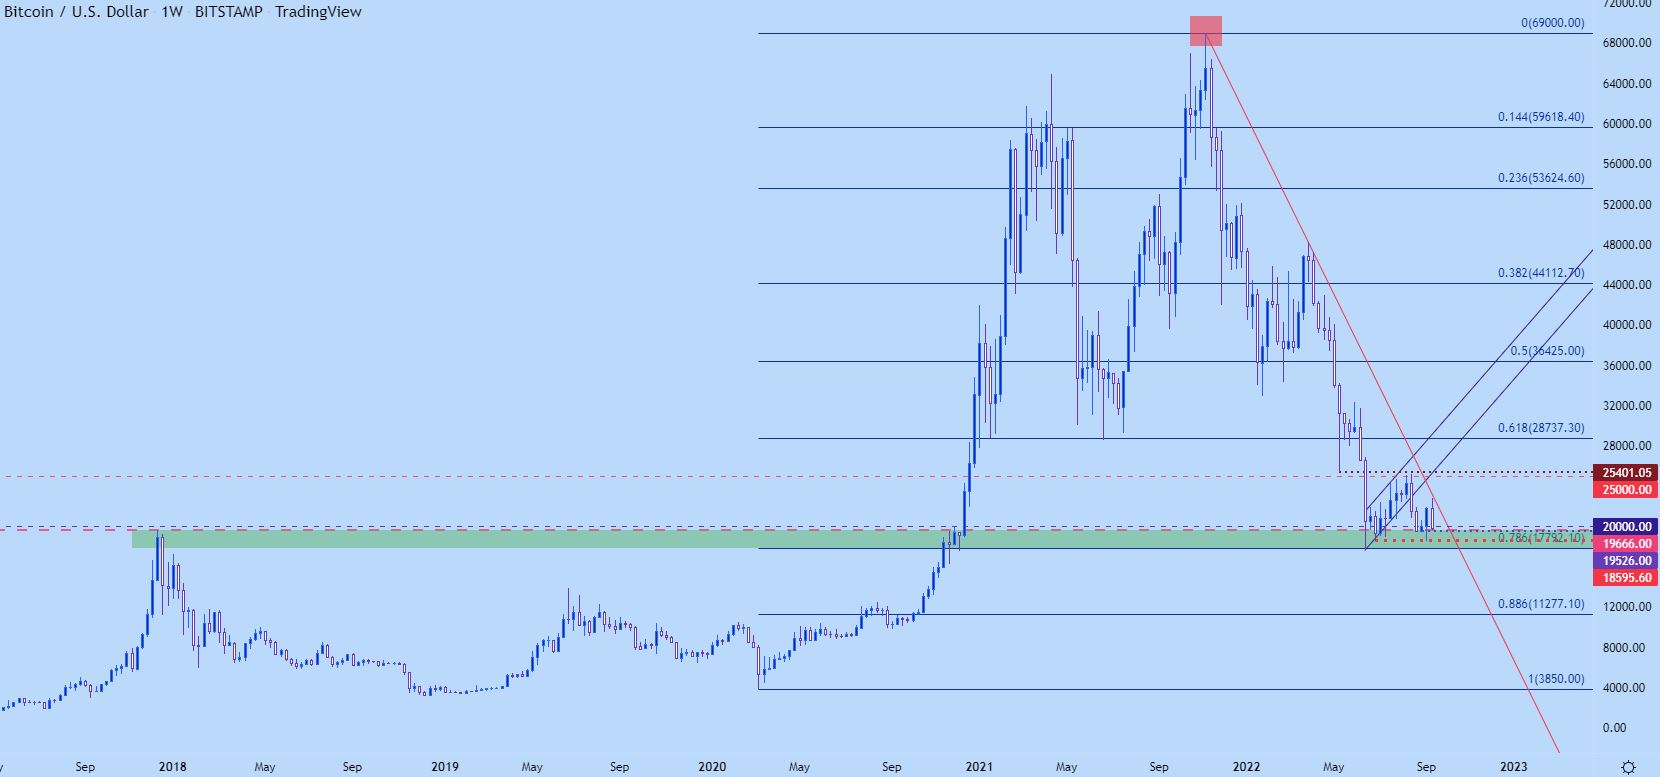
Bitcoin is back to a very key zone of support. I’ve been tracking this over the past few months as it was the first area that finally stopped the bleeding from the March-June sell-off. This runs from the 2017 swing high of $19,666 down to the 78.6% Fibonacci retracement of the 2020-2021 major move.
Bitcoin Weekly Price Chart
Chart prepared by James Stanley; Bitcoin on Tradingview
When this area came into play in March, buyers slowly returned to the market as a bullish channel built. But, given the pace of the prior sell-off that bullish channel was a bear flag formation, and that started to give way in late-August, around a week before Chair Powell’s speech at Jackson Hole. Interestingly, that’s also around the time that sellers started to hit back on the Nasdaq following a two-month-rally off of June lows.
Bitcoin dipped back into the support zone in early-September but soon found support at the late-June low, which led to a bounce that led into this week’s trade – all the way until the Tuesday CPI release. And, like the Nasdaq, both markets were slammed on the back of that data. But – interestingly Bitcoin is holding at a higher-low at this point – above that swing from last week – just like the Nasdaq.
Bitcoin Daily Chart
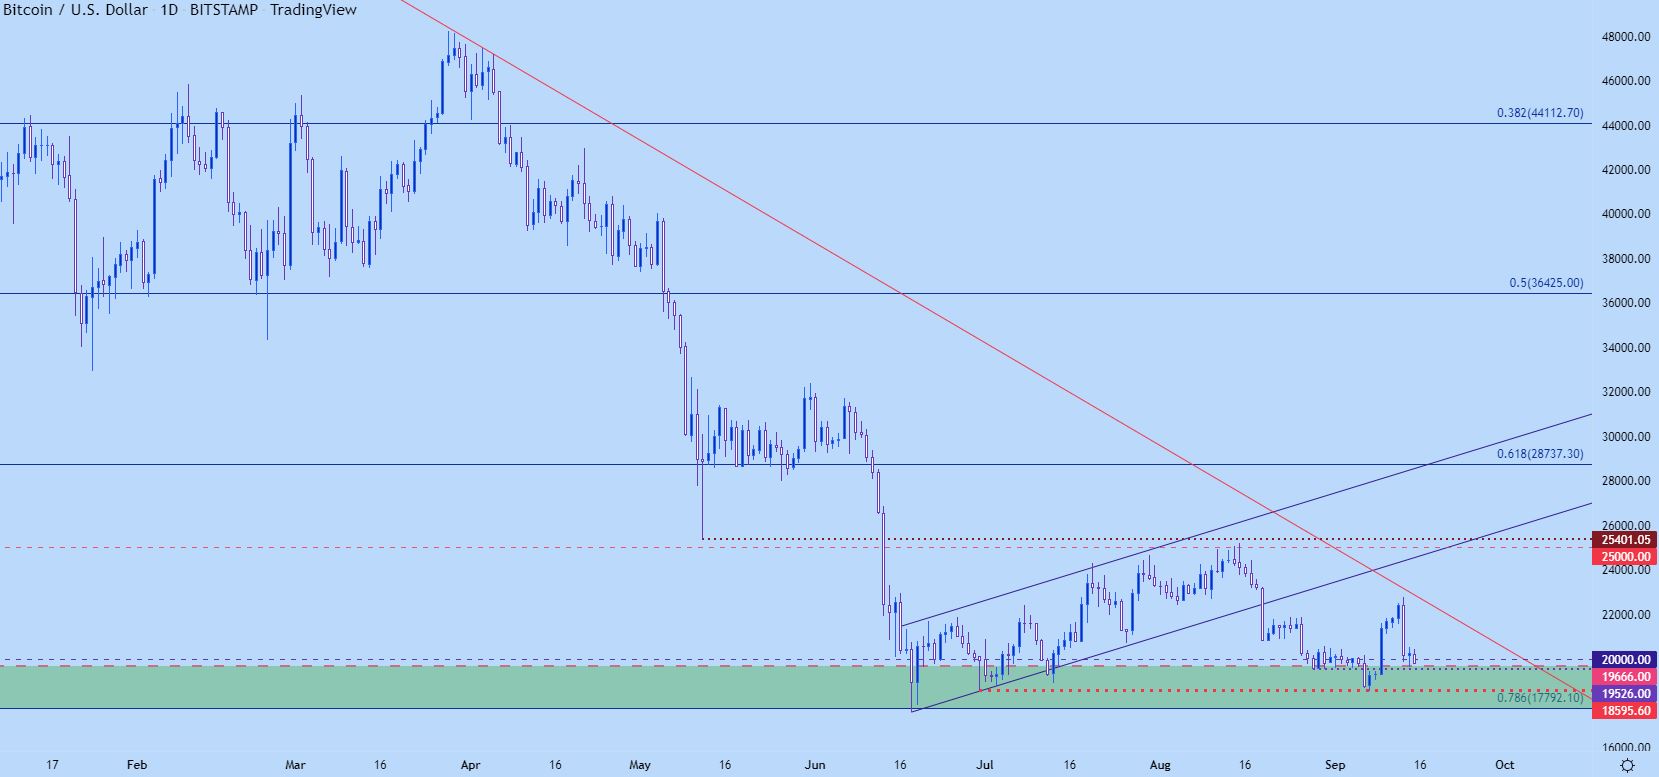
Chart prepared by James Stanley; Bitcoin on Tradingview
Bitcoin Short-Term
The level at $19,666 was in-play again yesterday albeit in a very quick manner. Buyers quickly returned and prices jumped back above the $20k psychological level. Since then, however, there’s been a tendency towards lower-highs which sets up for a short-term descending triangle. That’s a bearish formation, and this keeps the door open for another support test in the near-term.
(note): While writing this report the descending triangle break took place, and now the look is for another support test around the $19,666 level. If bears can push below that, with a lower-low, then we’ll have a fresh lower-low and lower-high which equates to a bearish short-term price action trend. Next support would the late June low that helped to bring a bounce last week.
Bitcoin Hourly Chart
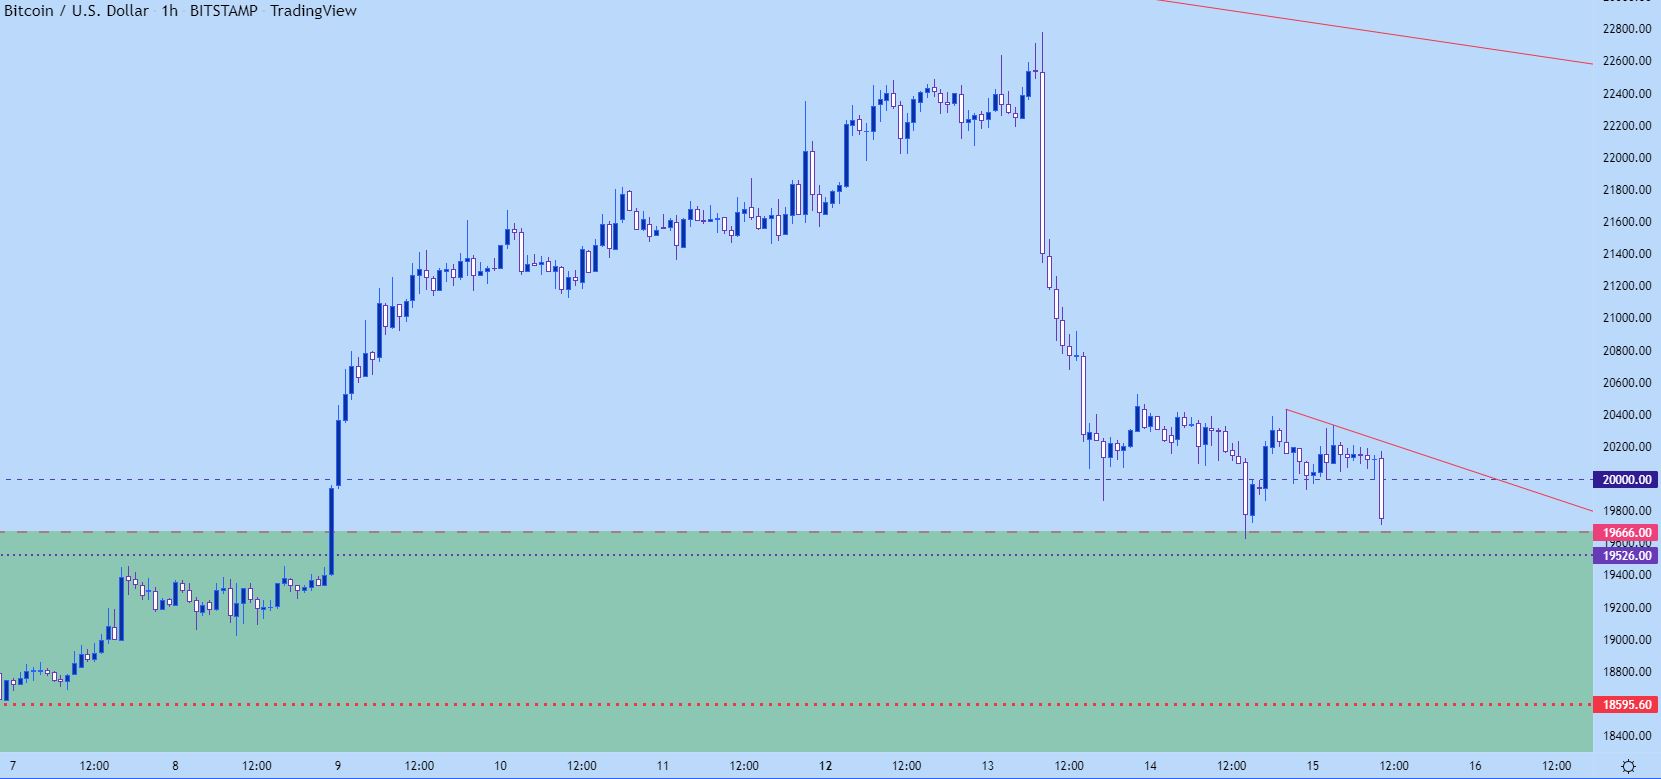
Chart prepared by James Stanley; Bitcoin on Tradingview
Nasdaq
I looked into the Nasdaq on Monday so this will be relatively brief compared to Bitcoin. And, after all, there is some similarity here so no point in re-hashing.
Similar to Bitcoin the Nasdaq set its high in November of last year. November is key, because this is also when FOMC Chair Jerome Powell broached the idea of ‘retiring’ the word transitory. Until then – the Fed had shrugged off continually-higher inflation reads of 5 or 6%, instead saying that the price increases were due to supply chain problems. Well, those supply chain problems never really abated and on Tuesday inflation came in at 8.3%.
There’s some real worry about this. Prior examples of elevated inflation have shown it to be a difficult problem to tame. Once the trend begins, there’s not many ways of slowing it down other than hiking interest rates to draw capital out of the system. And the very nature of doing that means that leverage is under pressure, because higher rates means higher borrowing costs and also a greater opportunity cost for that capital.
After all, the big reason for keeping low rates is to incentivize investment in order to drive economic growth. And that’s precisely what’s happened for much of Bitcoin’s life and, for the better part of the past 13 years for the Nasdaq. So, as that relationship goes the other way with the Fed’s aim of tightening, both markets are seeing bearish scenarios.
In the Nasdaq, the big level at the moment is the 12k level. Price hasn’t pierced-below that price since rising-above in July and this remains a key point of support potential for bearish approaches. Resistance was in-play earlier this week, just ahead of that CPI report and that runs around the 13k handle.
From the four-hour chart below, we can see a mass of candlestick wicks just above the 12,074 level and that’s pretty clear evidence of buyers coming in to support the lows.
Recommended by James Stanley
Get Your Free Top Trading Opportunities Forecast
Nasdaq Four-Hour Price Chart
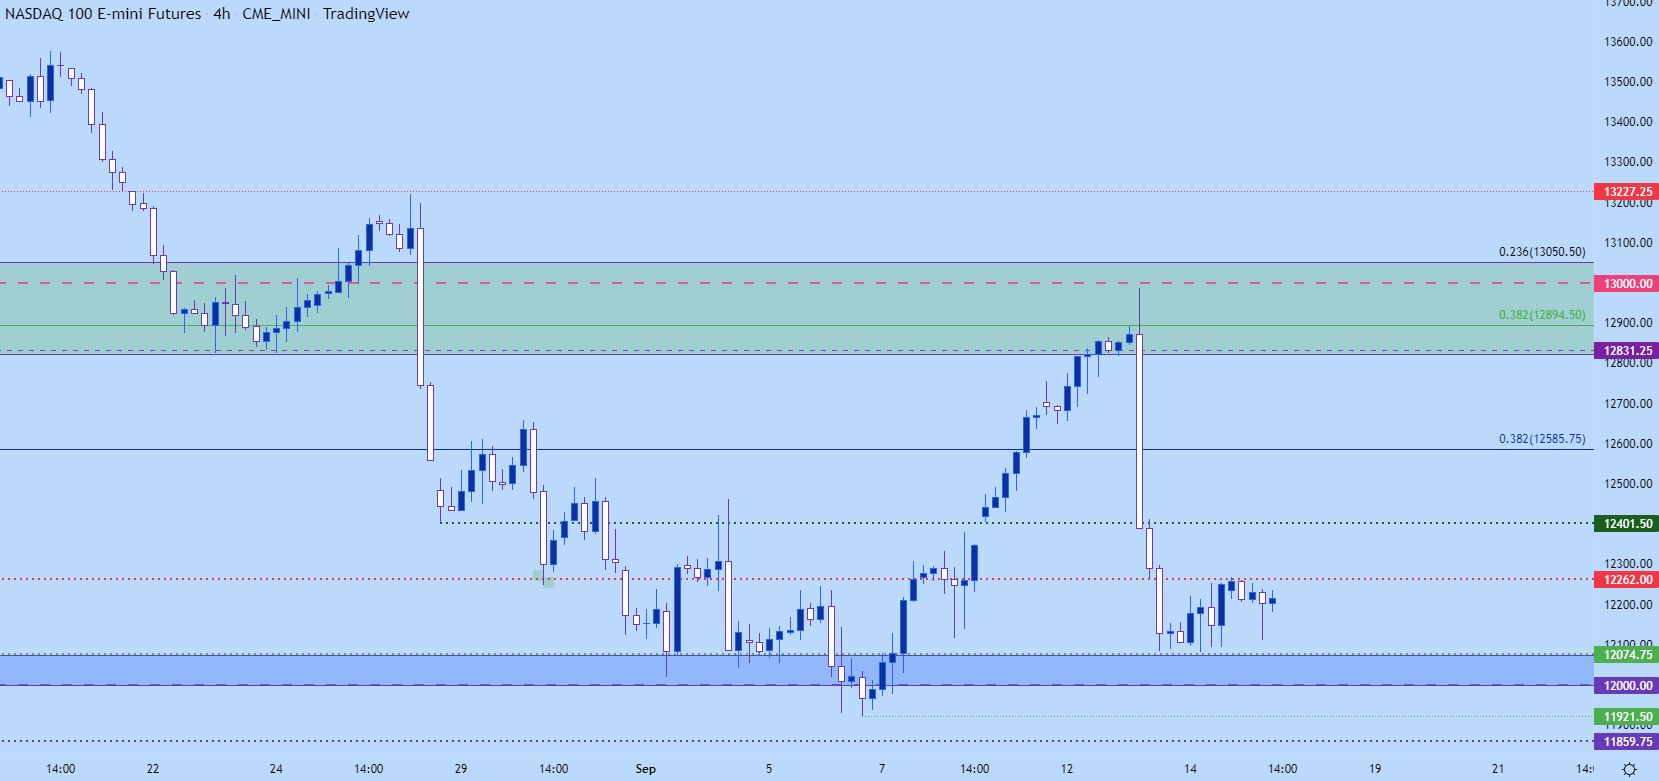
Chart prepared by James Stanley; Nasdaq 100 on Tradingview
Nasdaq Bigger Picture
This Tuesday was a pronounced sell-off and this is something still reflected in the weekly chart. This also puts a lot of emphasis on that support around 12k as a this week’s bar can still finish as a bearish engulf, which would keep the door open for bigger picture bearish continuation scenarios ahead of the FOMC next week.
Even without completion of the bearish engulf, sellers will retain the look of control until they can push a lasting break-above the August high.
Nasdaq Weekly Chart
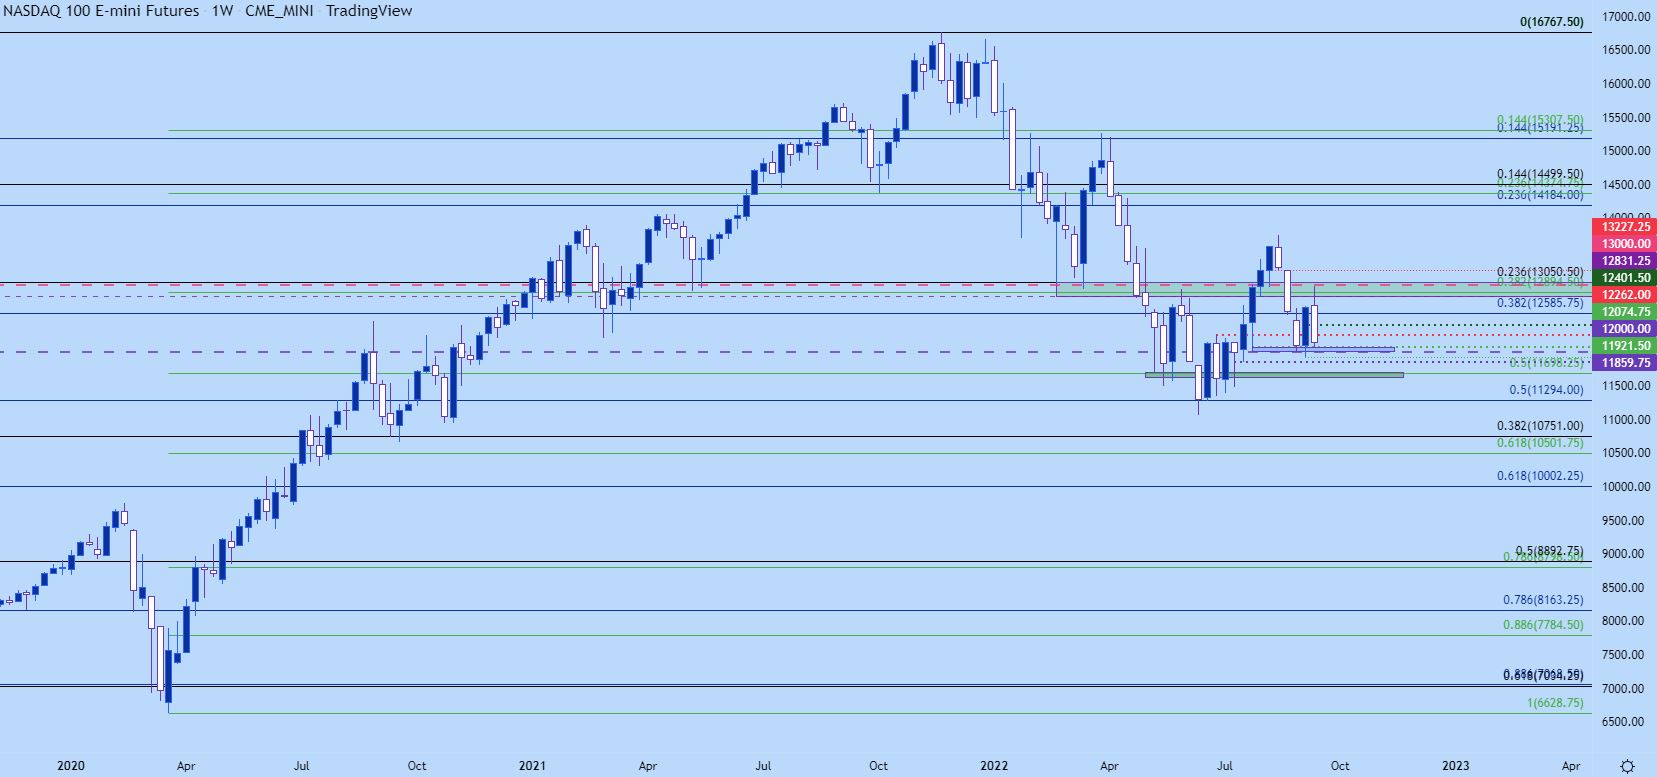
Chart prepared by James Stanley; Nasdaq 100 on Tradingview
Bitcoin & Nasdaq – the Relationship
In my opinion these are completely different markets and assets that have shared a relationship of being driven-higher by low rates and exuberant risk-taking.
And now that’s coming off as the Fed has clearly taken aim at reducing inflation. And this is not something that they can afford to miss as prior examples have shown the problem only becoming worse and worse and the worse it gets, the higher rates have to go to finally eliminate the problem.
So, while a correlation will likely be present between the two macro risk assets as the Fed is hiking rates, I’m expecting that relationship to divorce at some point, similar to what we saw in 2018 when the Fed was busy hiking rates four times. That year saw capital continue to come out of Bitcoin at a faster pace, to the point that a correlation coefficient of .89 in January fell to -.8 in August.
Recommended by James Stanley
Building Confidence in Trading
Bitcoin Weekly Chart – Correlation Coefficient to Nasdaq Futures
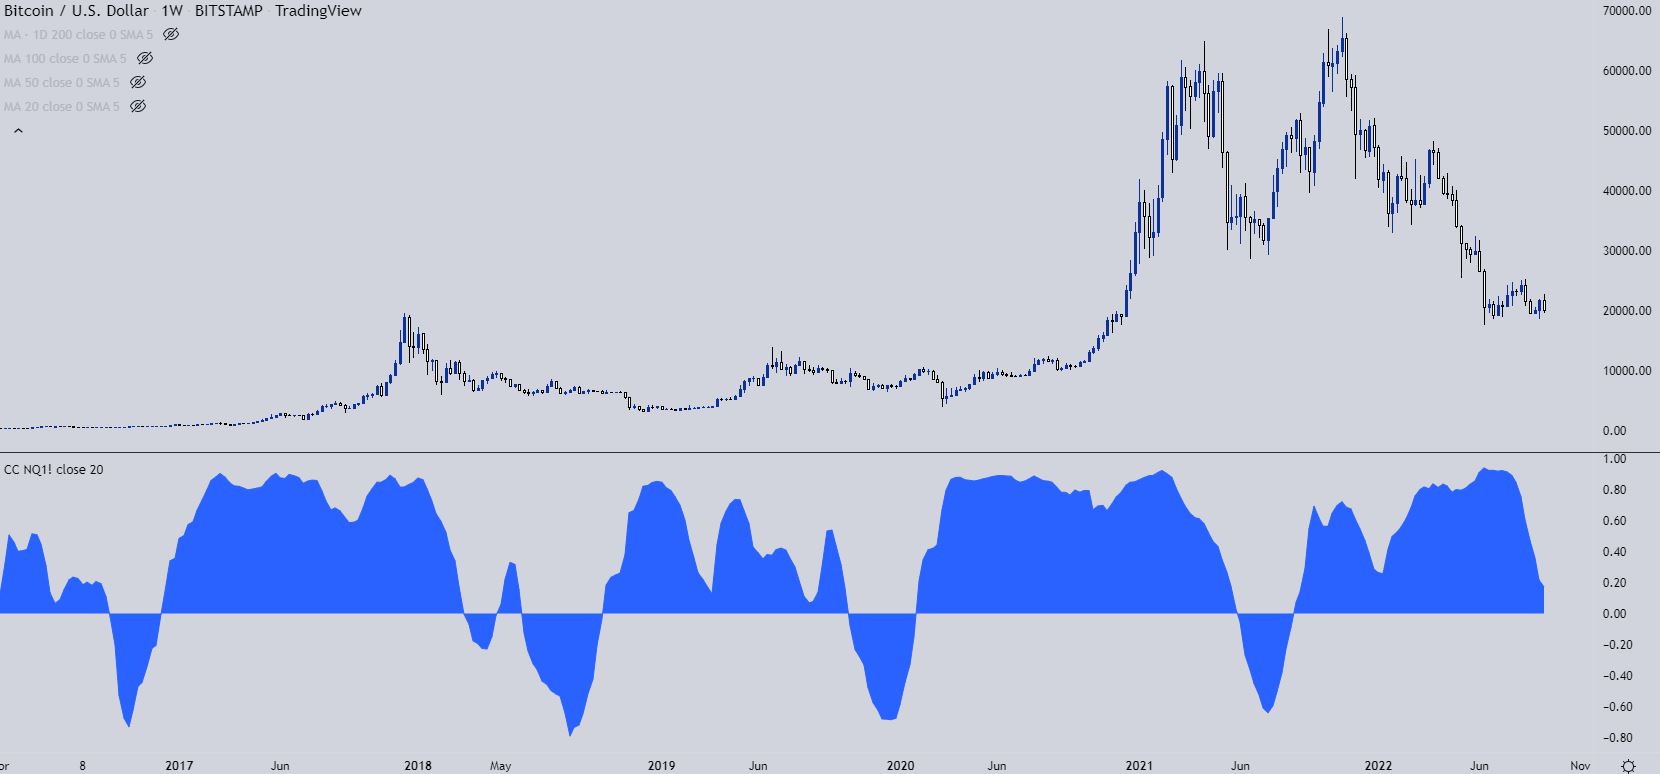
Chart prepared by James Stanley
Bitcoin and Nasdaq – Longer-Term
I’m not a fan of being on the bearish side of markets. But, I also recognize the necessity of at least trying to be objective. And I’ve been bearish on stocks for some time now and that remains the case today.
I’m similarly bearish on near-term Bitcoin prices. But, an important caveat – I’m also bullish on Bitcoin on a longer-term basis and, if anything, I see this upcoming bearish scenario as a longer-term spot of possible opportunity. And perhaps the same can be said about the Nasdaq but that picture seems a bit murkier to me. In Bitcoin, the finite nature of the asset is what makes it attractive in my eyes, and given the fact that the US Government hasn’t taken a more-forceful hand on the matter indicates, to me, that there could remain some long-term opportunity once a bottom is in-place.
Where is that bottom, though, that’s the big question? And really, I don’t know… I expect to see some heavy re-pricing in markets and the one expectation I have of bottoms is that they’ll show when very few want to be looking at anything on the long side. And given that continued display in Bitcoin (and the Nasdaq) – we aren’t there yet.
— Written by James Stanley, Senior Strategist, DailyFX.com & Head of DailyFX Education
Contact and follow James on Twitter: @JStanleyFX
Be the first to comment