

akiyoko/iStock via Getty Images
GREIF – What’s To Like?
Greif, Inc. (NYSE:GEF), a global industrial packaging product manufacturer (see image below for the range of products categories), with exposure to a diversified pool of customers across various industries, has quite a few positive qualities worth highlighting.
Investor Day Presentation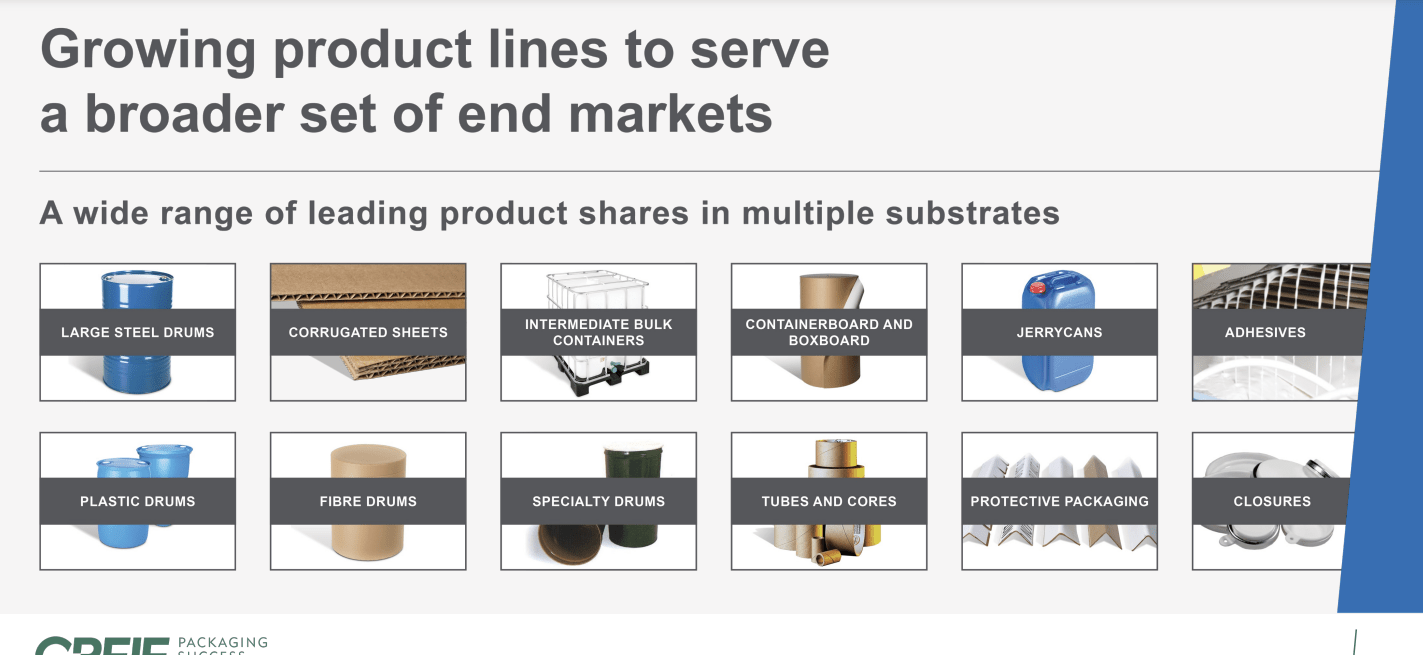
A few years back, there was the risk of the company coming across as too financially geared. Total debt which stood at $0.96bn at the end of October 2018, had surged by over 3x to cross levels of $2.84bn by the pandemic year! Back then, one was staring at fairly daunting net debt to EBITDA levels of close to 4x! However, in recent periods, the company has made a concerted effort to become less financially geared so much so that its leverage ratio has now dropped to just 1.7x, lower than its target range of 2-2.5x net debt EBITDA!
Q4 Earnings presentation
At the same time, GREF’s free cash flow levels are currently at record highs and are close to 2x its trailing FCF average of $251m.
YCharts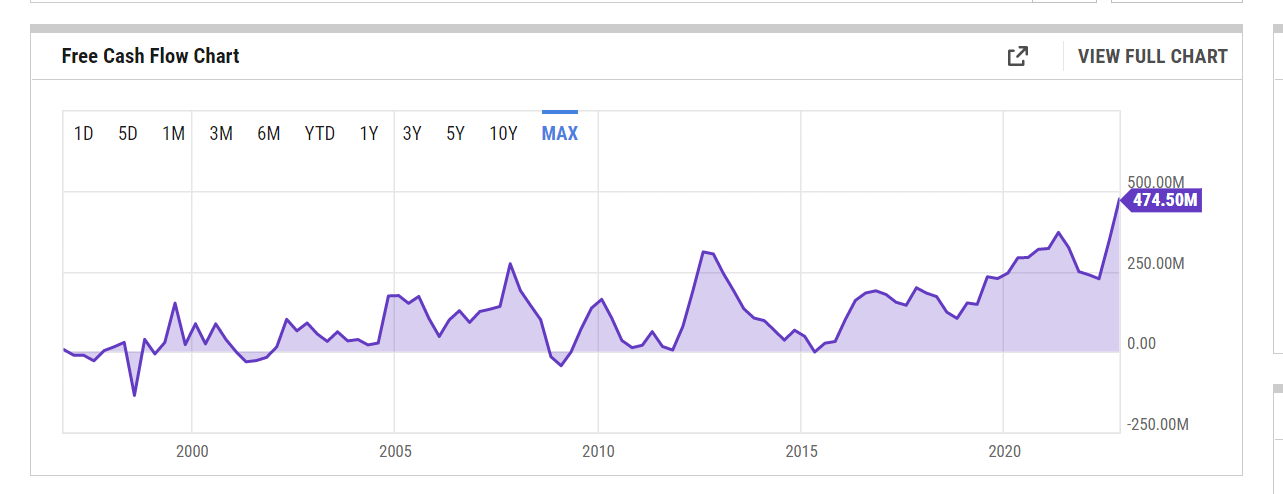
A less strenuous balance sheet and solid free cash flow generation have put Greif in a good position to indulge in share buybacks (spent $71m), a narrative that was previously not associated with this story. As things stand, the company could carry out the repurchase of another $75m worth of shares over the next 12-18 months.
GREF is also well known in the dividend community for being a reliable distributor. It has been doing so for 33 years now (typically material stocks have been doing this for only 7 years or so) and this year, it raised dividends by 9%. It is encouraging to discover a mid-cap materials stock that takes its distribution objectives seriously.
Reasons To Be Cautious
The market recognizes some of GEF’s merits and for much of this year, particularly in H2, the stock has been a fantastic source of alpha, delivering ~14% returns, even as the materials sector and the broader markets have been a source of value erosion.
YCharts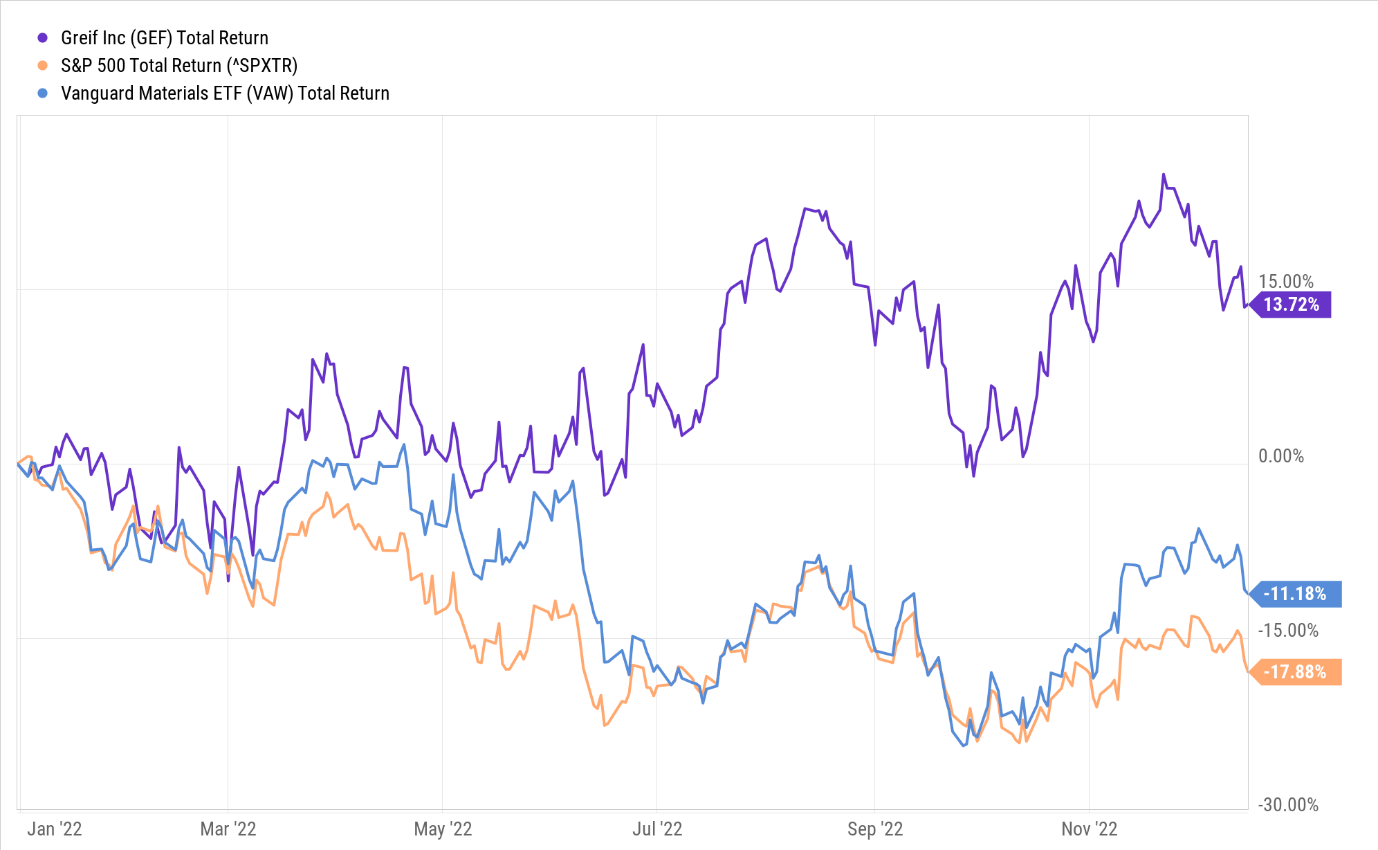
So far so good, but at this juncture, I believe investors would do well to tighten their seatbelts. Here’s why-
Risk-Reward, Not Ideal
If one looks at the price imprints on GEF’s weekly chart, we can see that from the pandemic lows in March 2020 till November last year, the stock had been trending up in the shape of an ascending channel. However, since then, upward momentum has given way to some choppiness between the 56-74 regions. Also note that once the price fell out of the channel, it was never quite able to reclaim that old channel. This would suggest that the prospects for upward momentum don’t look great. The cautiousness is also substantiated by a likely double-top pattern around the $73-74 levels.
Investing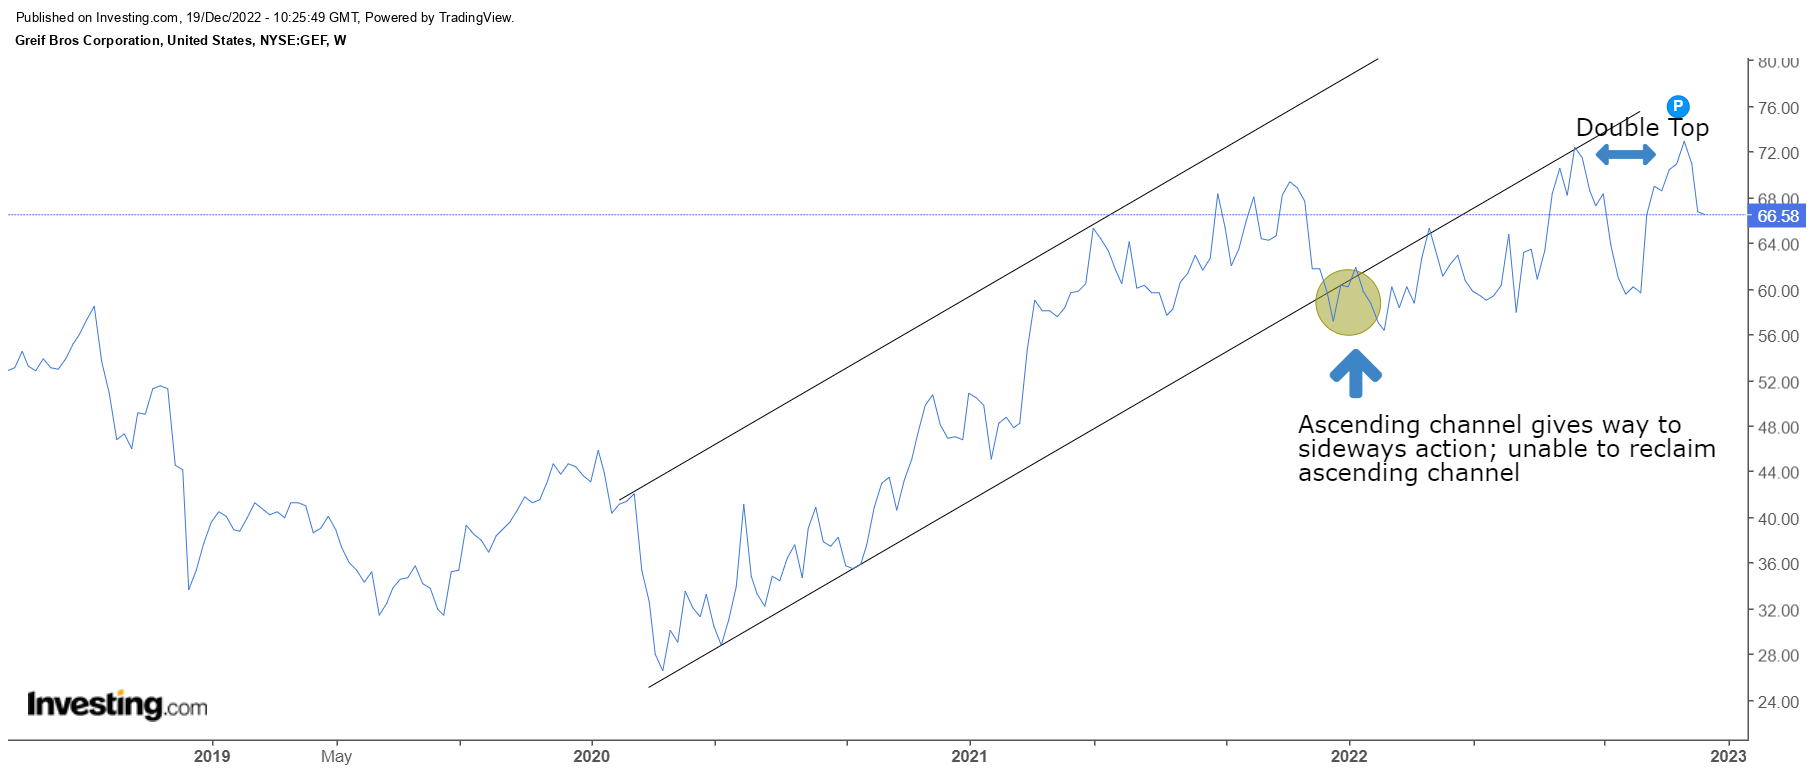
I touched upon Greif’s dividend credentials earlier and I recognize that some investors pursue this stock largely for its distribution facet. However, do consider that if you get in at this price point, you’ll only get a yield of 3% which is a good 70bps lower than the stock’s 5-year average of 3.7%.
If we expand the lens to the larger time frame, ie. the monthly chart, it’s rather evident that this would be a very risky price point to consider getting in. Over the last 16 odd years, GEF has oscillated within a certain range with crucial pivot points around the $25 and $70 levels (note the price zones highlighted in turquoise). The stock may or may not break out of this range, but I don’t believe it is too sensible to take a punt at these crucial pivot points, particularly when the near-term outlook doesn’t look too resplendent.
Investing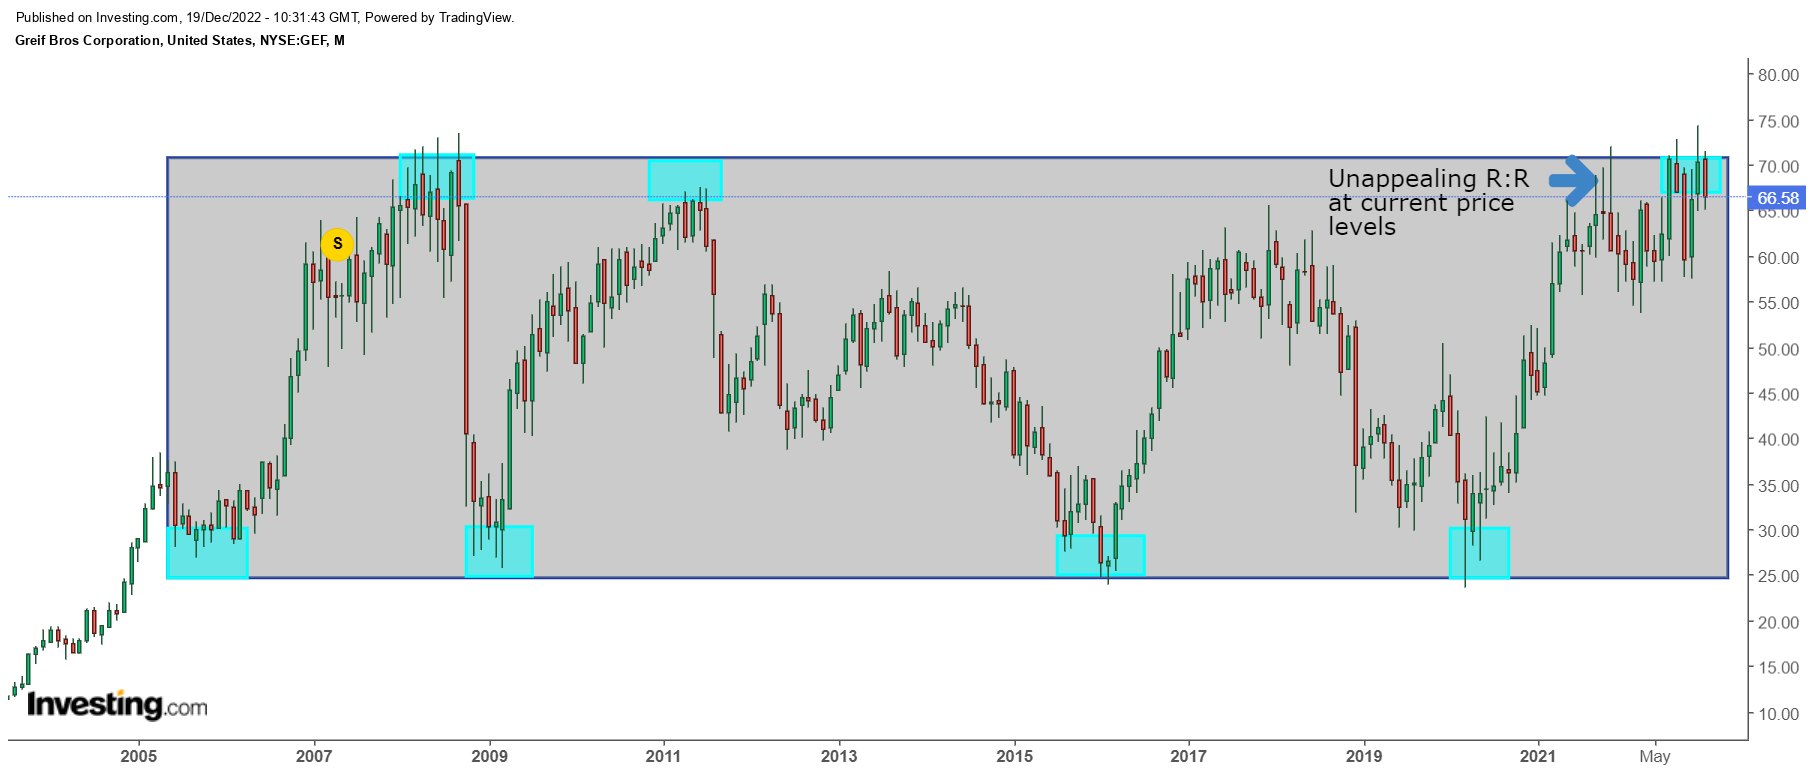
Besides, if you’re someone who pays attention to the sell-side analyst positioning, it’s fair to say that this is as good as it gets. The average price target currently works out to only$67.67, implying little to no upside from current levels. In addition to that, only 1 out of the 6 Wall-street analysts who cover the stock have a ‘Buy’ rating on the stock (50% of these analysts have either a ‘Sell’ or an ‘Underperform’ rating).
Near – Term Outlook Is Not Great
GEF’s largest division- Global Industrial Packaging (GIP), which contributes ~58% of group sales has been witnessing a challenging period for a while now, and management confirmed this is likely to persist well into H1-23. Demand in the GIP division has dropped across all regions (In Q4 sales were down by 13%), with North America in particular, impacted by weak domestic spending and slowing manufacturing activity.
Besides demand pressure, it also doesn’t help that steel prices have collapsed in such a rapid manner particularly in North America (where steel prices had come off by 43% from June to November). Because Greif has a lot of high-cost steel inventory, low-price realizations in the end markets for items such as steel drums weigh heavily on margins. Just for some context, in Q4, Adjusted EBITDA was down by 21% whilst margins were down by 110bps. Fitch now believes that reduced steel consumption in H2-22 will likely leave a lingering effect on the supply-demand dynamics in 2023, so expect this price lag for GEF to continue for the foreseeable future.
Expensive Valuations
Weakness in the GIP division, as well as some loss of EBITDA from certain divestitures, will reflect adversely on next year’s EBITDA forecasts. Management guided for a broad EBITDA range of$820m-$906m for FY23, and the sell-side analyst community has chosen to be conservative, with an average EBITDA figure ($828m) which is closer to the lower end of that band. Note that this would imply an annual EBITDA decline of ~10%. At that figure, you’re also looking at a fairly high forward EV/EBTIDA multiple of 6.9x, which is closer to the upper end of the stock’s 5-year EV/EBITDA range of 5.86 – 7.41x.
YCharts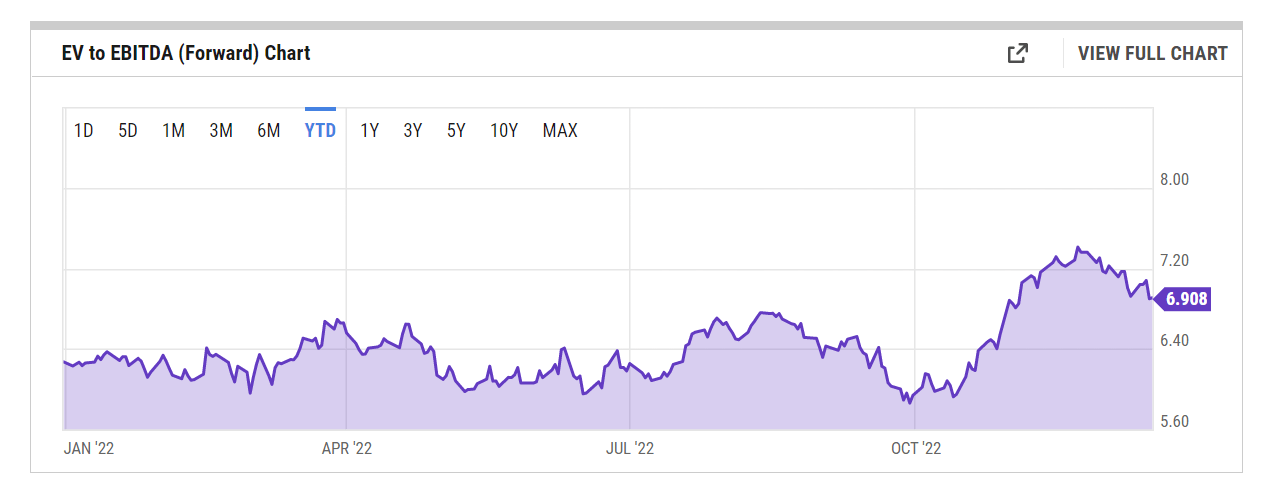
On the EPS front, the pressure is likely to be more intense with a likely annual decline of 13% (analyst consensus of $6.33). This would translate to a pretty steep forward P/E of 10.52x, around 28% higher than the 5-year average of 8.24x.
YCharts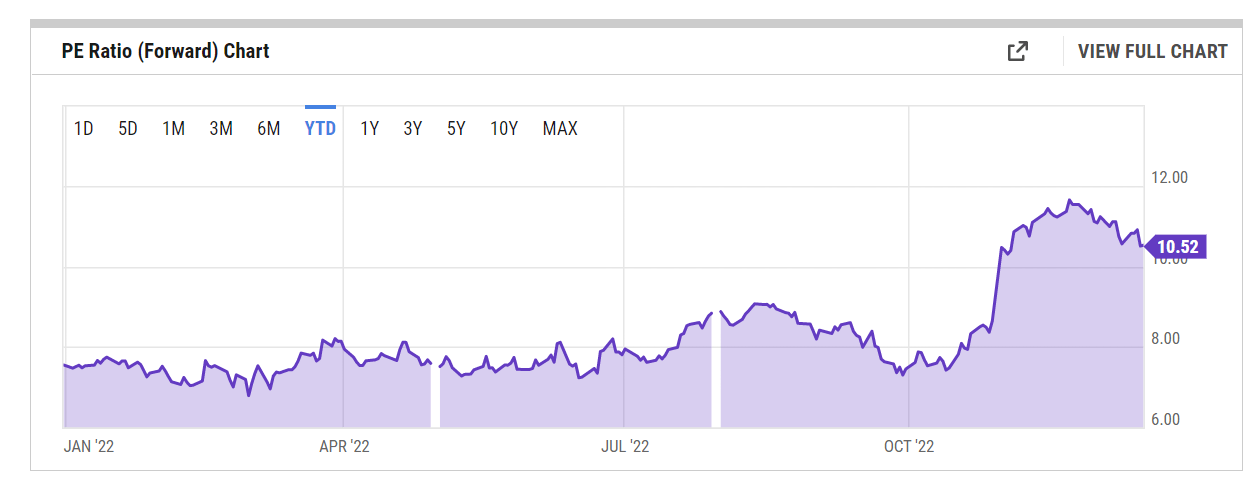
Free cash flow generation too is unlikely to be as strong as FY22, with the company now guiding for an FY23 adjusted FCF range of $410m-$460m. At the mid-point of that range, you’re looking at a mid-teens reduction in FCF, relative to last year’s figure of over $500m. This should see the current double-digit FCF yield drop back to the traditional range of single digits.
YCharts
Be the first to comment