

amenic181
In this article, we will review stock market valuation, the bond market, commodities, stock charts, market sentiment, and other factors to determine if we are at the cusp of a new bull market for the S&P 500 Index (SP500).
Valuation
The valuation of the stock market is still above the average price to earning going back 70 years; although, price to earnings have dropped from peak valuation.
Historical Price to Earnings S&P 500 (Current Market Valuation )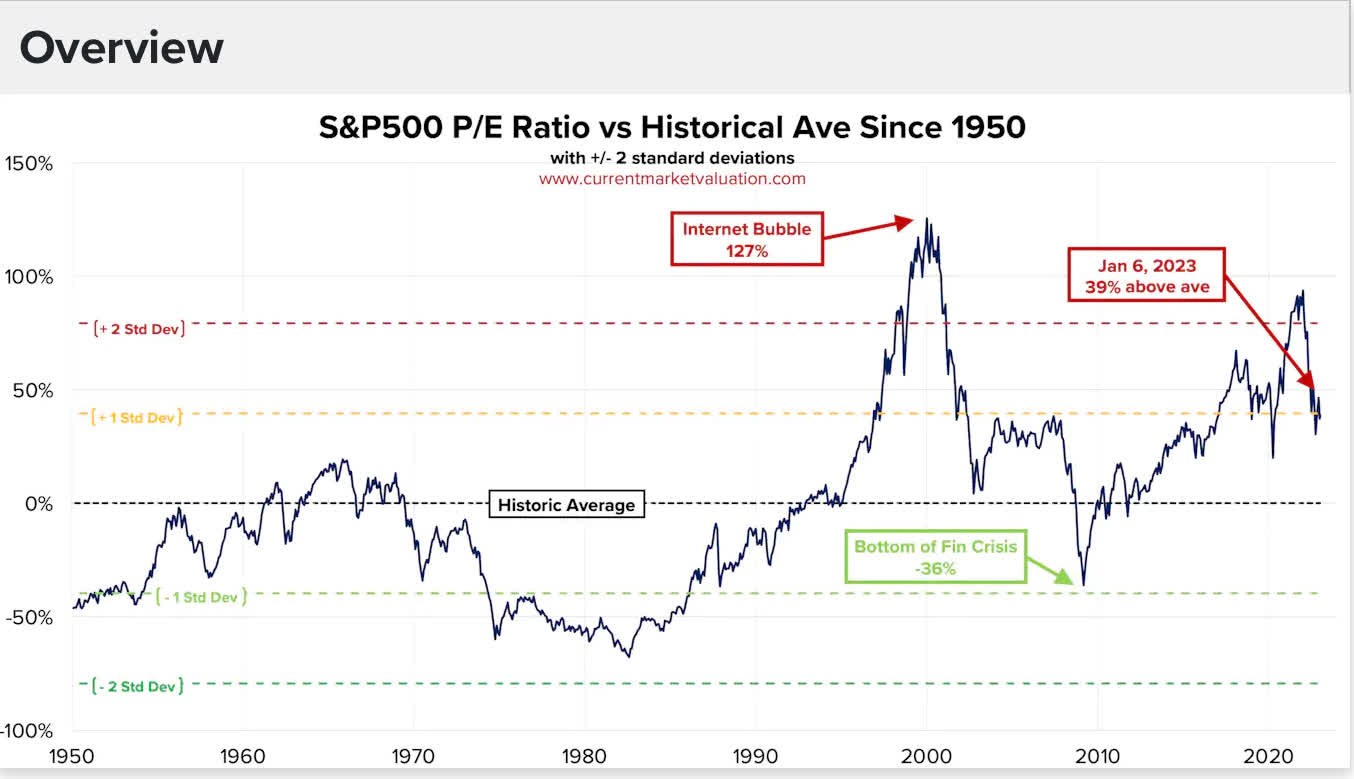
Forward Price to Earnings for S&P large cap stocks are above 17, which has historically not been the bottom in terms of valuation if one considers future growth prospects and interest rates.
Forward PE for S&P 500 (Yardeni Research )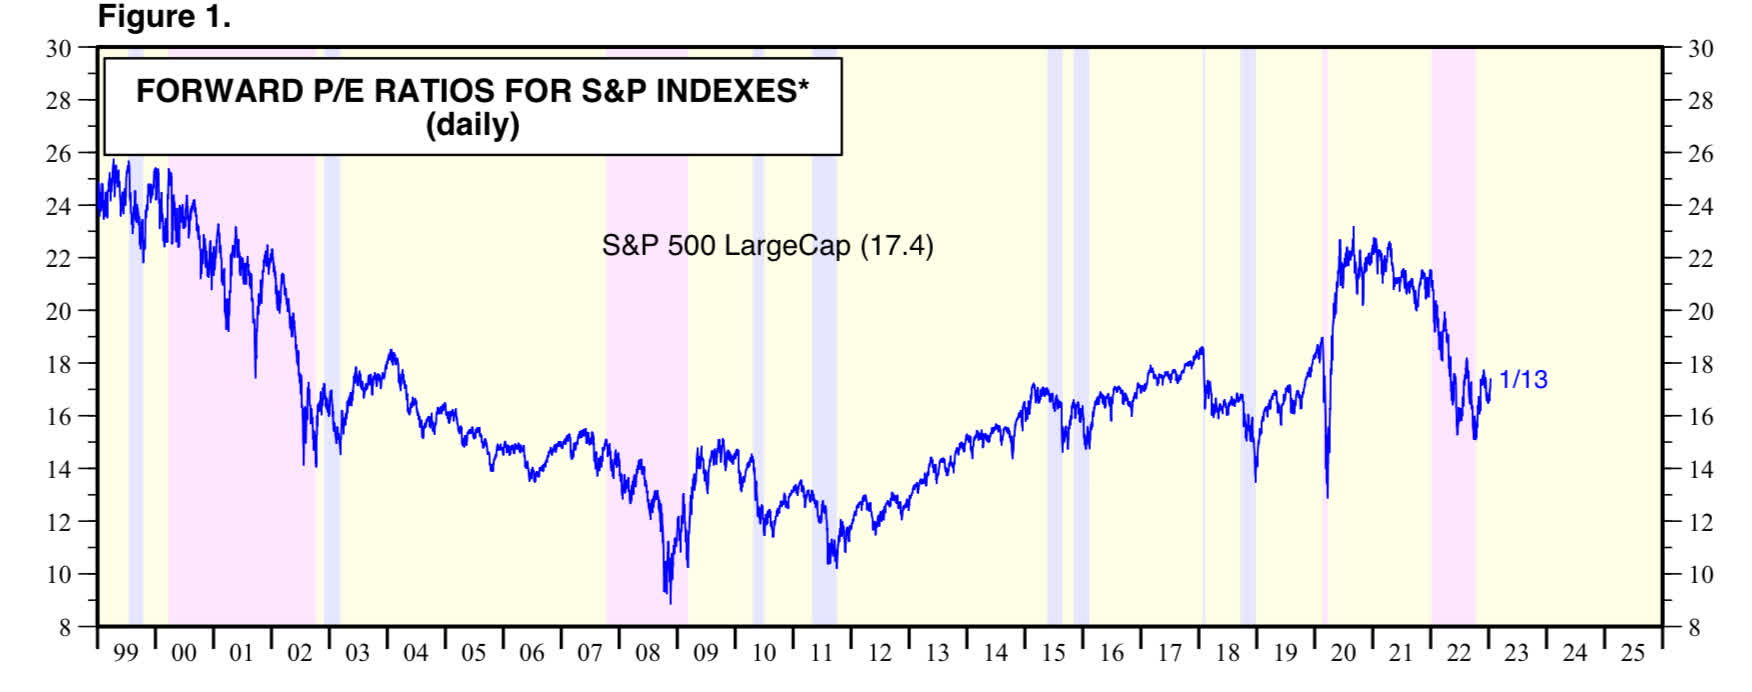
The forward P/E for S&P 400 Mid Cap is below 14, which is an attractive valuation going back over two decades.
Forward PE for S&P 400 Mid Cap (Yardeni Research )
Forward price to earnings for S&P Small Cap stocks are also at an attractive level of 13, which has been closer to the bottom going back into the late 90s.
Forward PE for S&P Small Cap (Yardeni Research )
Forward P/E for S&P Growth is below 18, while P/E for S&P Value is at 16. We are getting to a point where growth stock might become reasonably priced. The value stocks are getting close to being fully priced given future growth in earnings for value stocks.
Forward PE for S&P Growth and Value (Yardeni Research )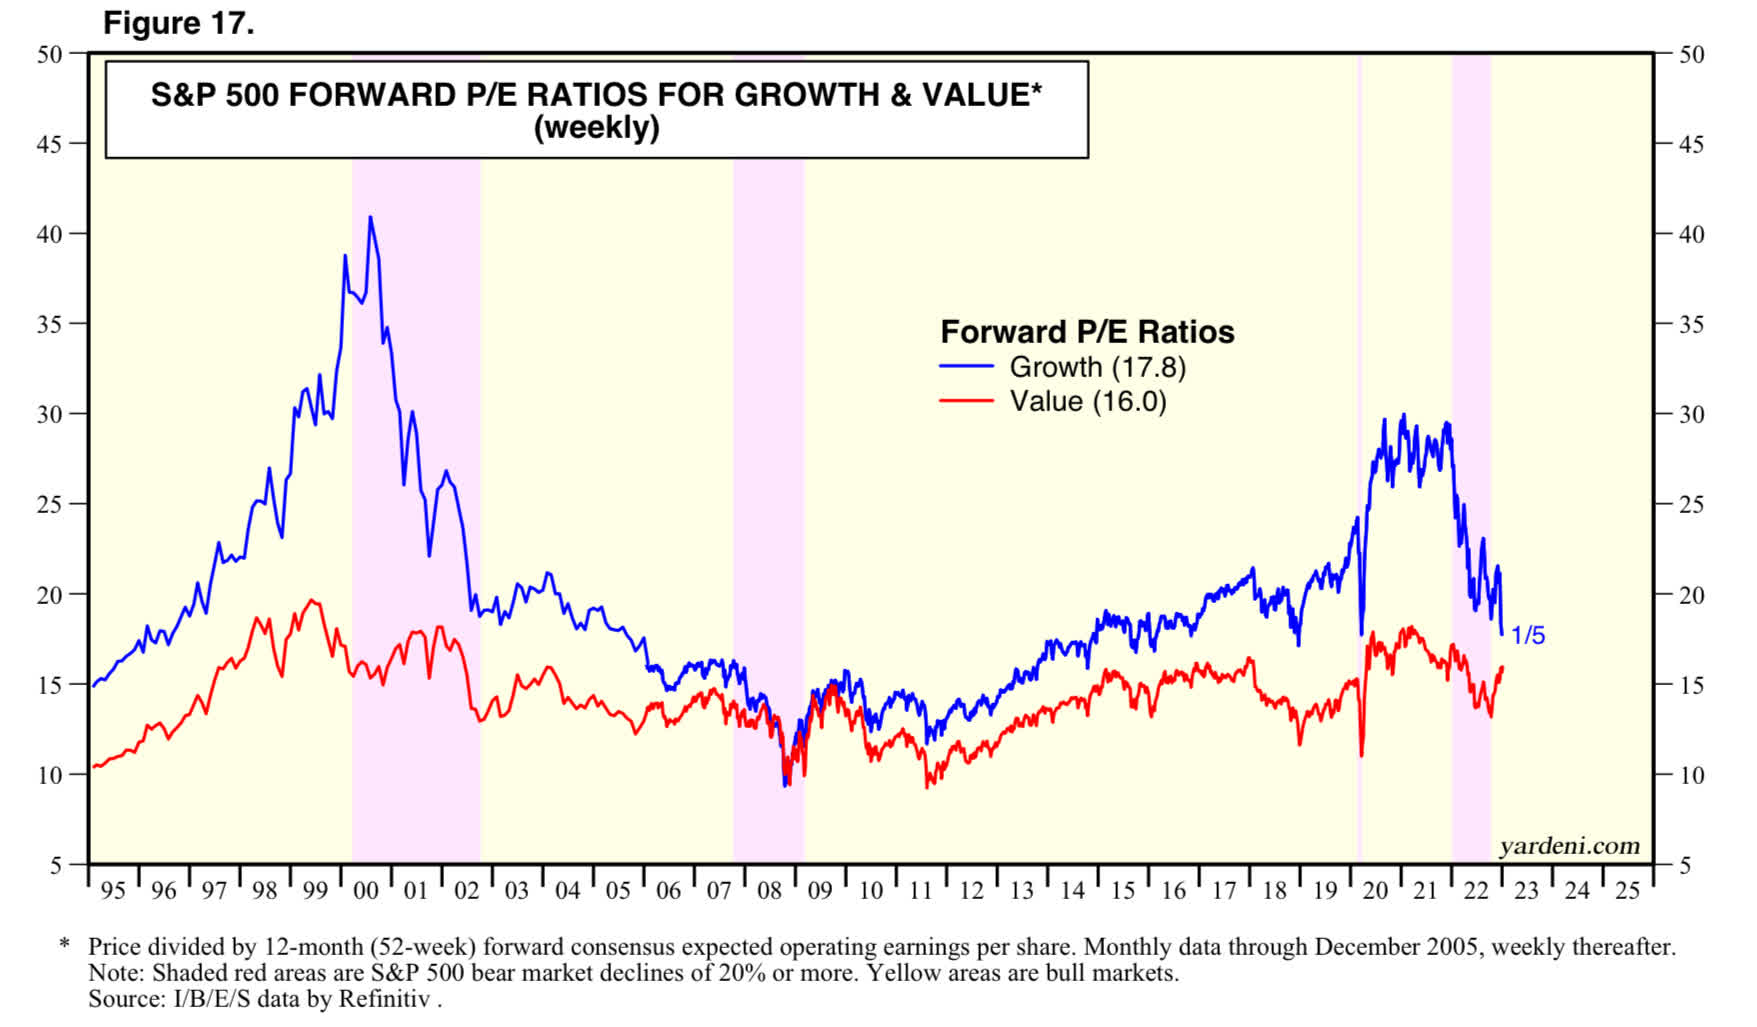
Bond Market
The bond market is always important, as it affects corporate earnings and valuation since investments of any kind are based off the risk-free rate from government securities like the U.S. treasuries.
The 10 year is in an uptrend until it closes below 3.25%. A year ago, the 10 year treasury was at 1.8%.
US 10 year (Author )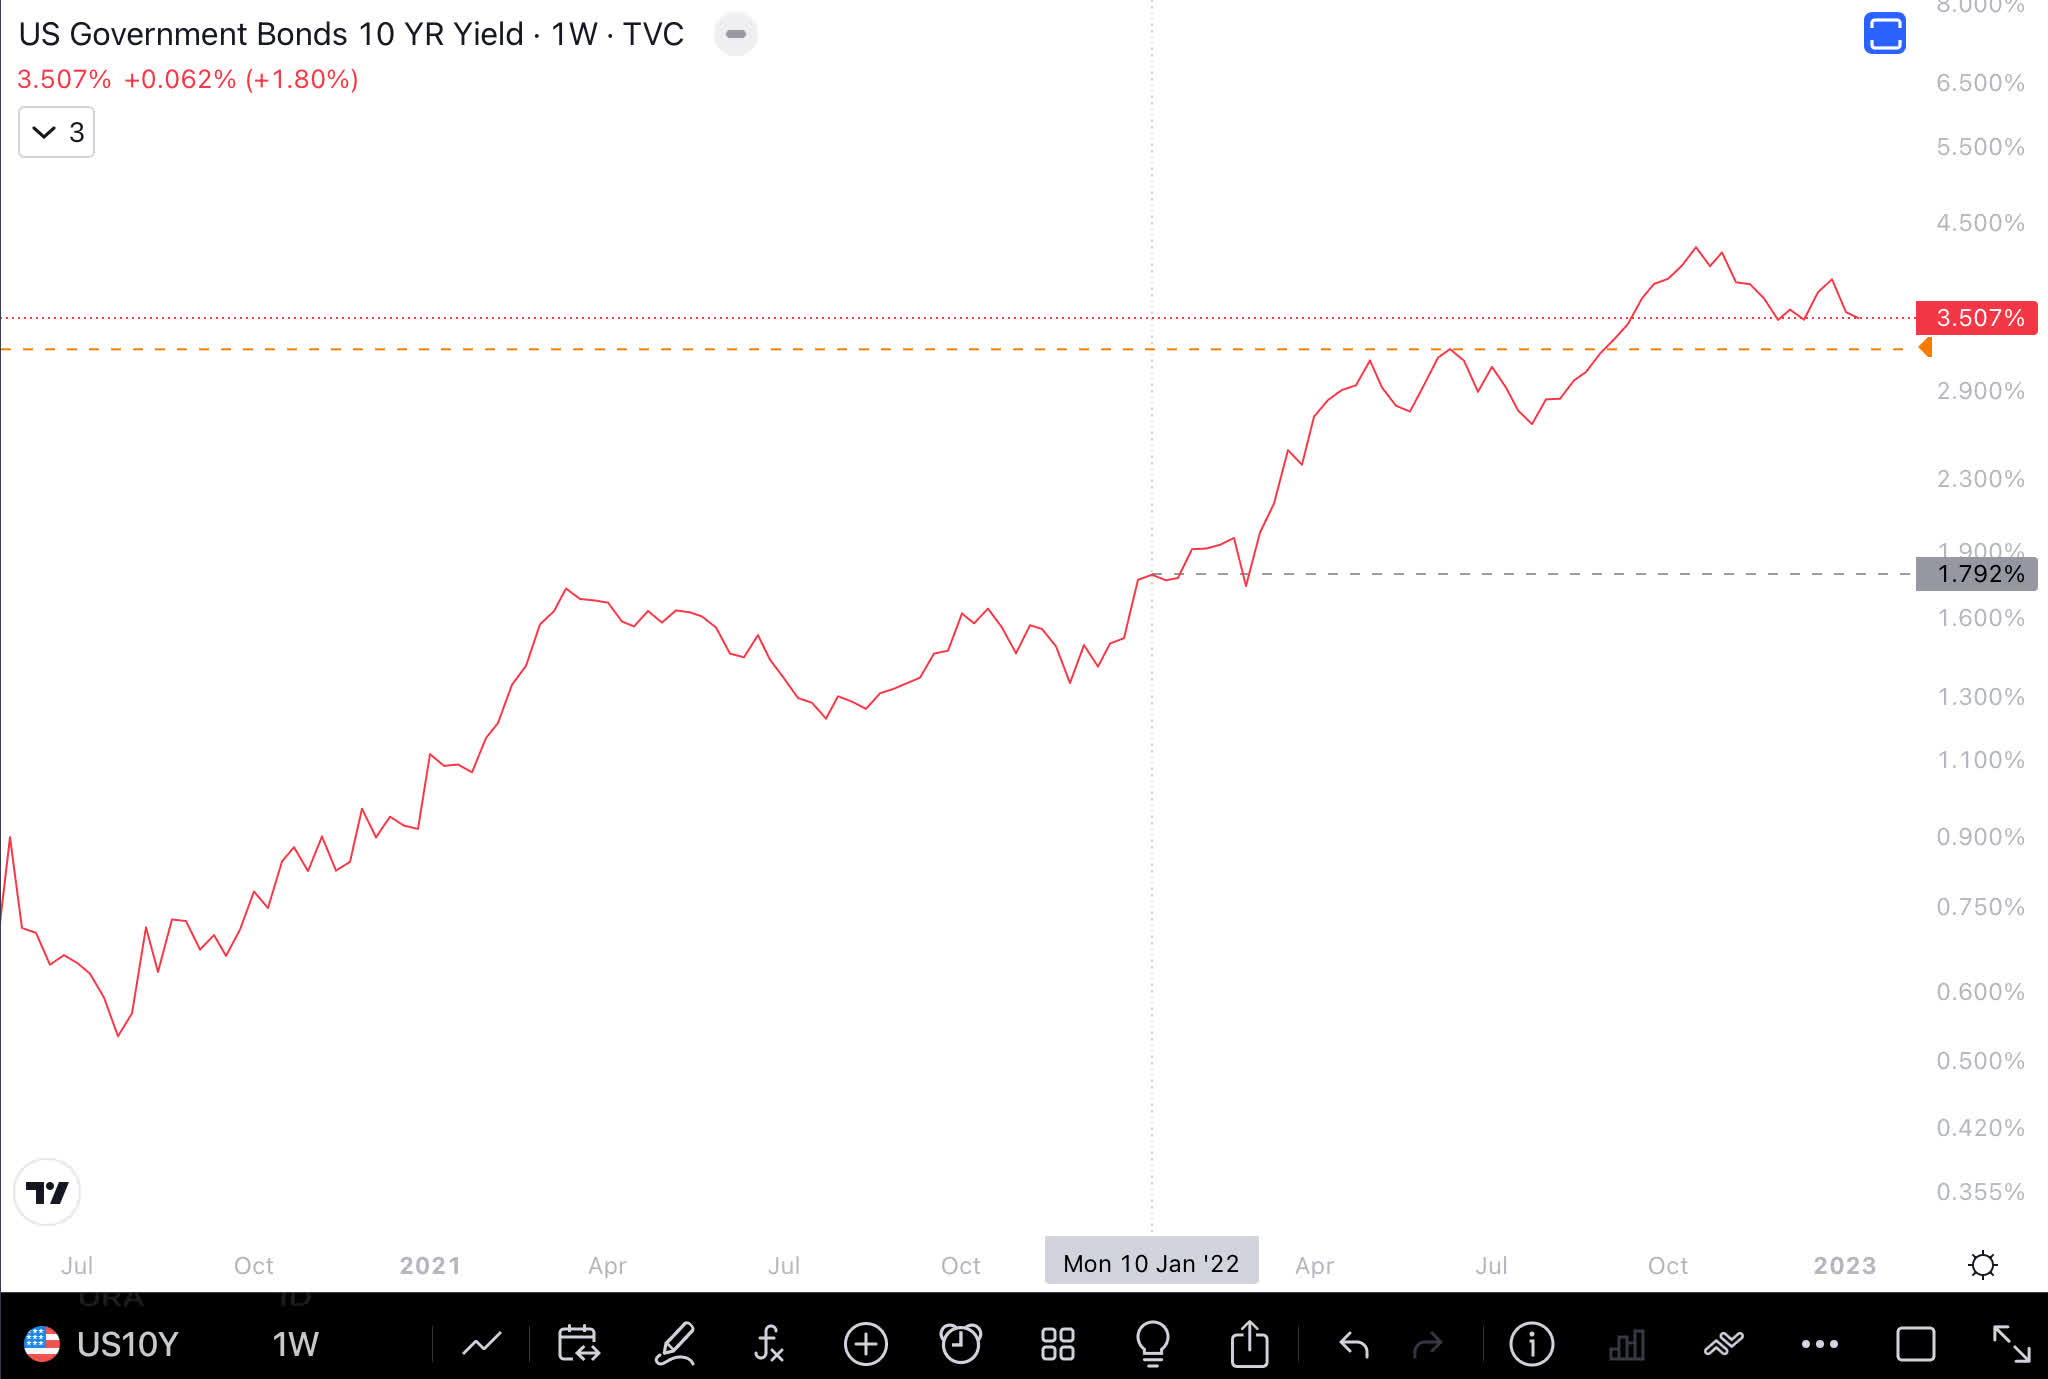
The 2 year is still in an uptrend until it closes below 3.5%. A year ago, the 10 year treasury was below 1%.
US 2 year bond (Author )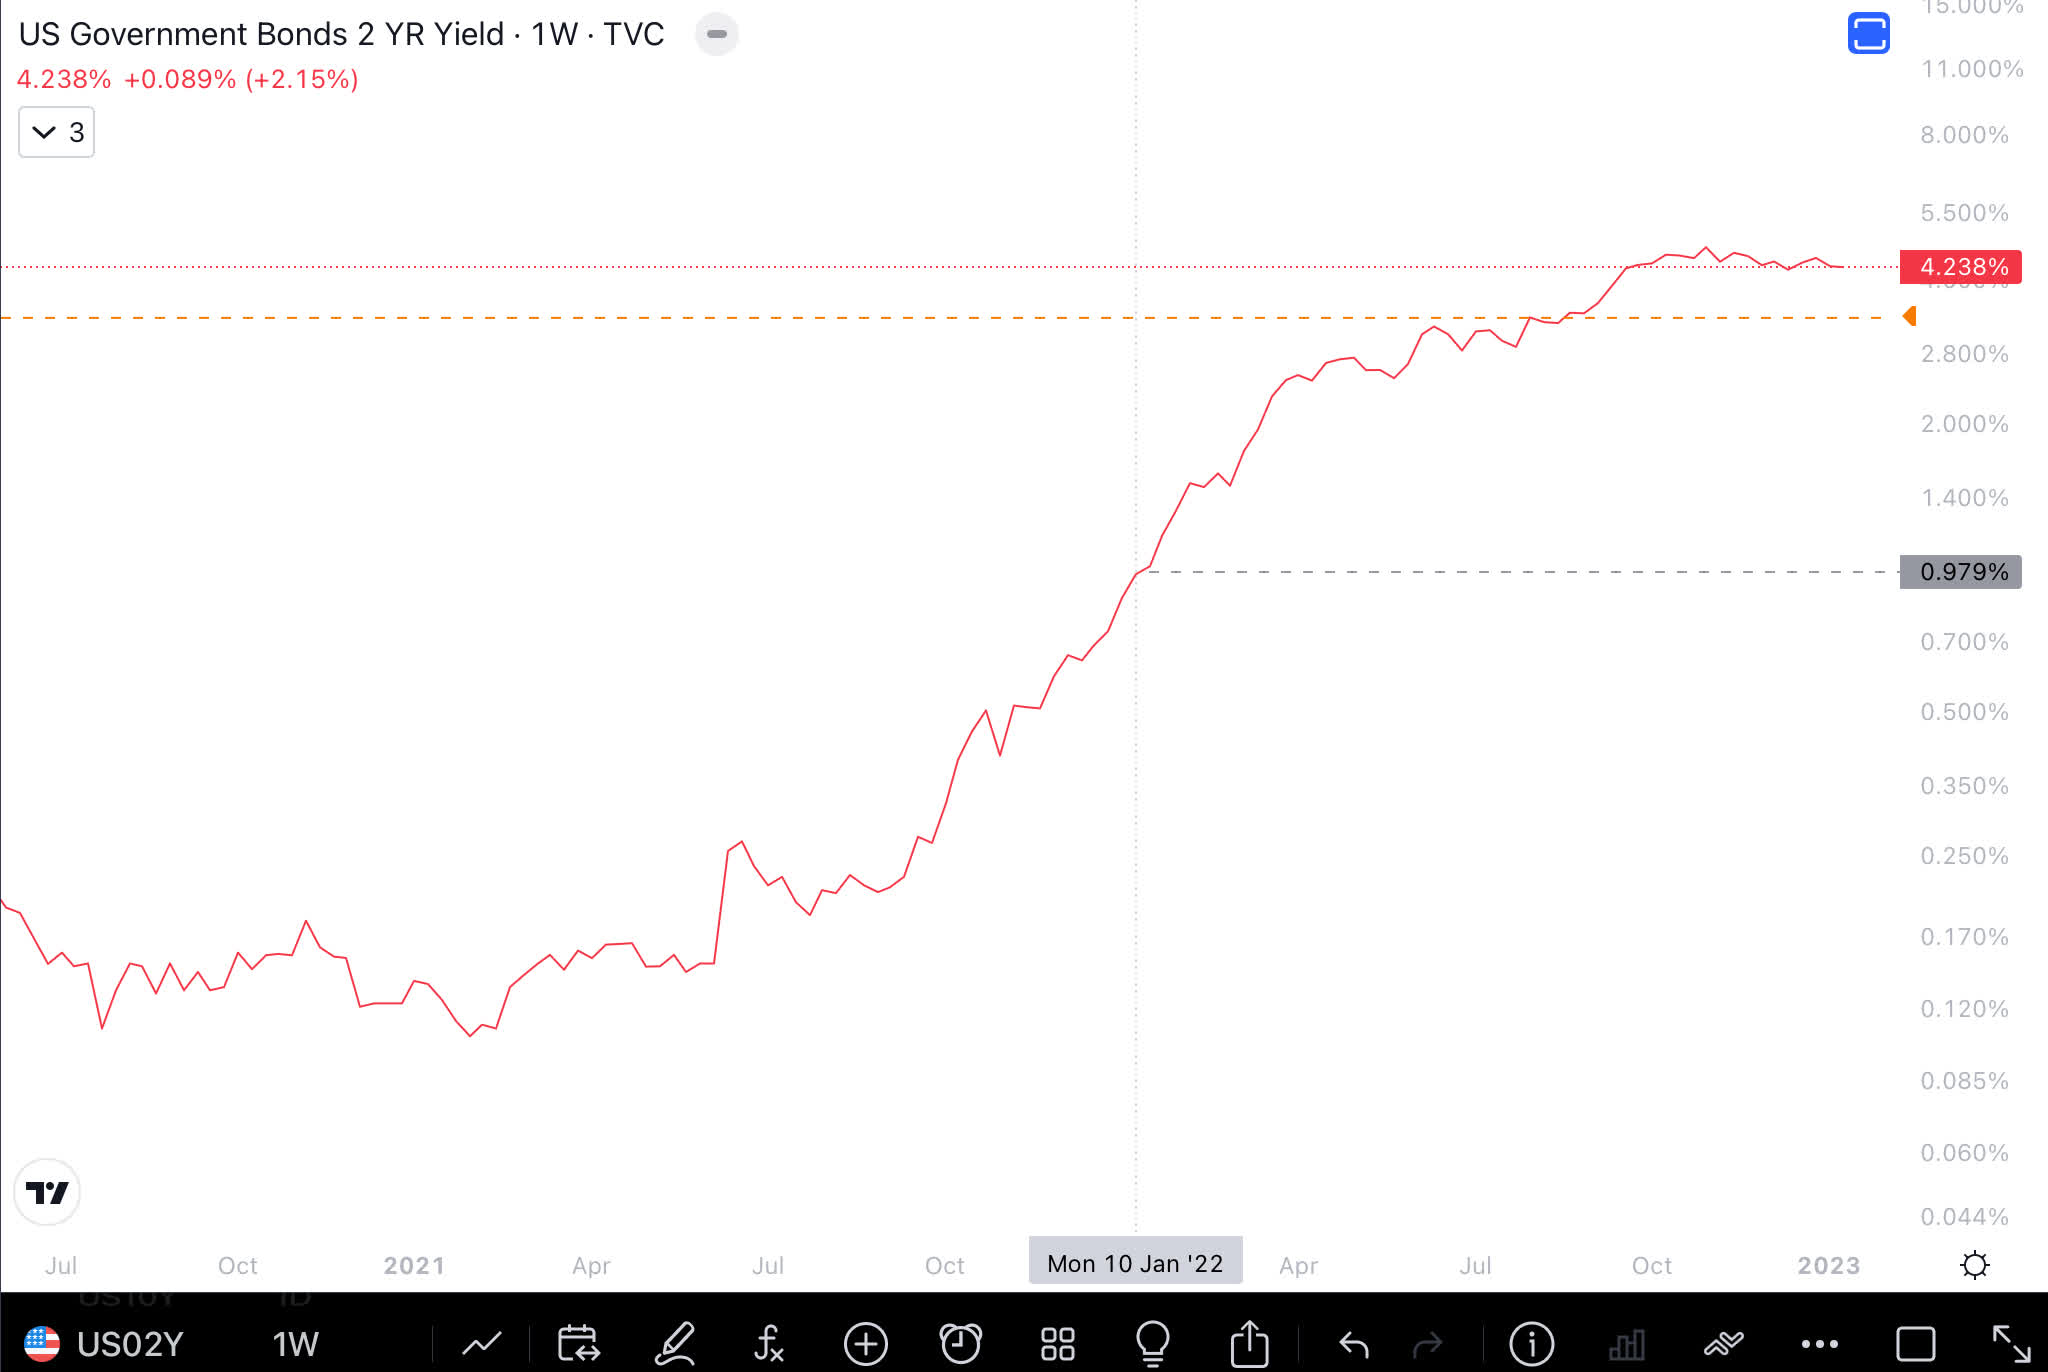
Inverted Yield Curve
10 year minus 2 year has been inverted for months. The bond market is signaling to the Federal Reserve that future economic growth is likely to be slower.
U.S. 10 year minus 2 year (St Louis Federal Reserve)
The U.S. 10 year minus 3 month has been inverted for more than a few weeks, and that has been concerning in the past when combined with inversion of 10 year and 2 year.
U.S. 10 year minus 3 month (St Louis Federal Reserve)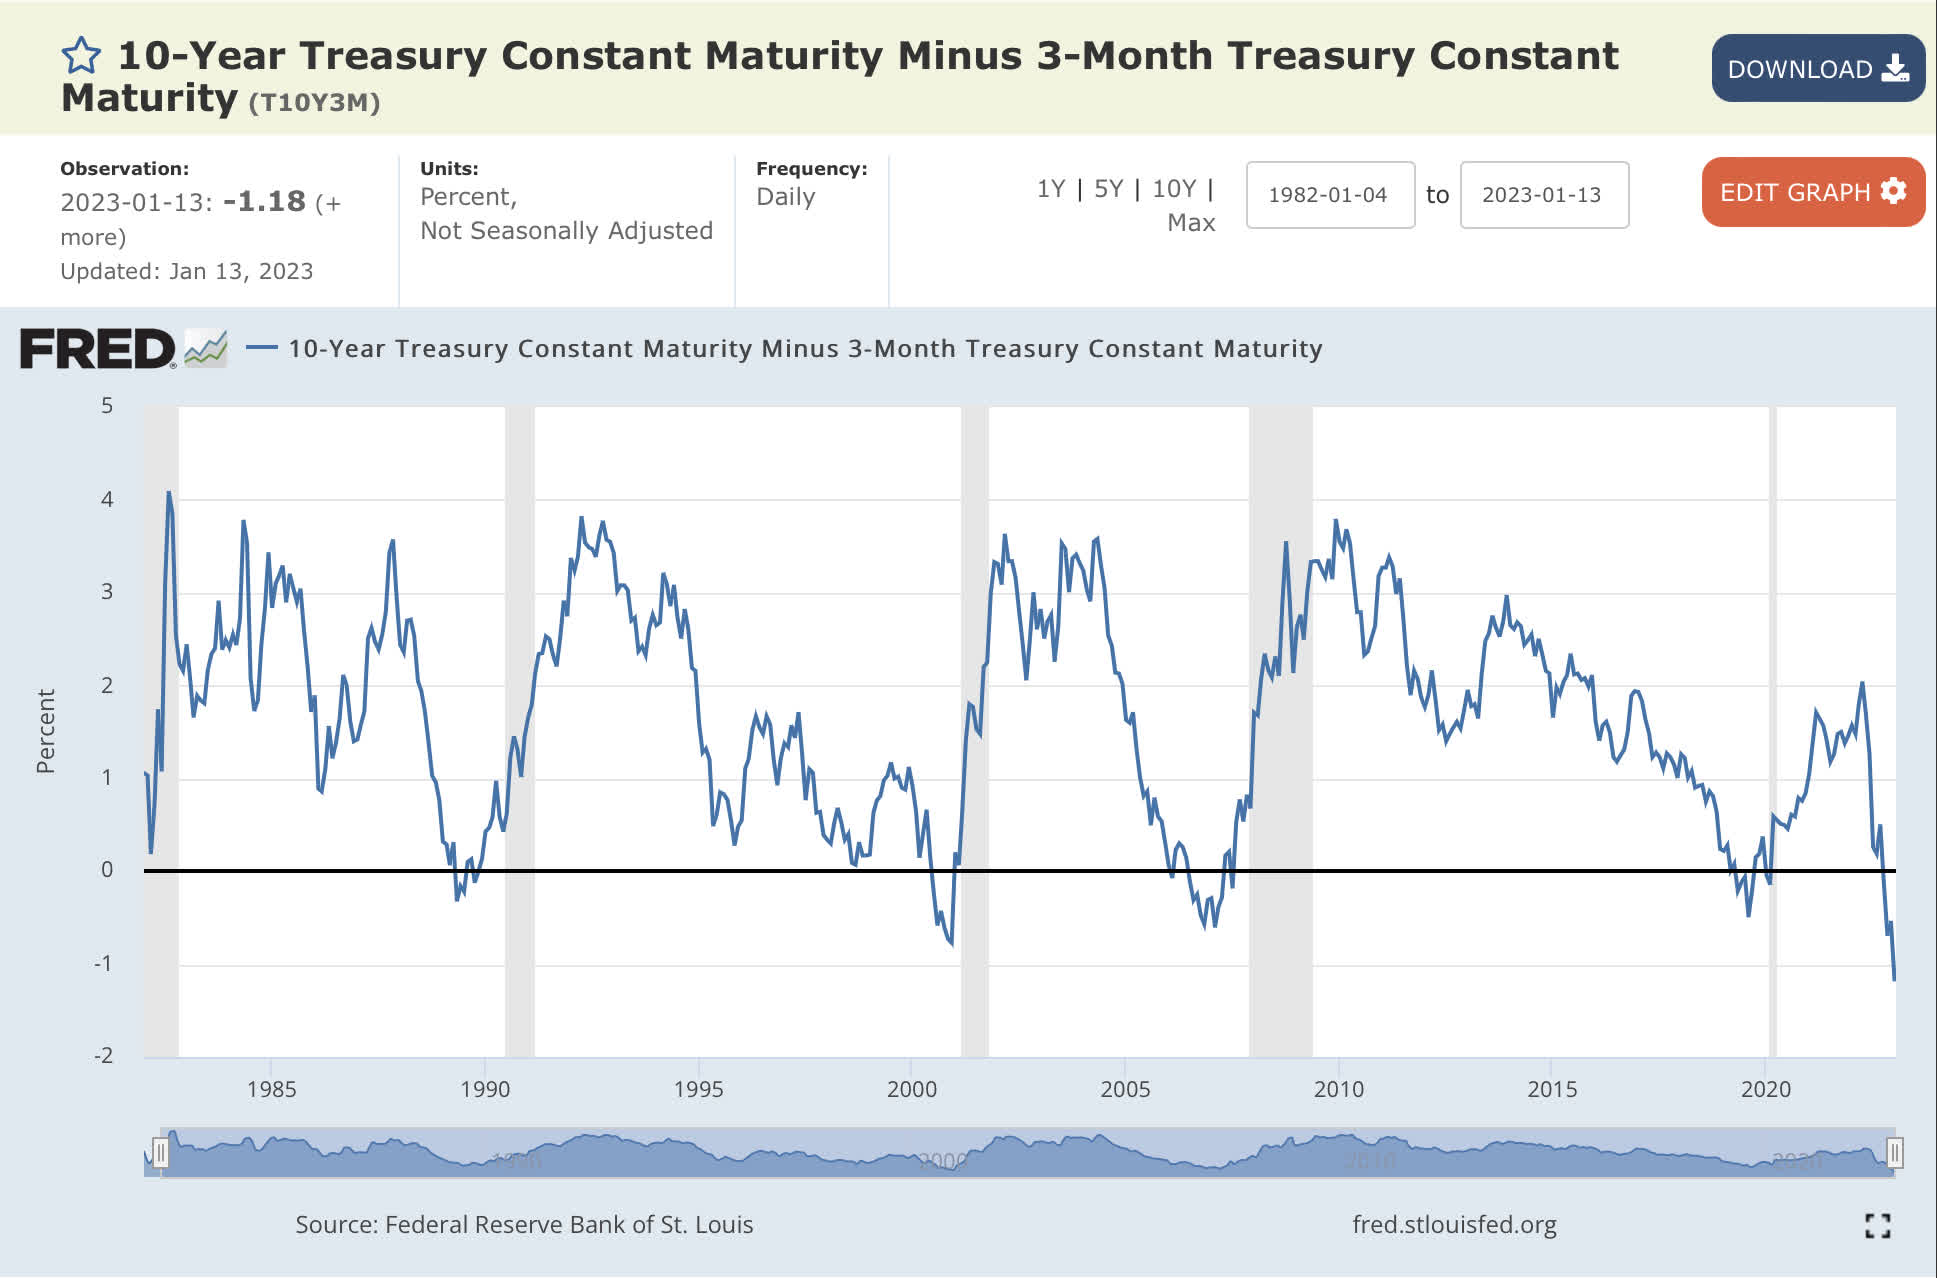
Economist Campbell Harvey has shown in his dissertation that inverted yield curve has a link to economic activity, and he has correctly identified coming recessions. He recently signaled that the inflation-adjusted 10 year minus 3 month is far from inverting, and so he does not think the U.S. economy is necessarily going to have an economic slowdown.
Inflation adjusted 10 year & 3 month rates (BLS)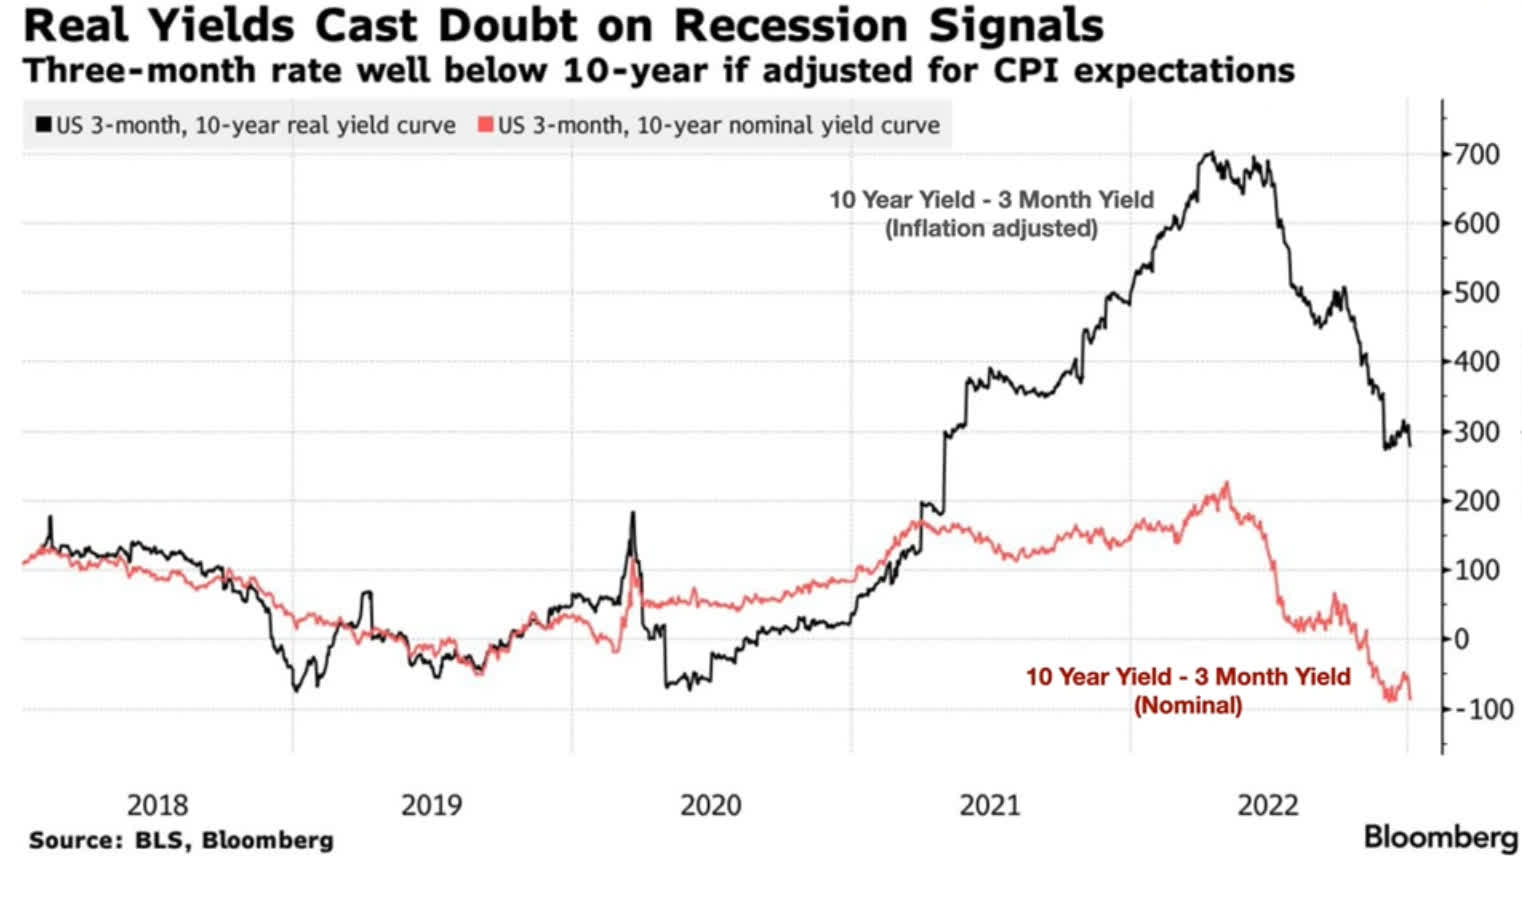
Corporate
High Yield Corporate (HYG) has bounced from lows of October 2022, which means risk-taking might be coming back if HYG stays above 77.
High Yield Chart (Author )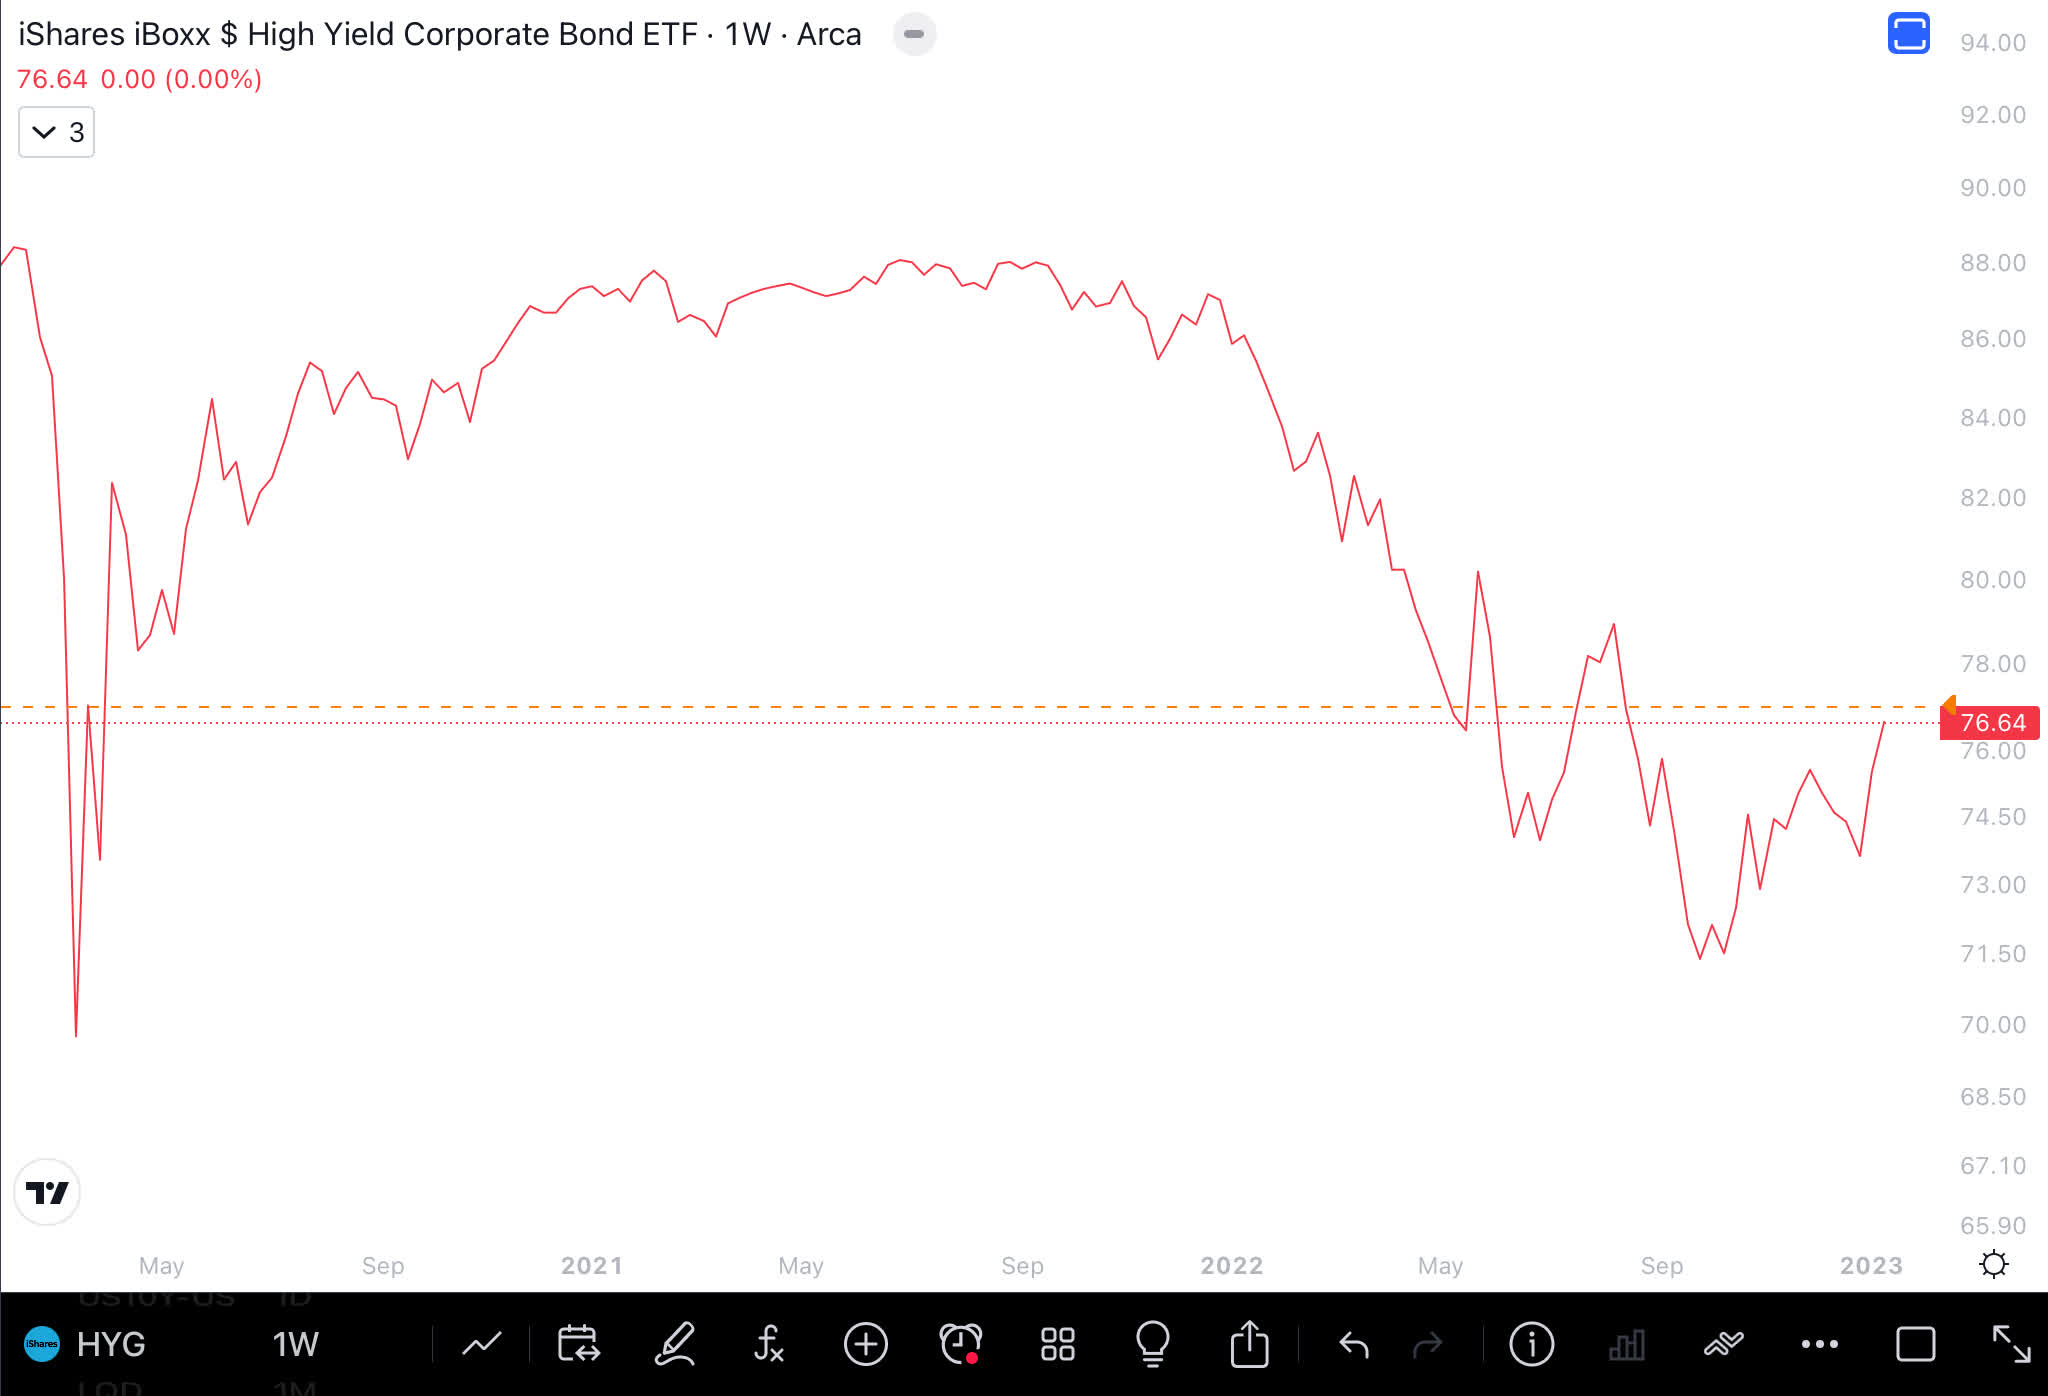
Investment Grade Corporate has also bounced from October 2022 lows; however, we need to see consistently higher levels in the coming months.
Investment Grade Chart (Author )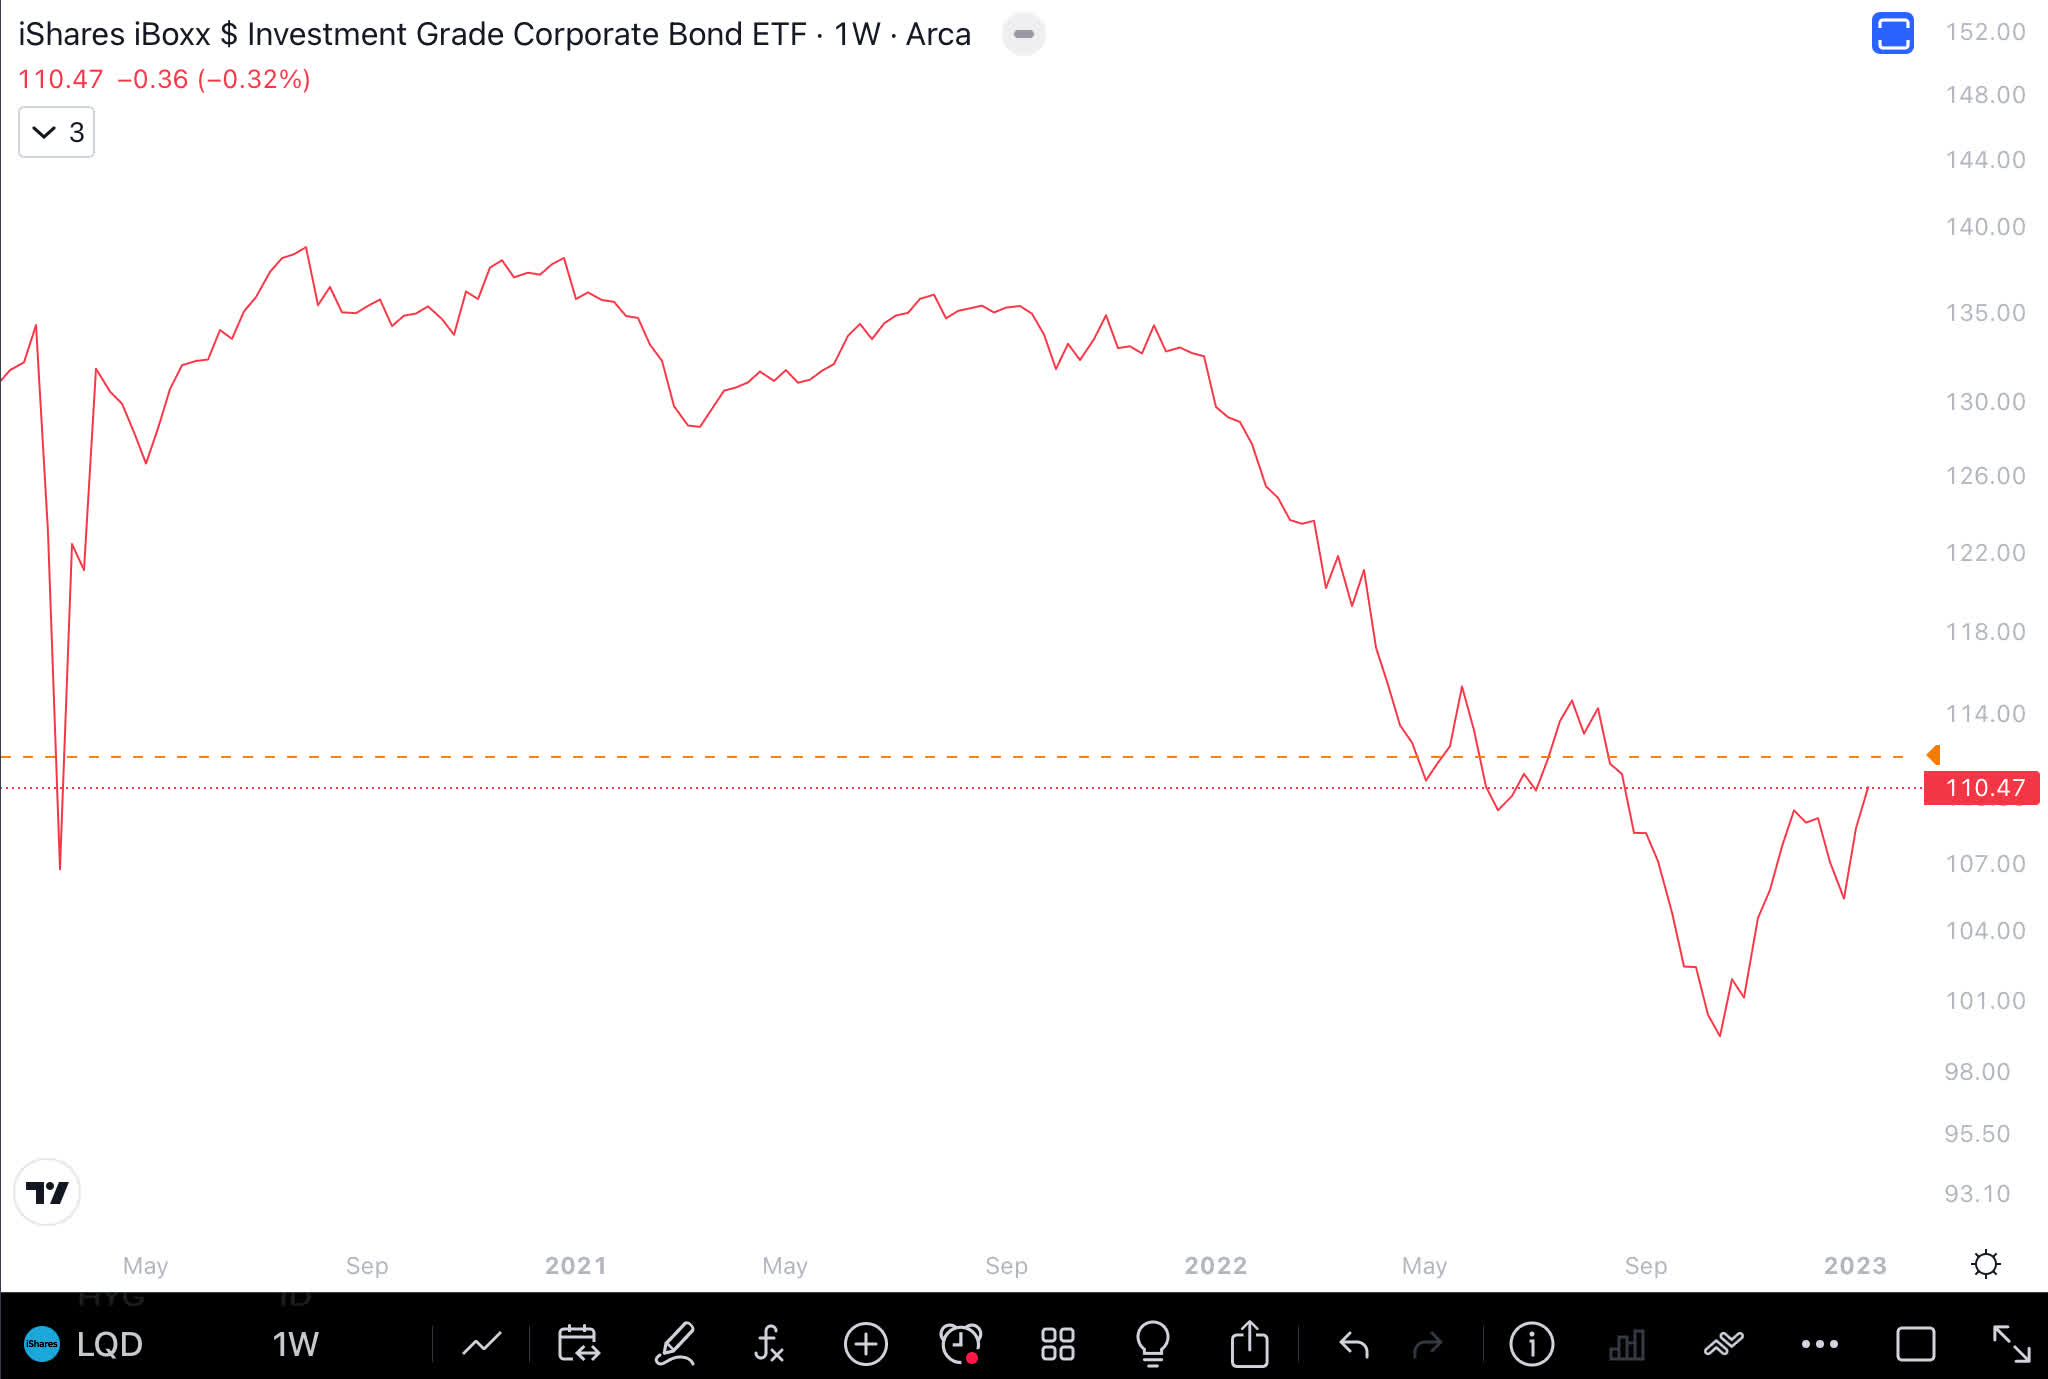
U.S. High Yield Index (Option Adjusted) Spread is below 6.5. It is falling and making lower highs and lower lows, which is positive for stocks.
High Yield Index Spread (Author )
Treasuries and Corporate Bonds Ratio
Ratio of treasuries (IEF) to investment grade corporate bonds (LQD) help determine risk-on or risk-off environment, as is determined collectively by bond investors. Below is the chart of IEF/LQD, which shows it is moving towards a supportive environment for stock investors.
IEF TLT Ratio (Author )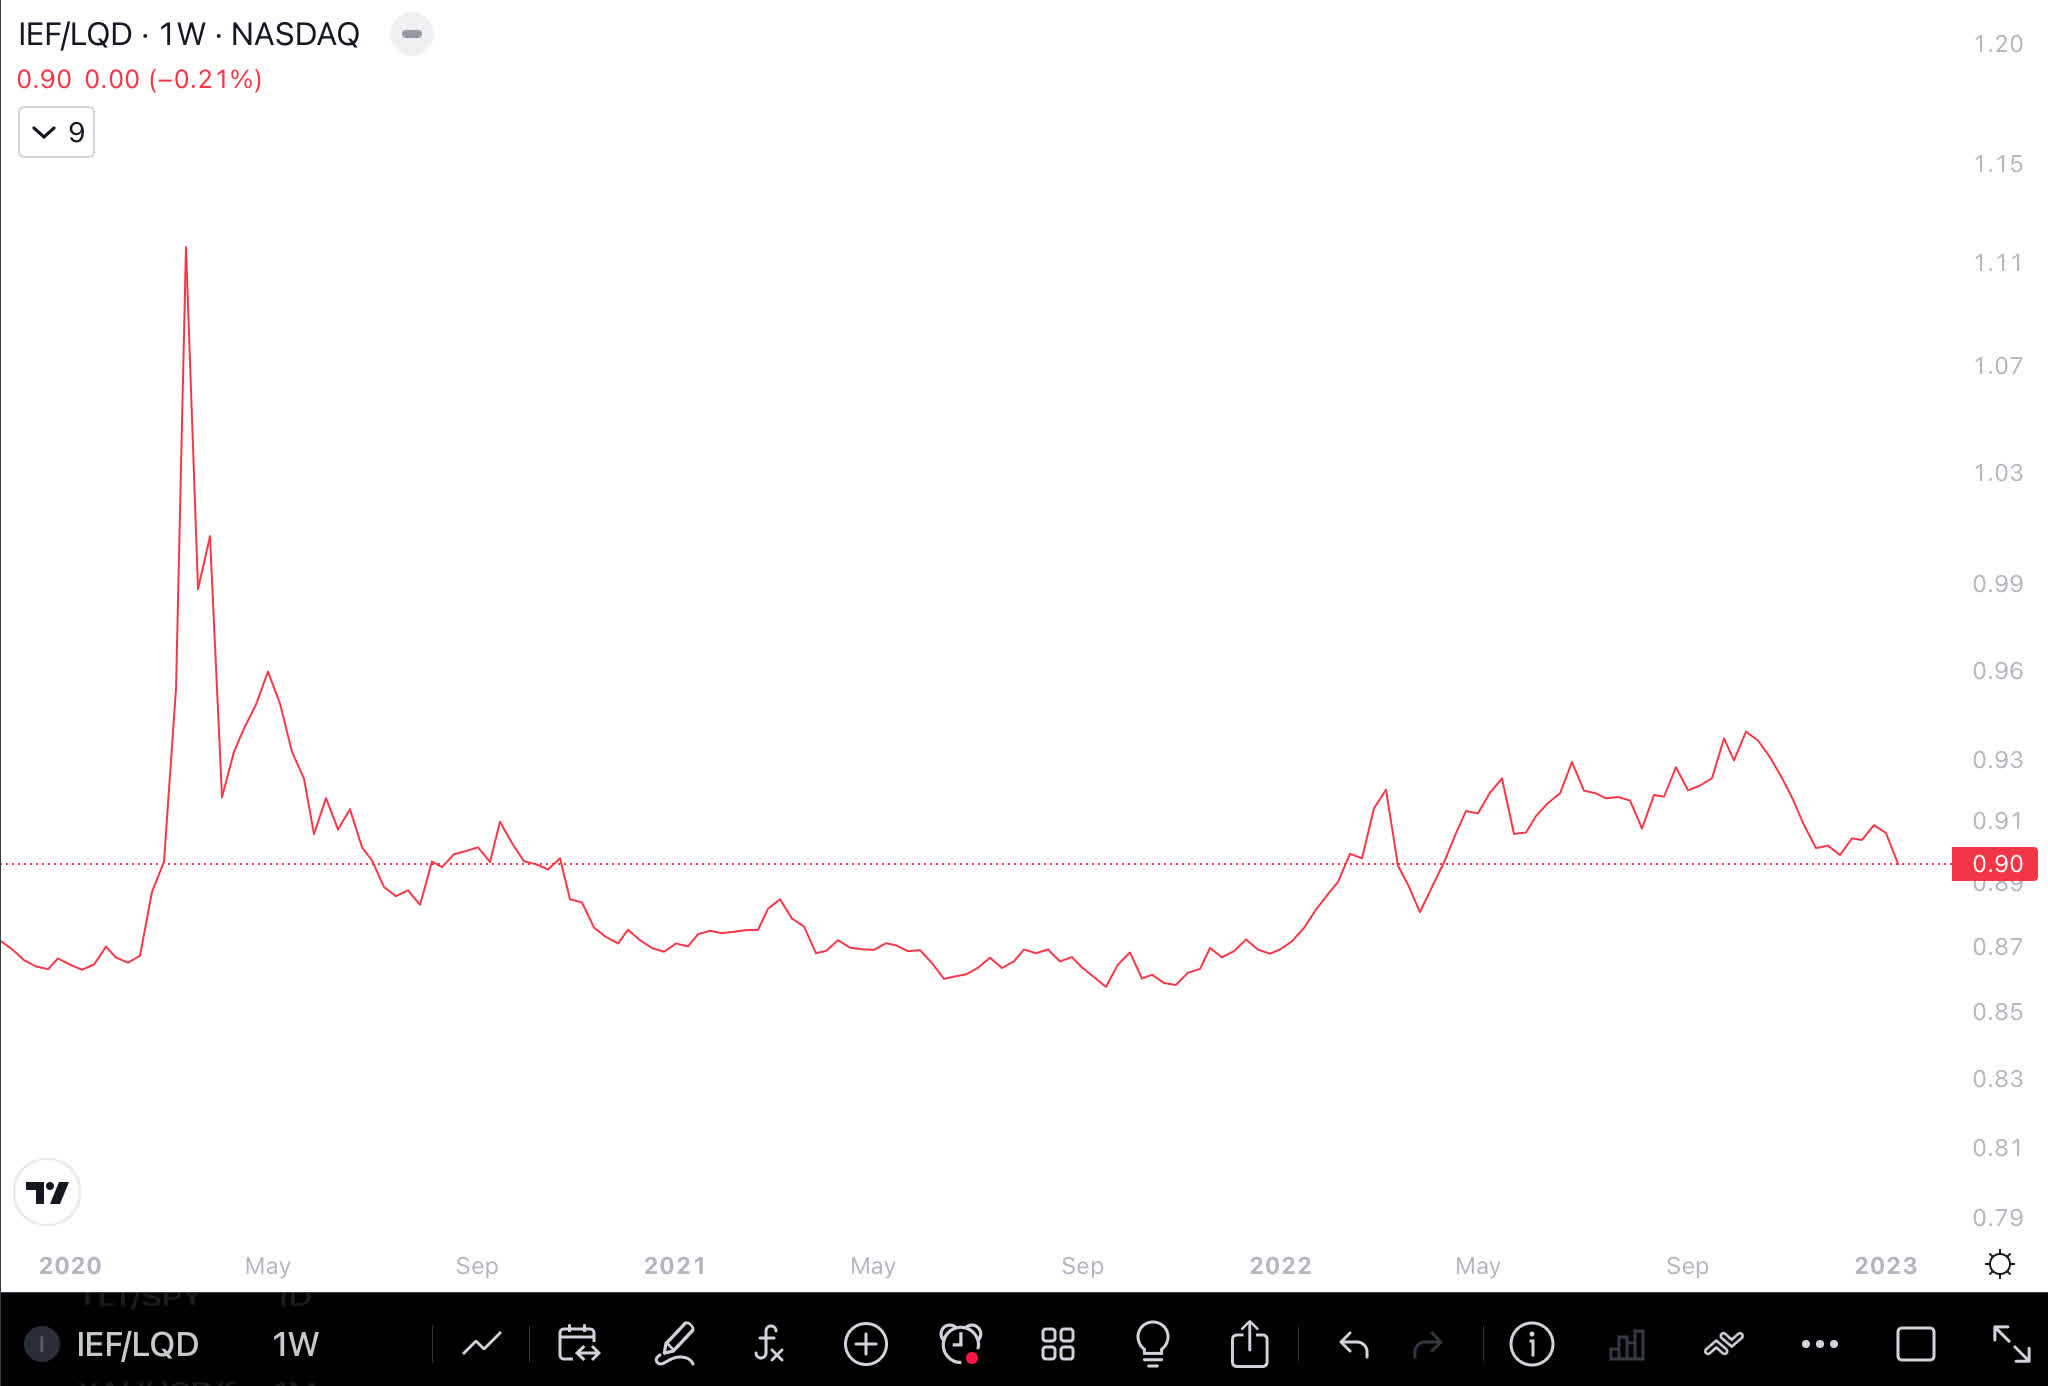
Commodities
Lumber prices have dropped, as mortgage rates have gone much higher and the housing market has slowed down sharply.
Lumber Futures Chart (Author )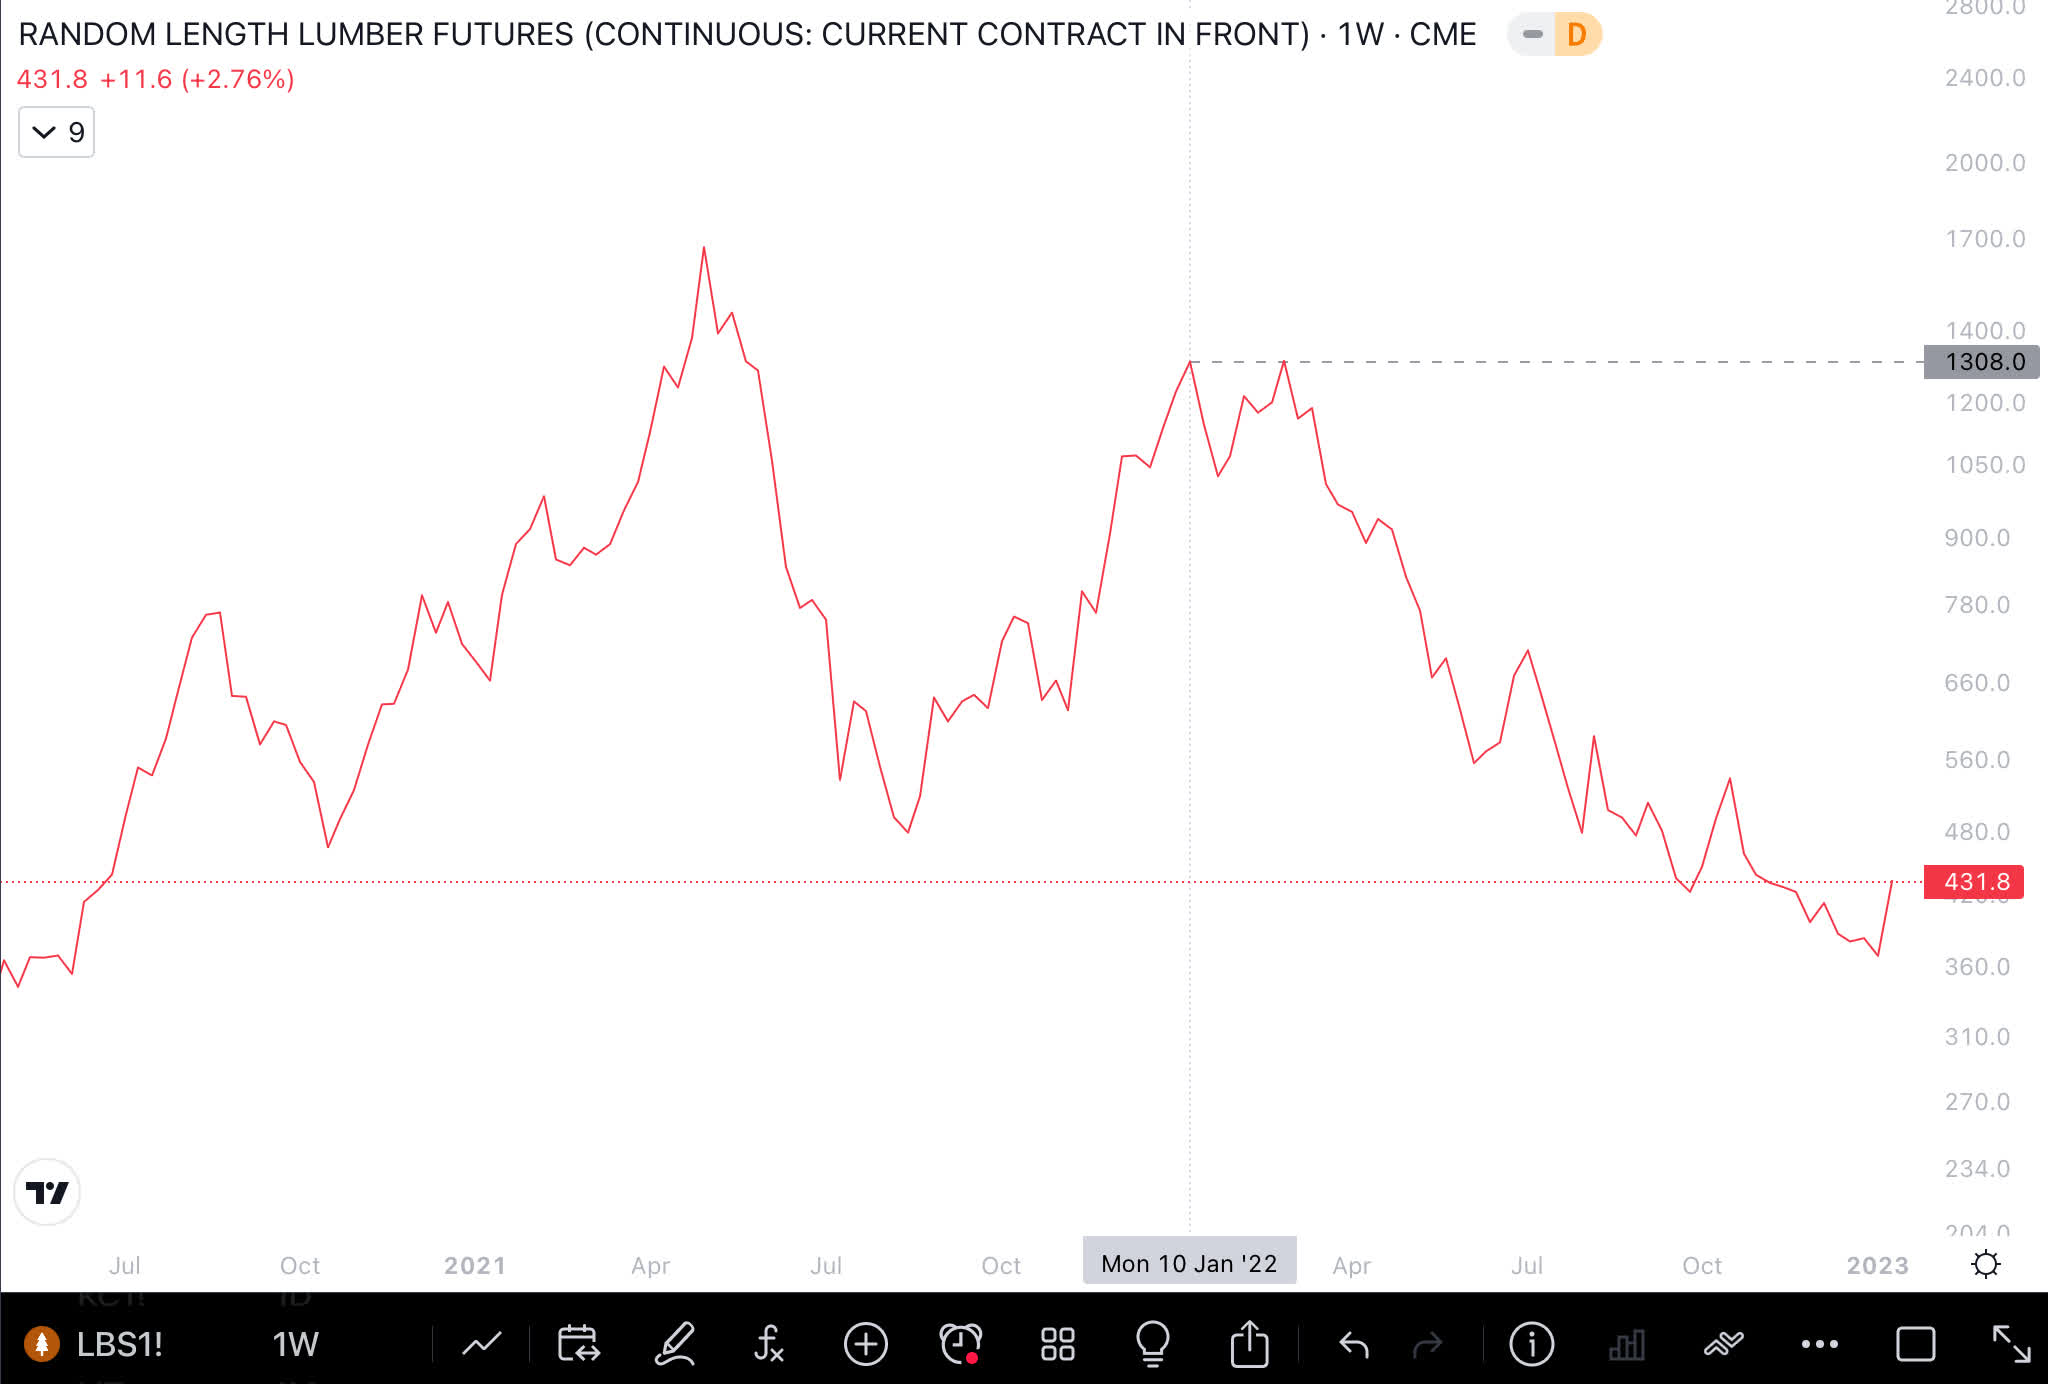
Natural gas futures are falling lower than prices a year ago.
Natural Gas Chart (Author )
Crude oil prices have also been falling slightly lower than a year ago.
Crude Oil Chart (Author )
Copper prices have moved up from the lows but remain lower than prices from a year ago. Rising copper prices are associated with increasing economic activity.
Copper Chart (Author )
Wheat future prices are where they were a year ago.
Wheat Chart (Author )
Corn futures prices are above those from a year ago.
Corn Chart (Author )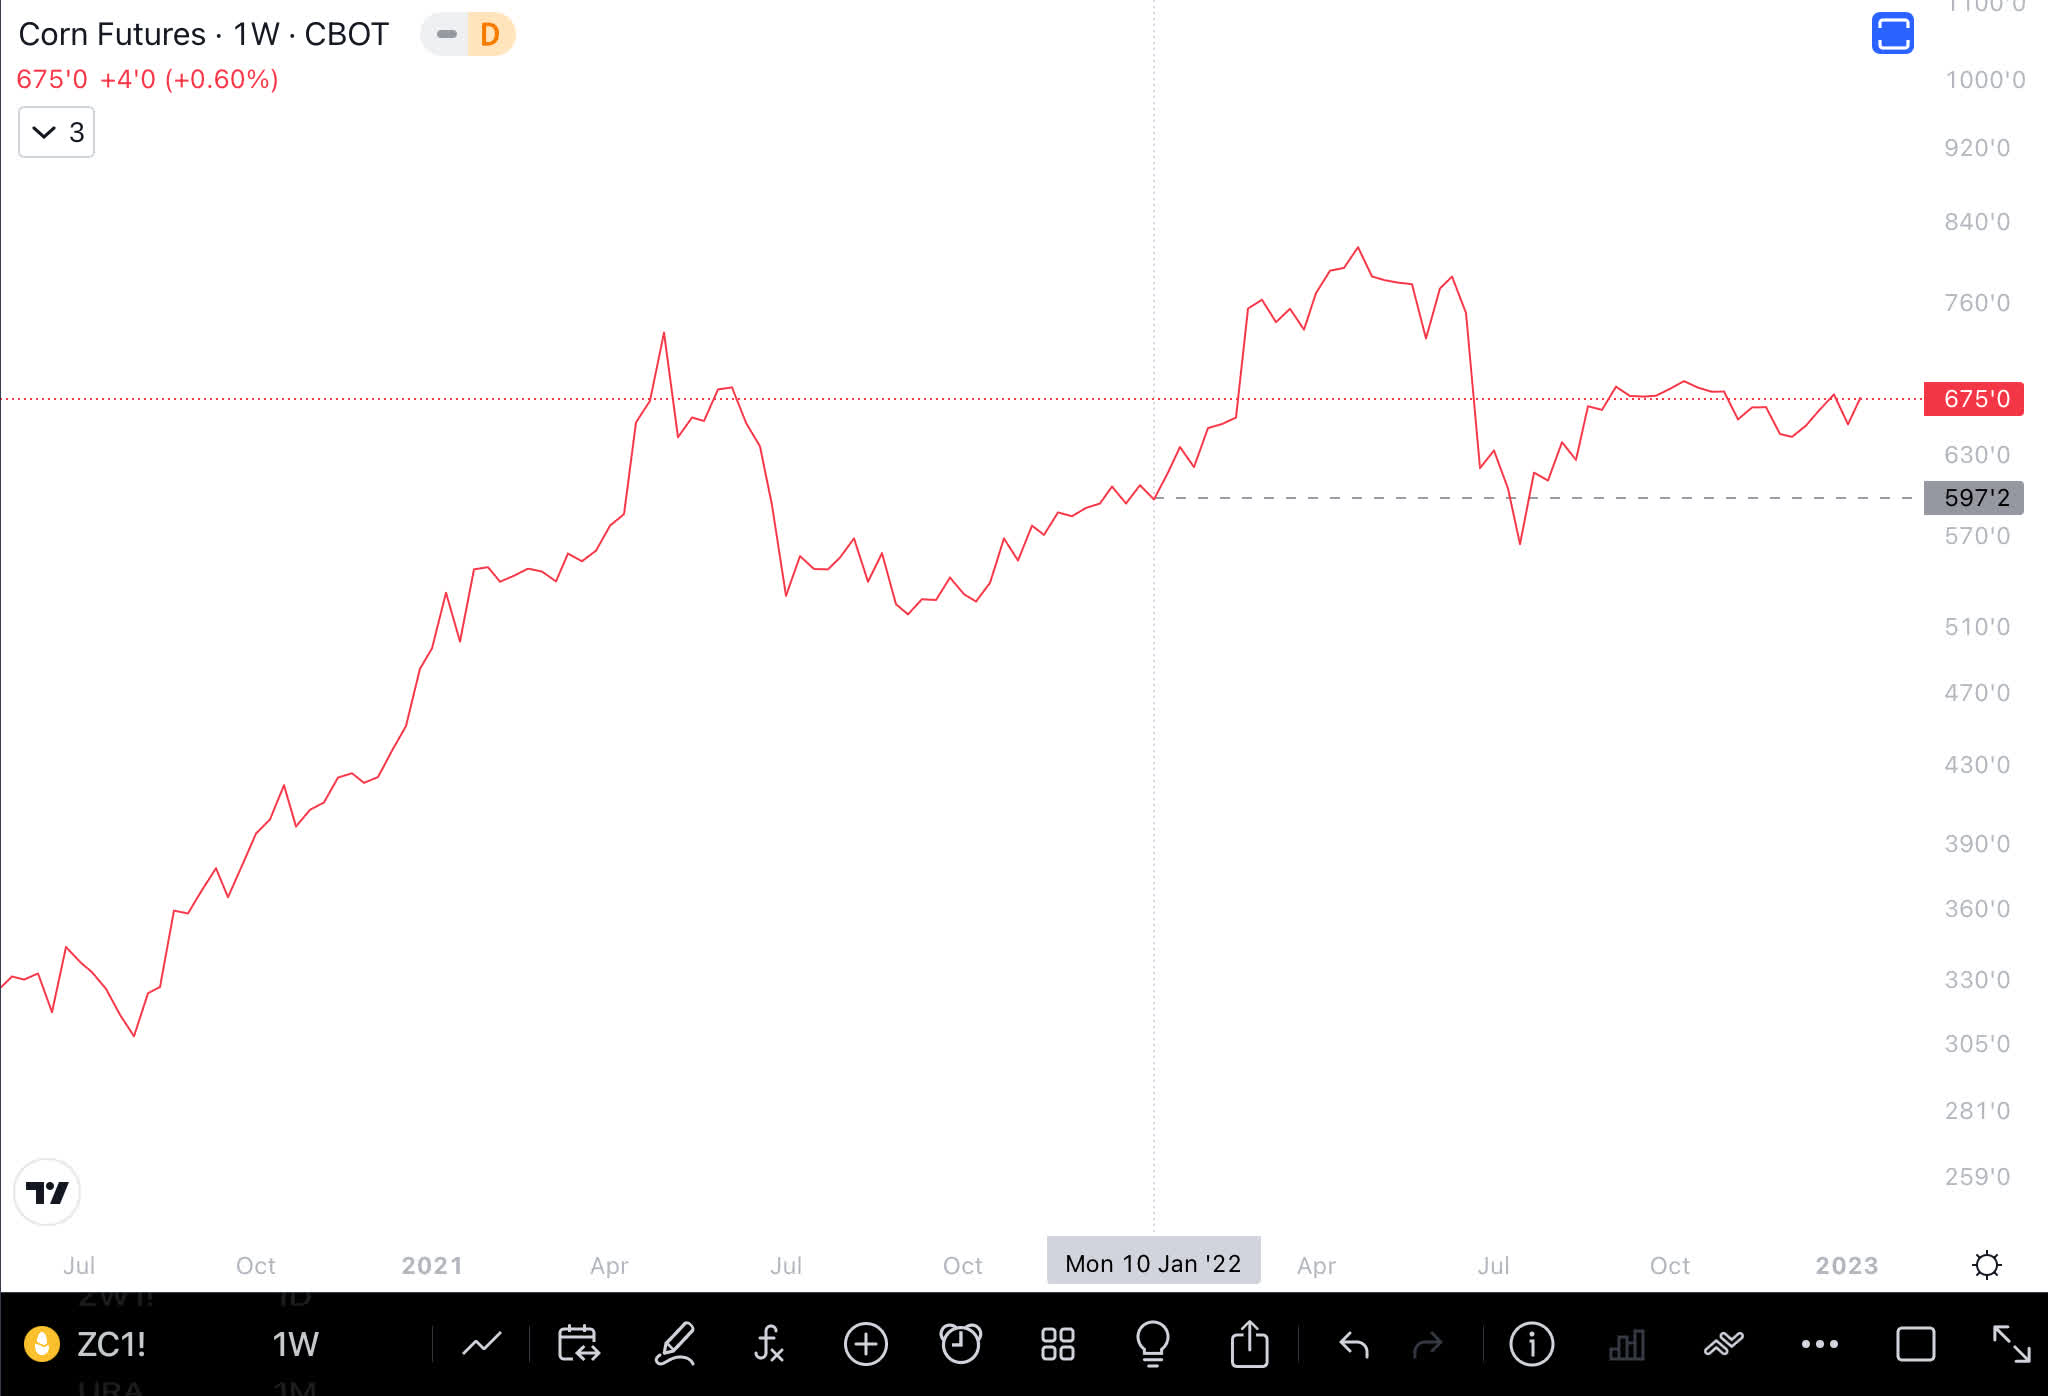
Silver prices have moved higher in the last few weeks and higher than prices from a year ago. This could signal increased economic activity.
Silver Chart (Author )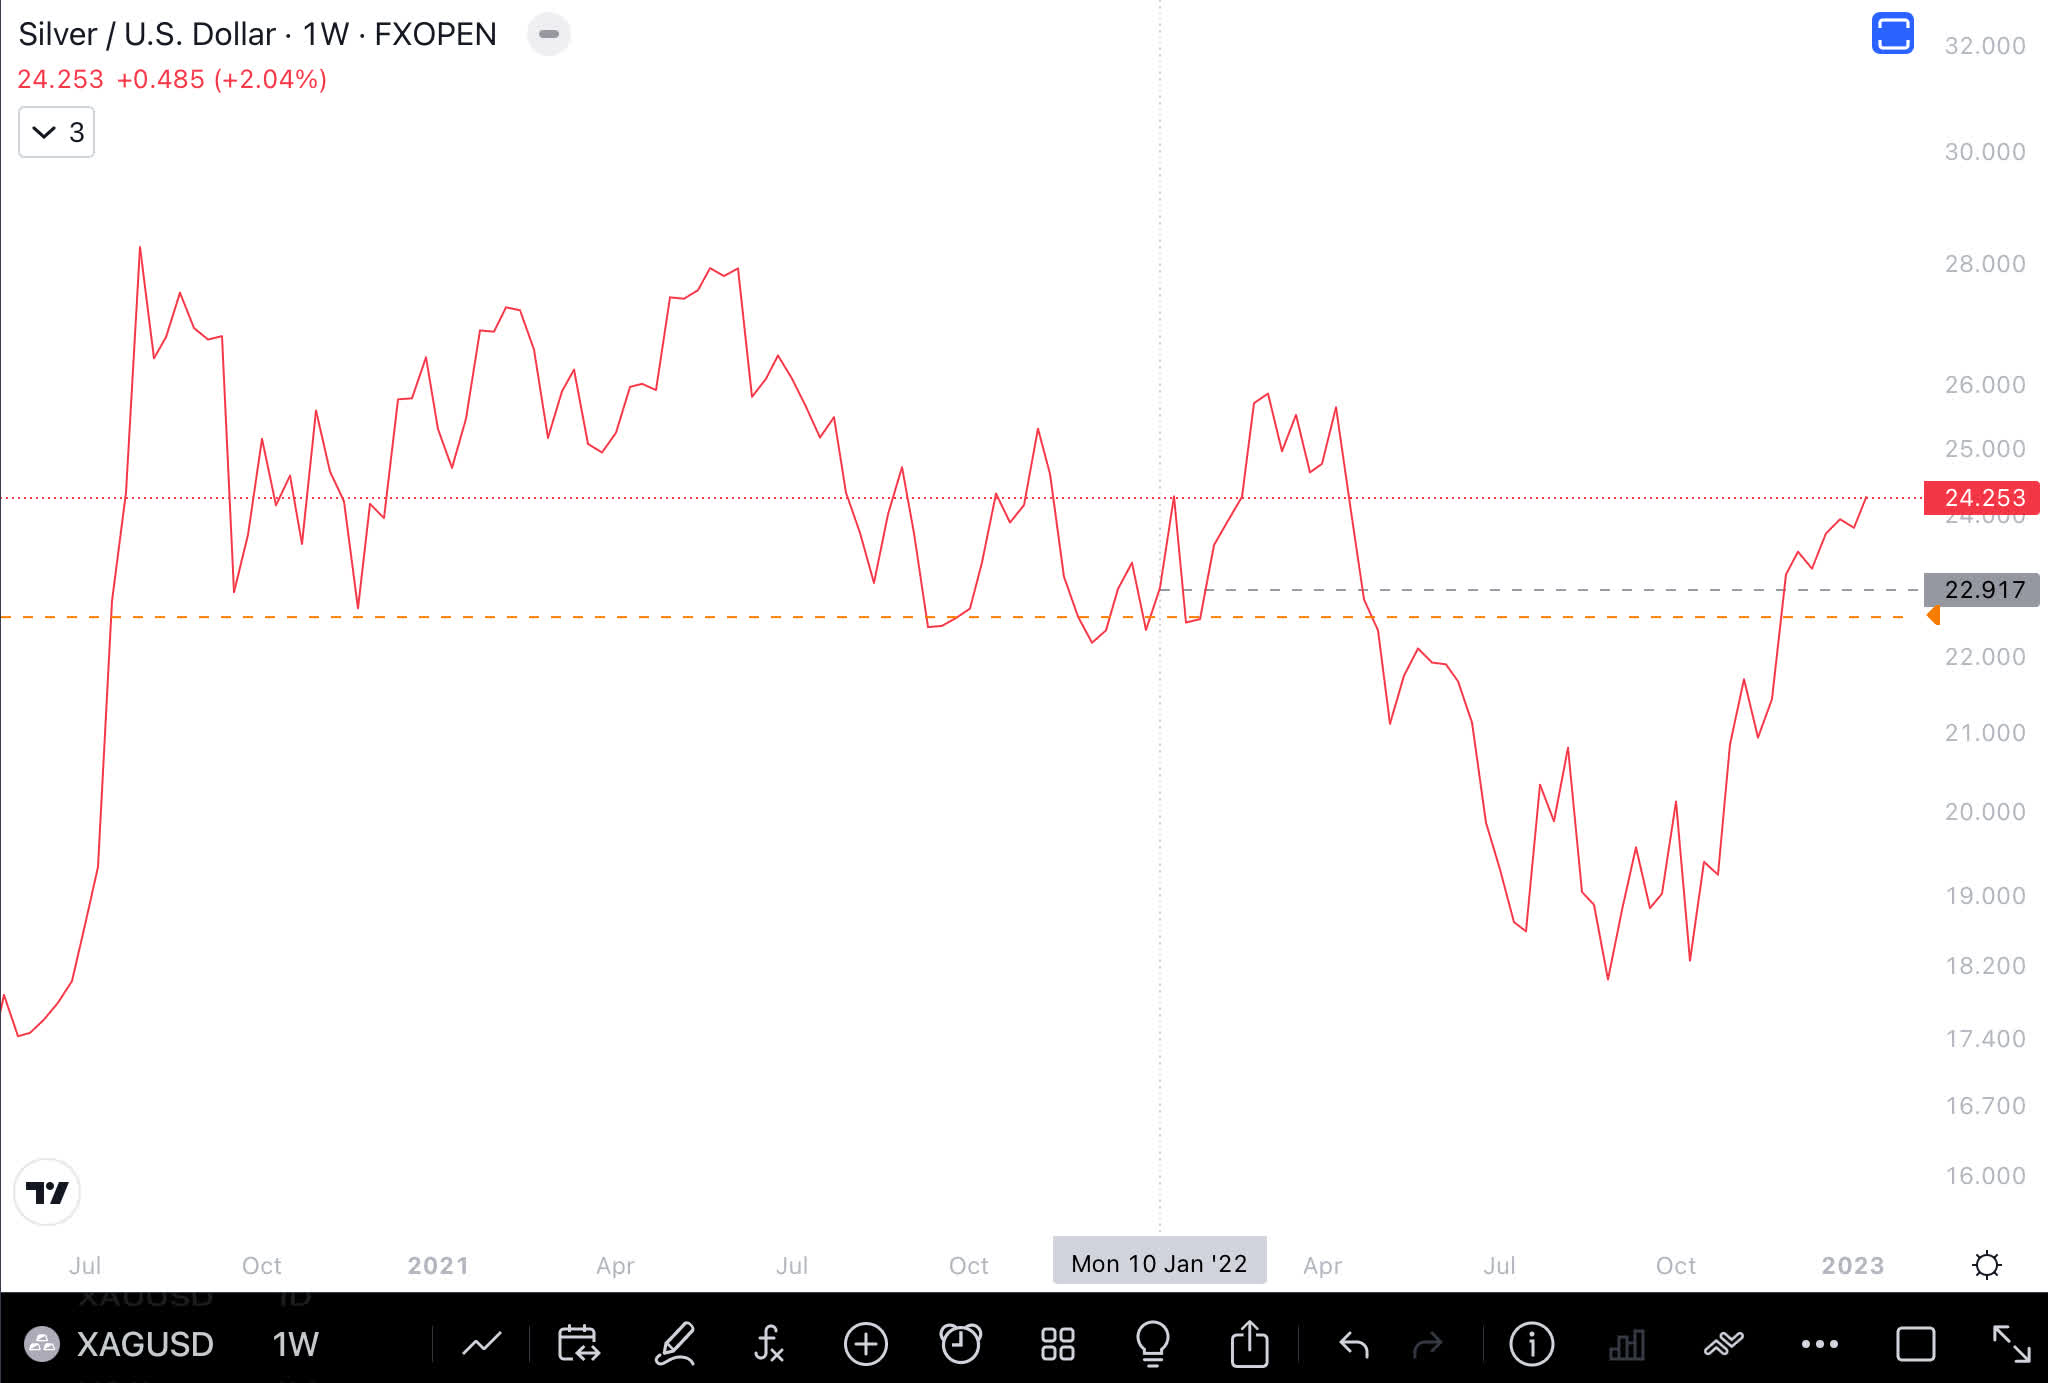
Uranium prices are about the same and have been stable the last few weeks.
Uranium Chart (Author )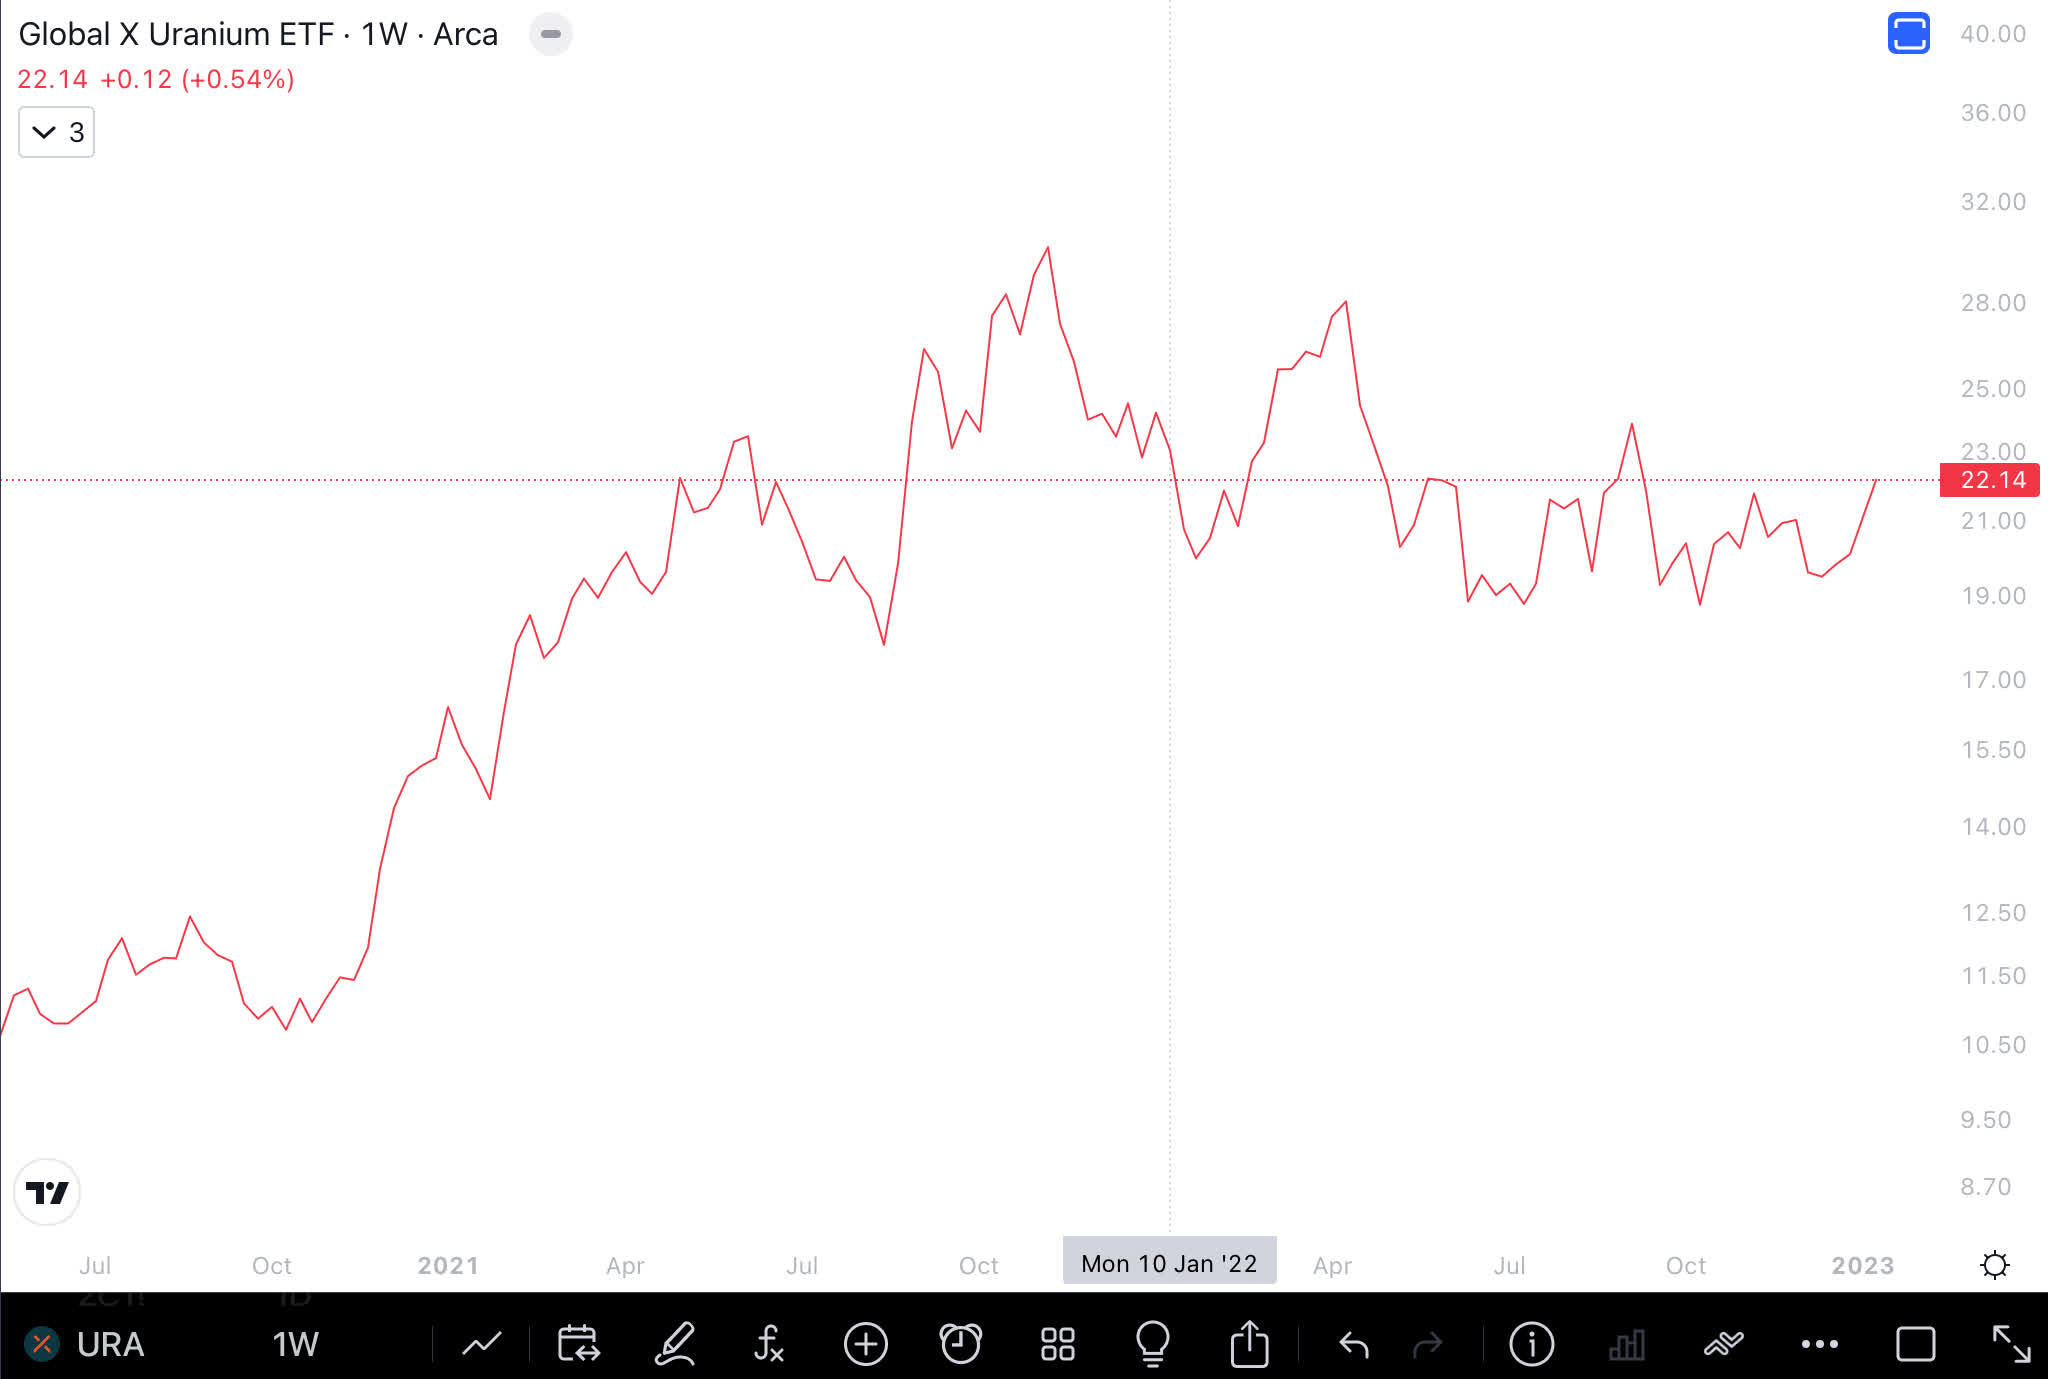
Rental prices, as measured by Zillow, are dropping; however, the rent component within the CPI has not begun to come down. It will start to drop in the coming months and is likely to show quickly falling inflation.
Rent Zillow vs CPI Rent (Zillow)
If commodities, rent, and other components of inflation are dropping then inflation will continue to slow down in the coming months, and the Federal Reserve should be able to end federal funds rate (FFR) increases.
U.S. Dollar Index
The U.S. Dollar index (DXY) has pulled back after topping at 114.8 and has dropped down to 102. The falling dollar index is supportive for stocks and makes U.S. exports more competitive.
DXY Chart (Author )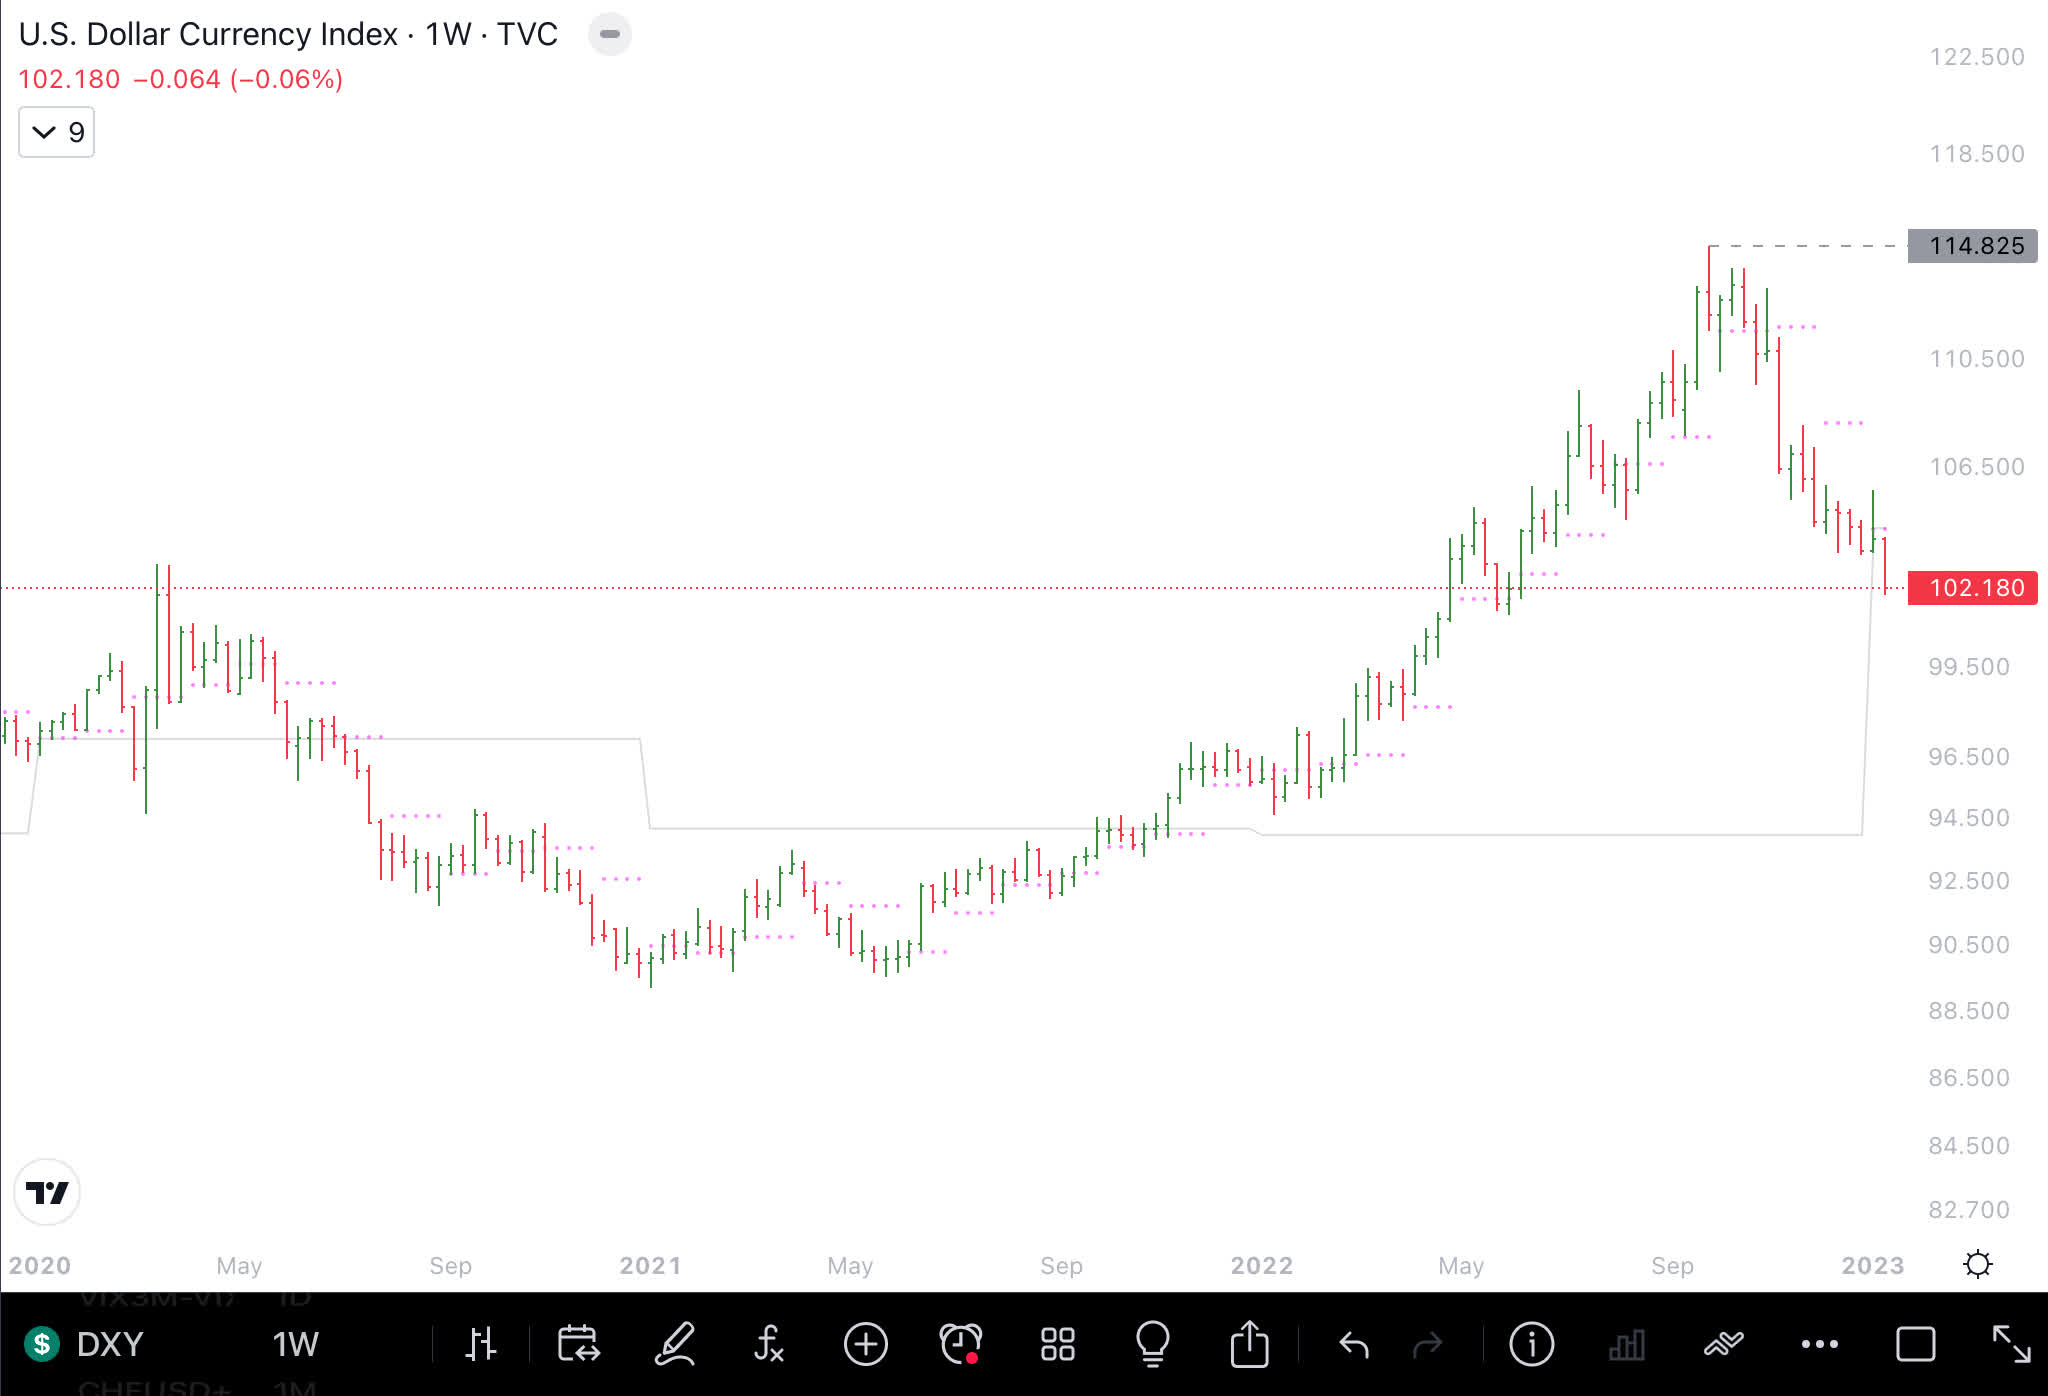
Green Shoot Charts
The chart of the S&P 500 is still in a downtrend until it breaks above 4110 and stays above 4050. For conservative investors, the S&P 500 needs to close above 4350 and stay above the cloud and 4050 on a weekly closing basis.
S&P 500 Chart (Author )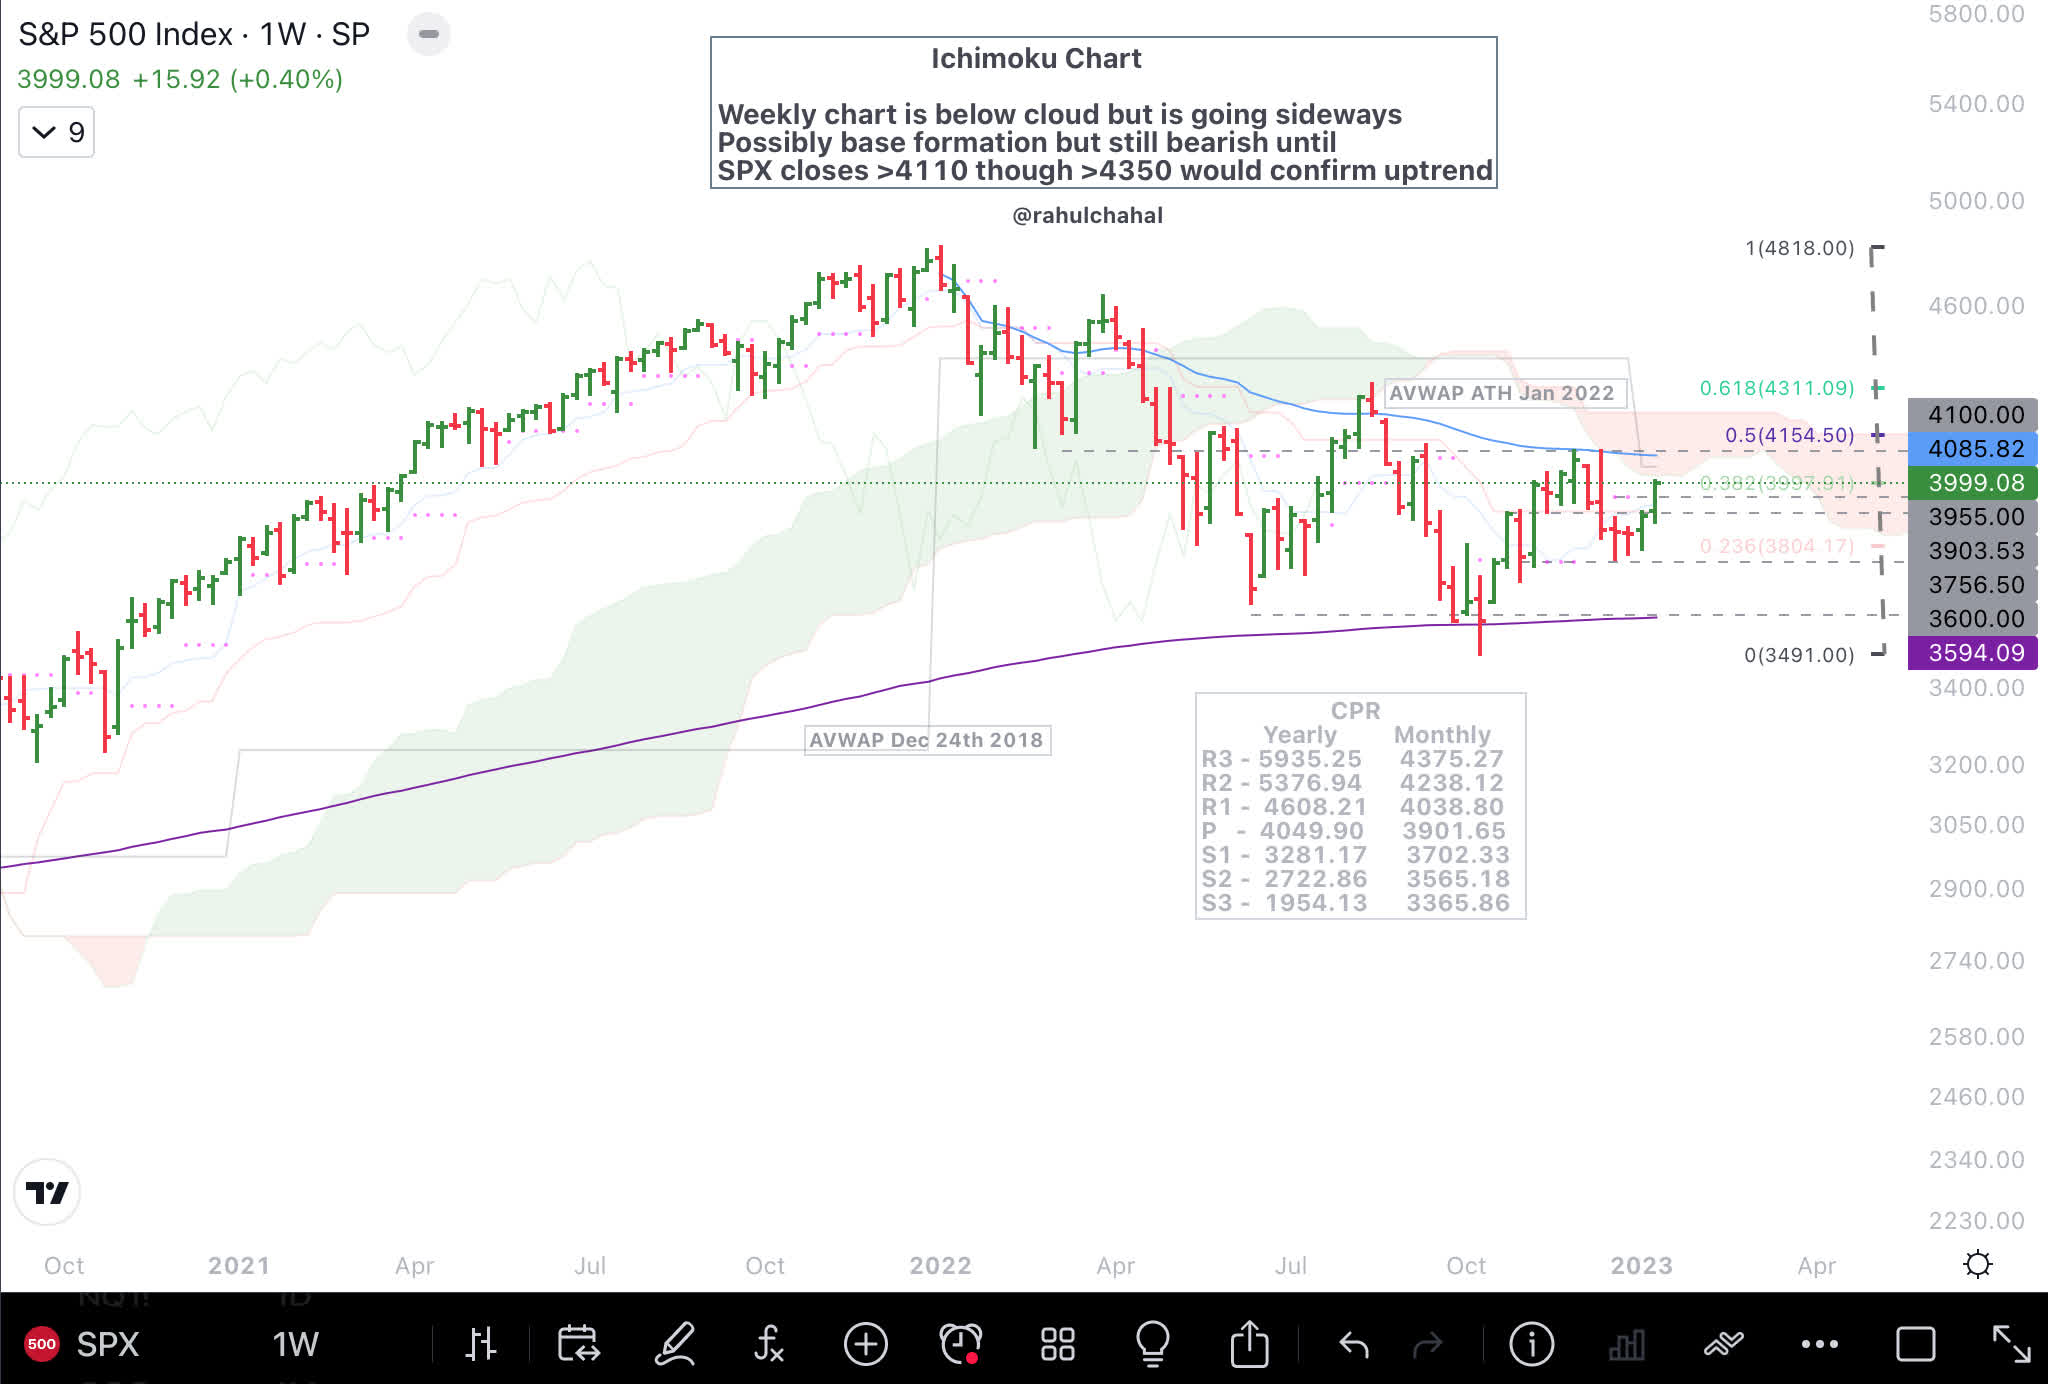
SP500 chart with the 200-day moving average and 200-week moving average.
S&P 500 (Author )
Equally weighted discretionary to equally weighted staples has trend up, and is so far indicating that the stock market might go into a risk-on environment.
Eq wt Discretionary to Staples Chart (Author )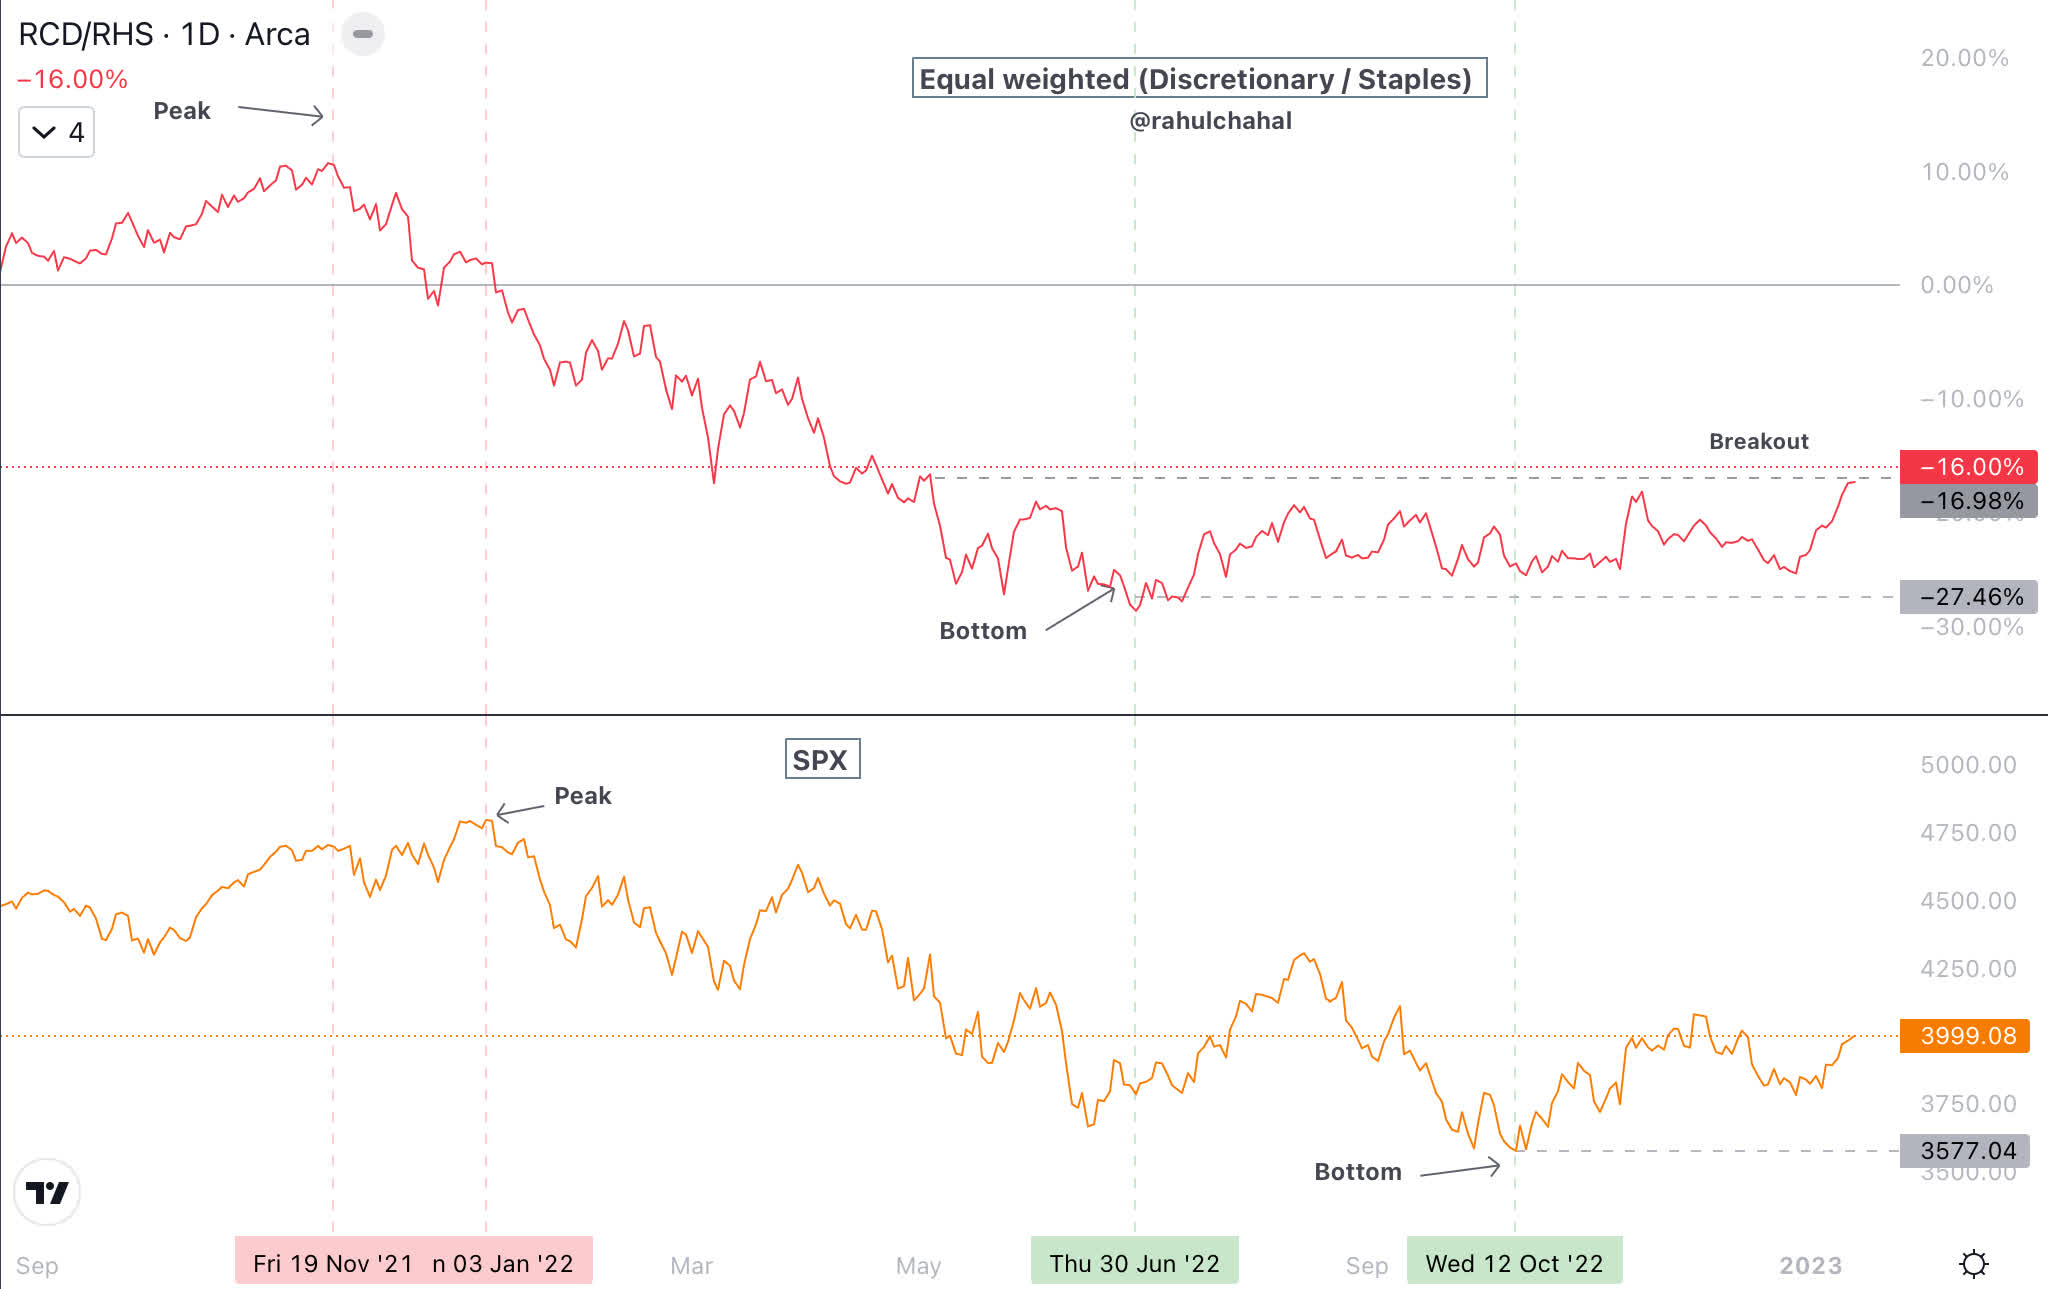
High yield has outperformed the SP500 from the October 2022 bottom, which is another positive green shoot.
SPX HYG Chart (Author )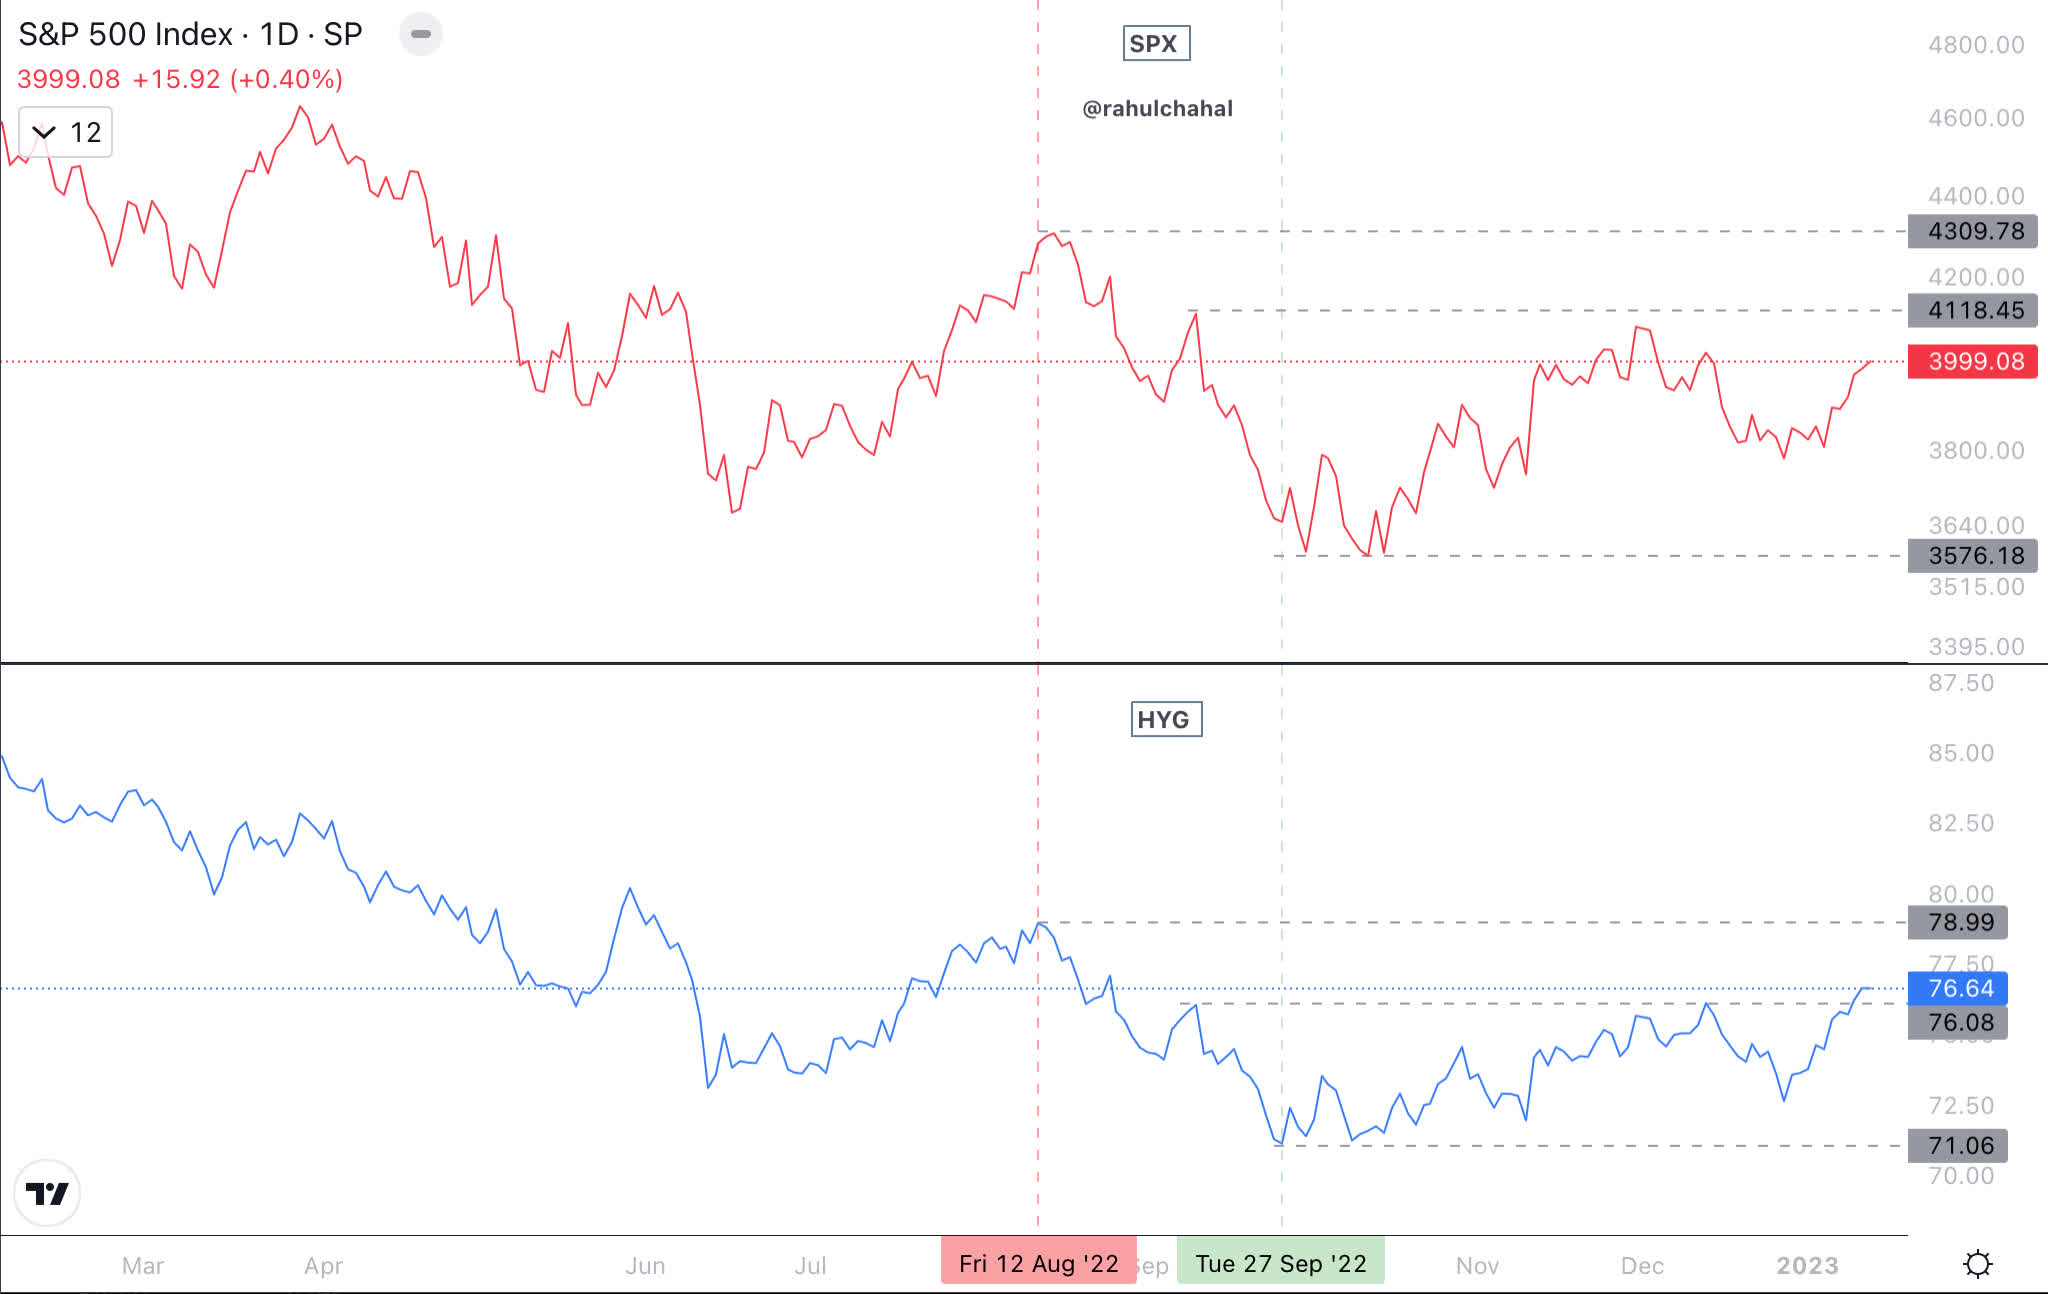
The advance decline line has broken above levels from August 2022, which is another green shoot.
SPX Advance Decline Line Chart (Author )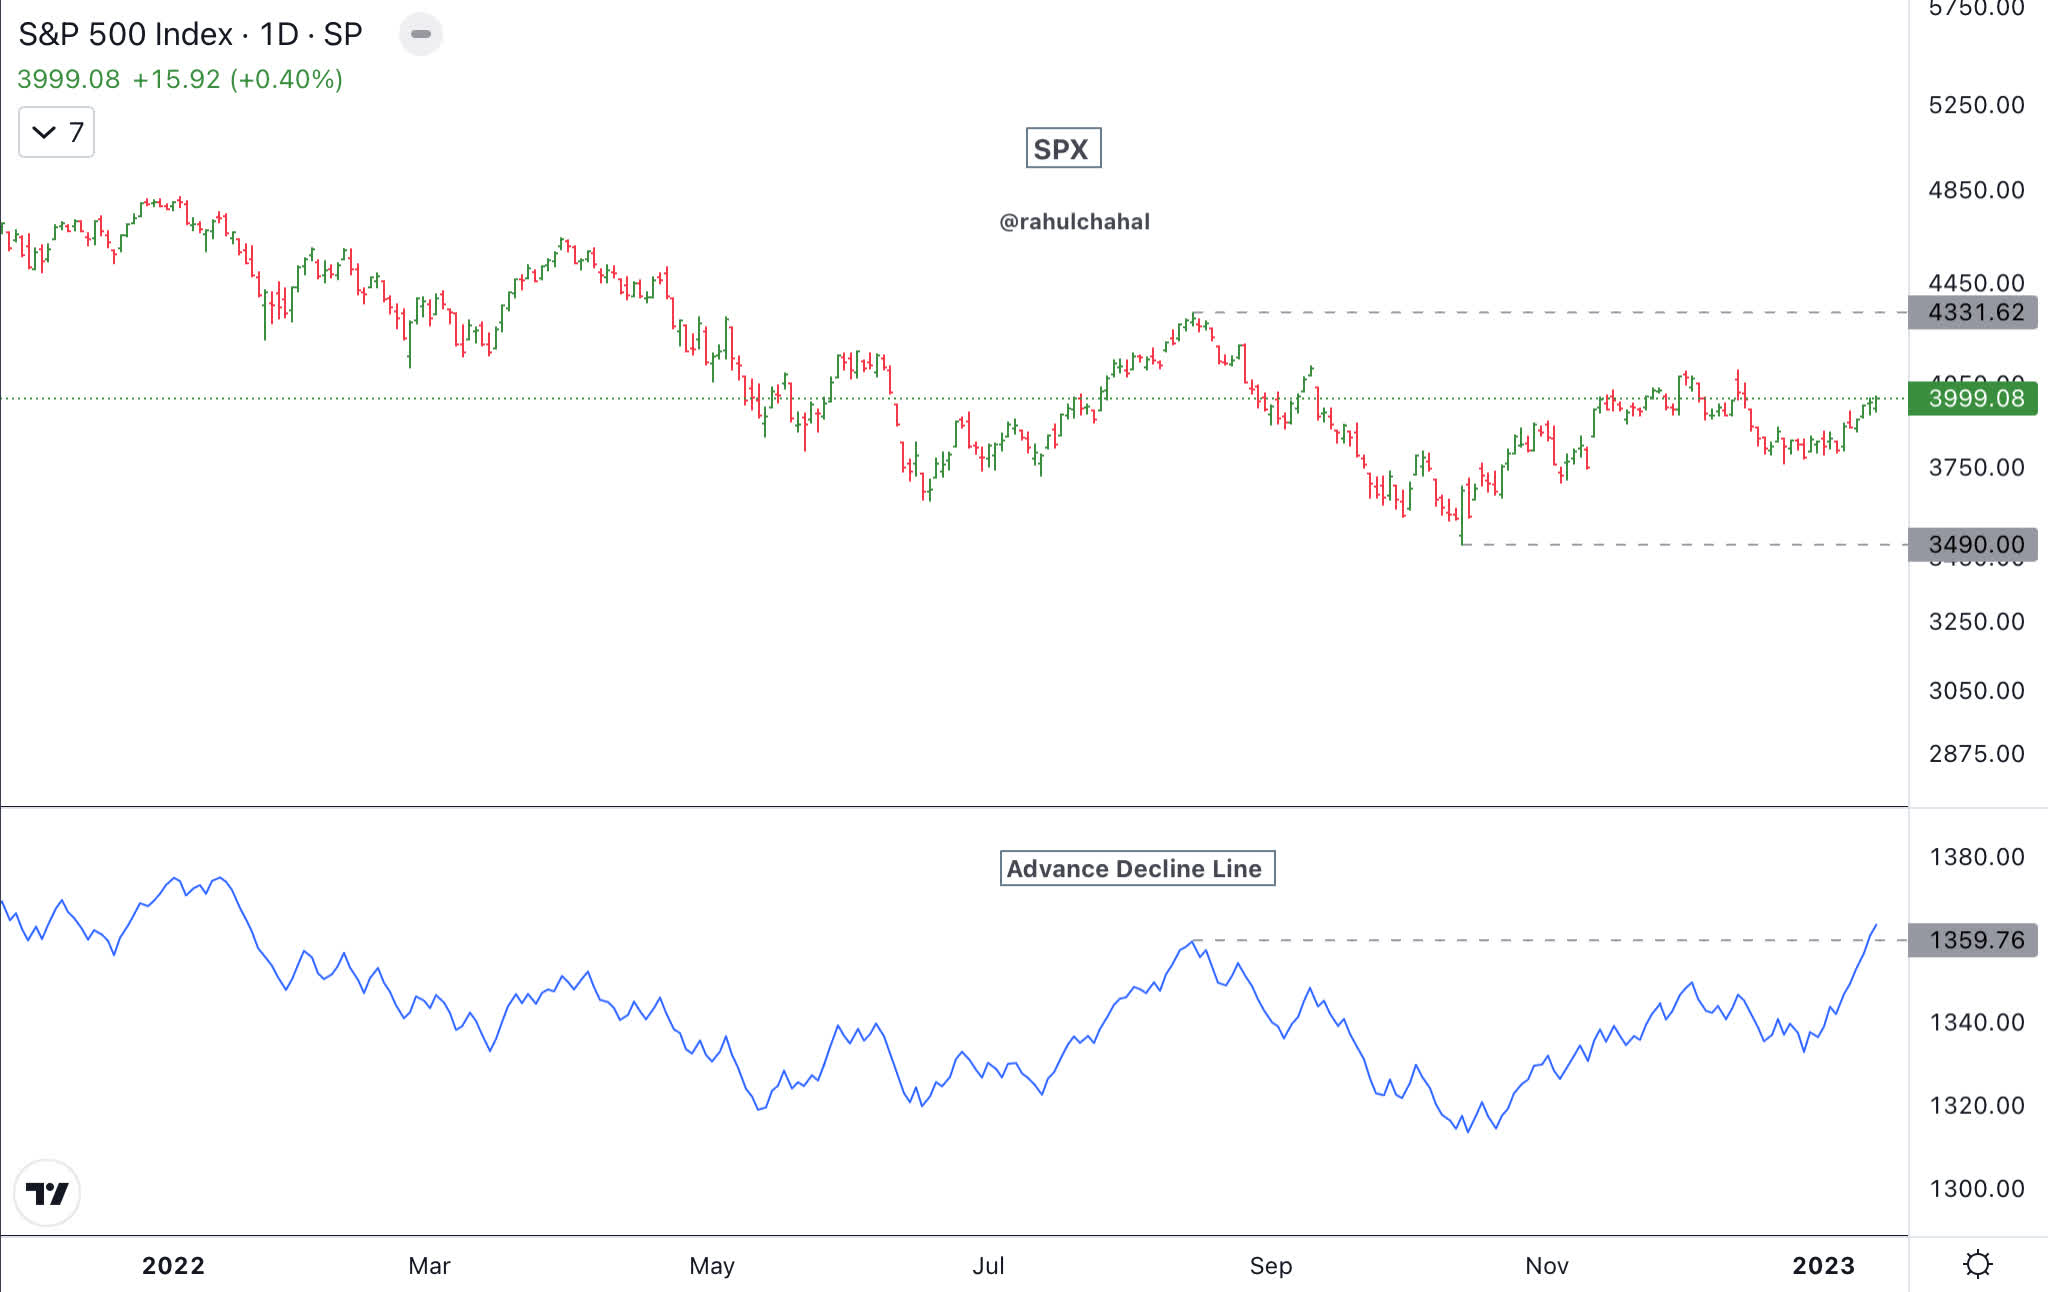
S&P 500 had a breadth thrust last week along with a number of other positive signals. All of these signals are piling up as supportive to higher stock prices.
SPX Breadth Thrust (Author )
Net new highs on New York Stock Exchange and NASDAQ have turned positive, but it needs to stay positive and have more new highs to confirm an uptrend.
SPX Net New Highs (Author )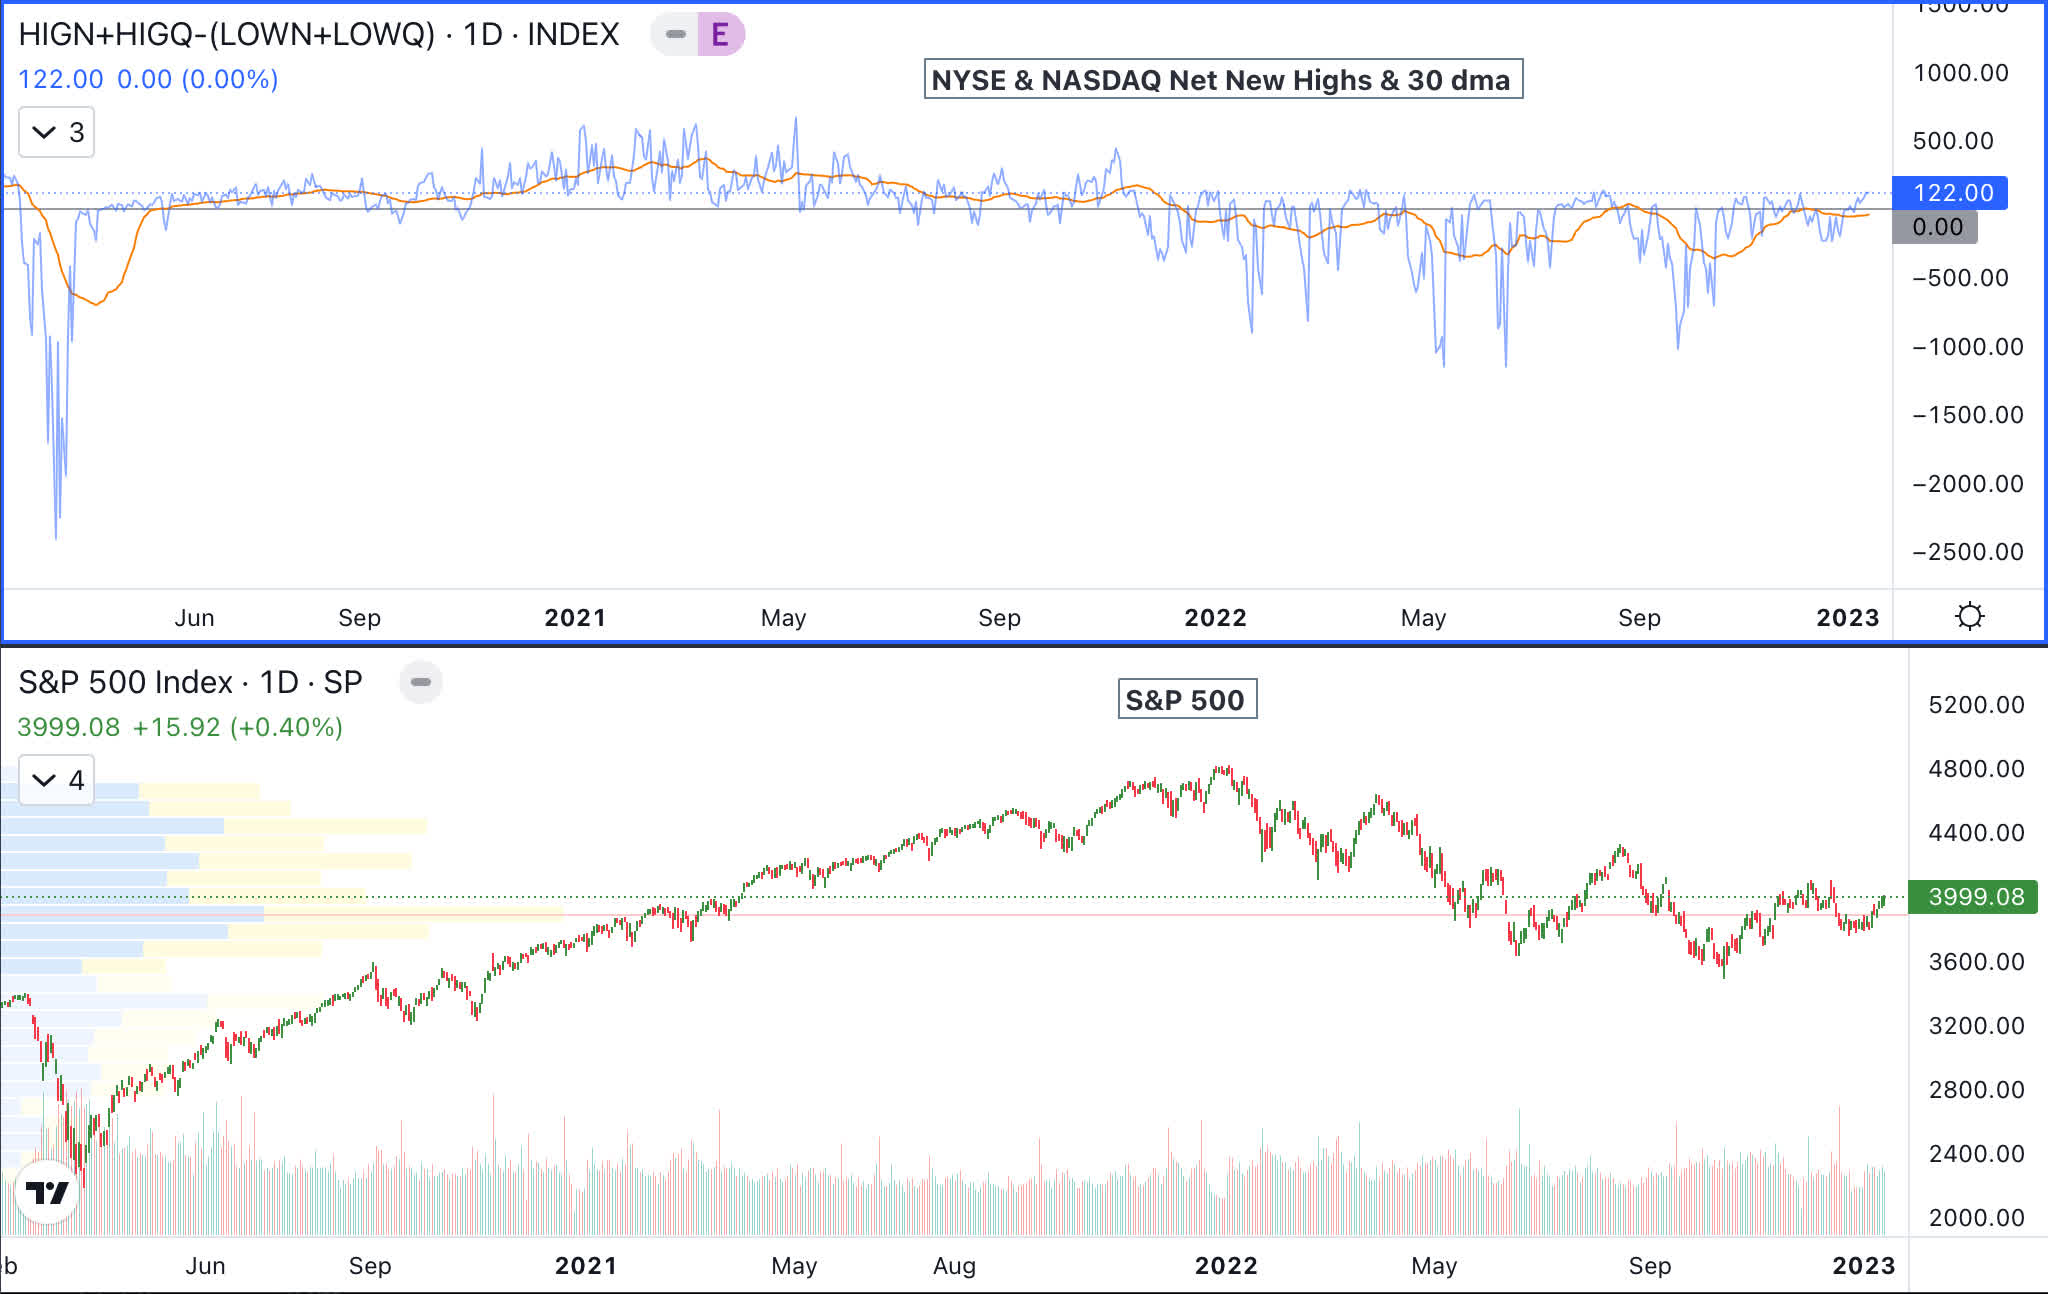
Dow Jones Transportation Average (DJT) is about to break above levels from November 2022. It has remained supportive for the overall stock market.
SPX Dow Transports (Author )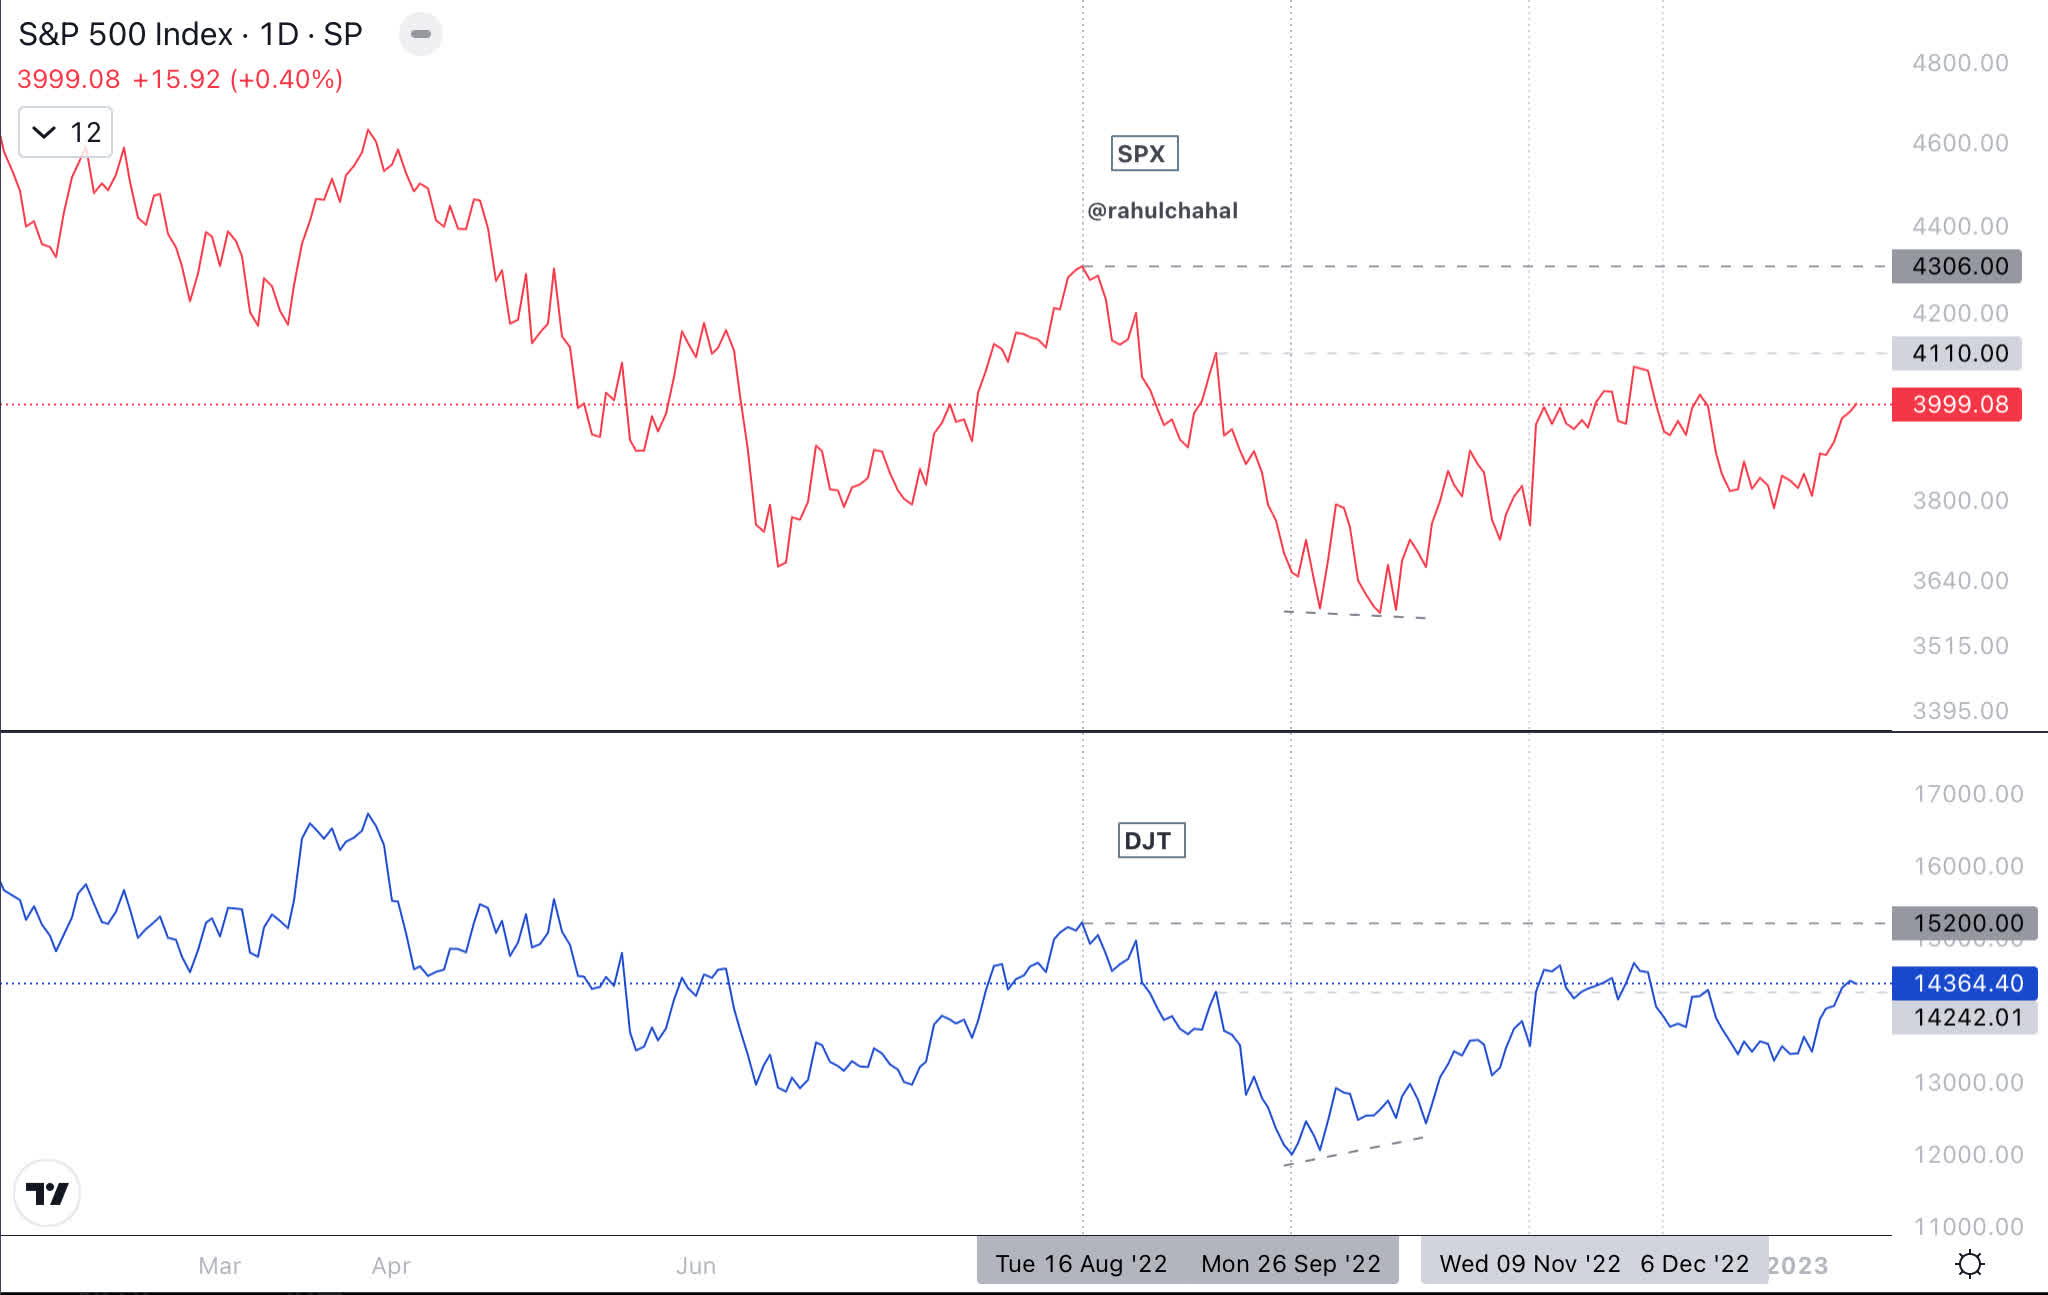
Number of stocks in S&P 500 above the 200-day moving average and the 50-day moving average show broad participation in the index.
SPX Stocks above 200 & 50 day moving average (Author )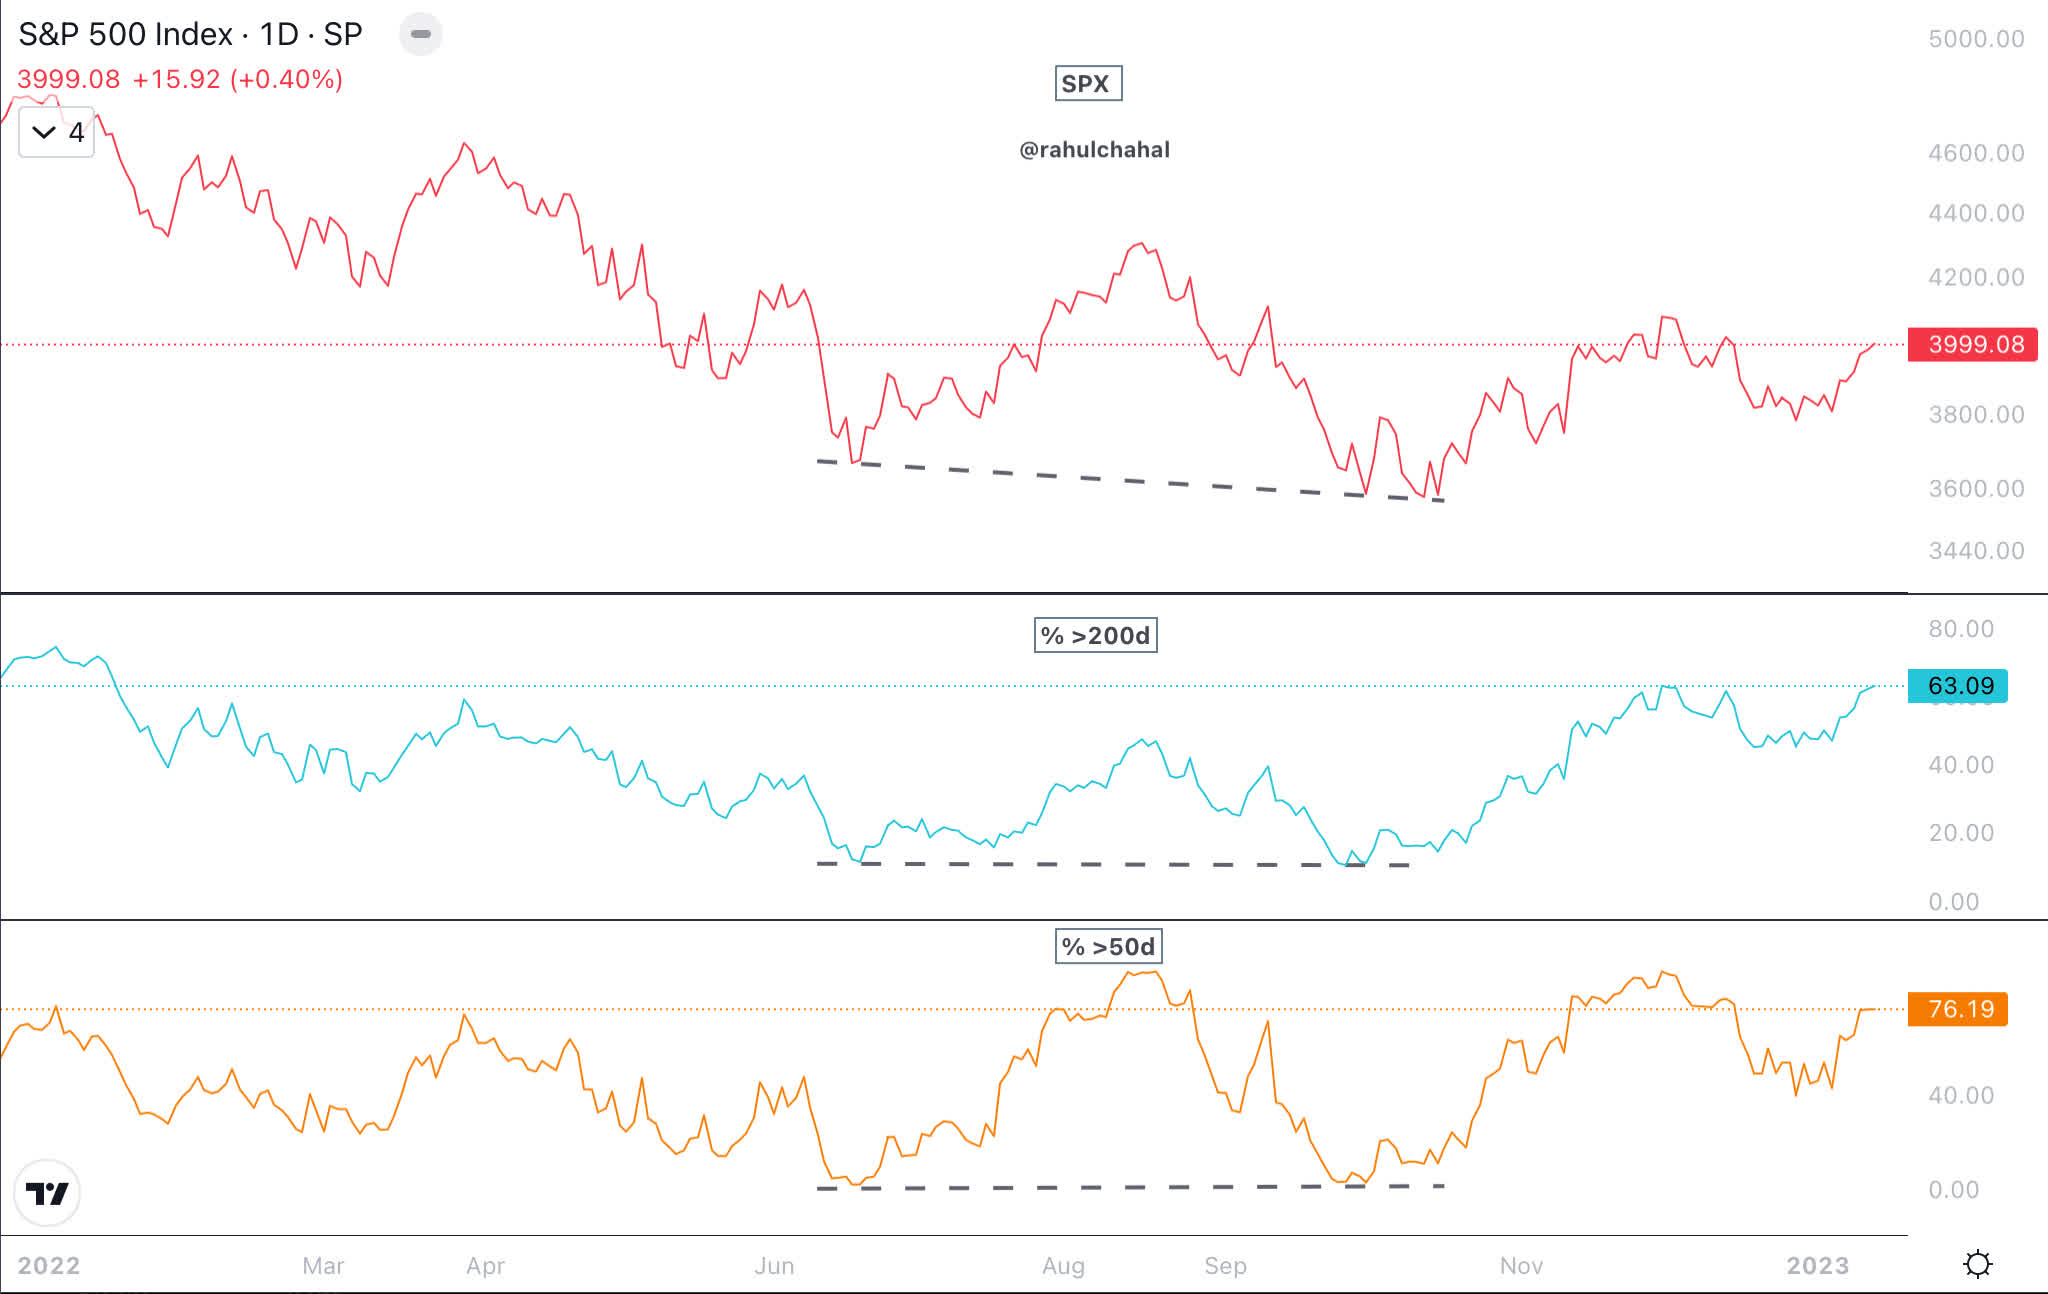
The U.S. high yield corporate bond index has been steadily rising and is about to breakout to new levels, which indicates a risk-on environment.
Corporate Bond Index & S&P 500 (Author )
Similarly, VIX is also supportive for stocks, as it has dropped below 20.
VIX and S&P 500 Chart (Author )
VIX Term Structure
The VIX term structure is in contango and VIX is below 20. This is a positive development and supportive for a risk-on environment.
VIX Term Structure (VIX Central)
Sentiment & Positioning
Sentiment has remained bearish for a number of weeks. While I would not rely too much on sentiment, it could mean that a lot of investors are worried about a recession and are holding cash or shorting the stock market.
AAII Sentiment (AAII)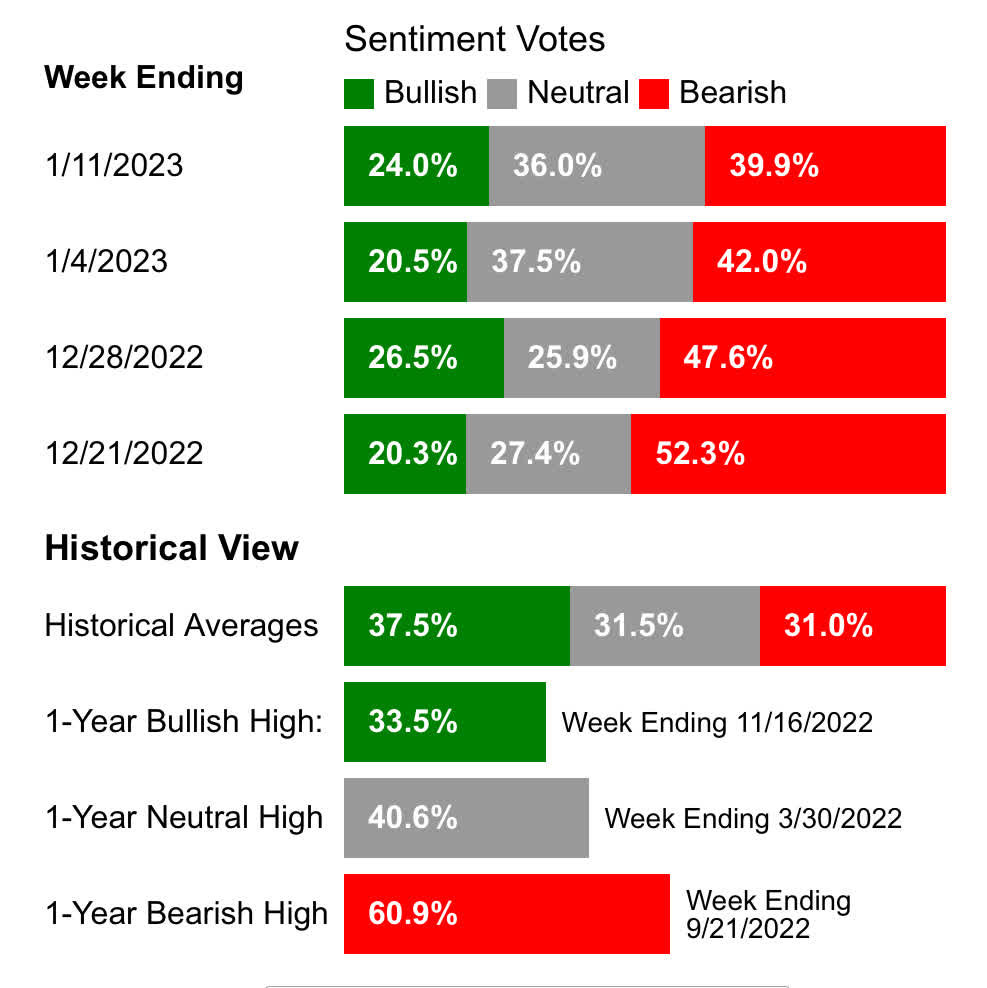
Positioning, as measured by the National Association of Active Investment Managers, shows low levels of long positions.
NAAIM Positioning (NAAIM )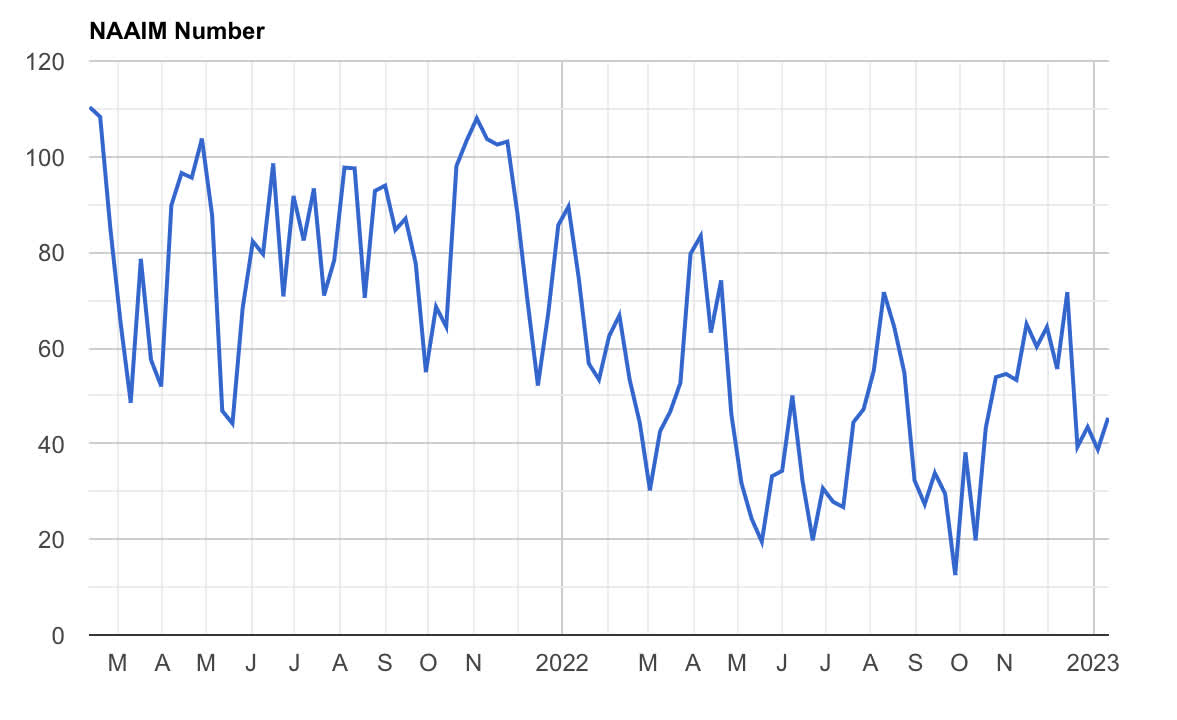
Money Market
There is over $5 Trillion in money market funds. Any allocation from cash into stock would propel stocks higher along with short covering.
Total Investment in Money Market Funds (OFR)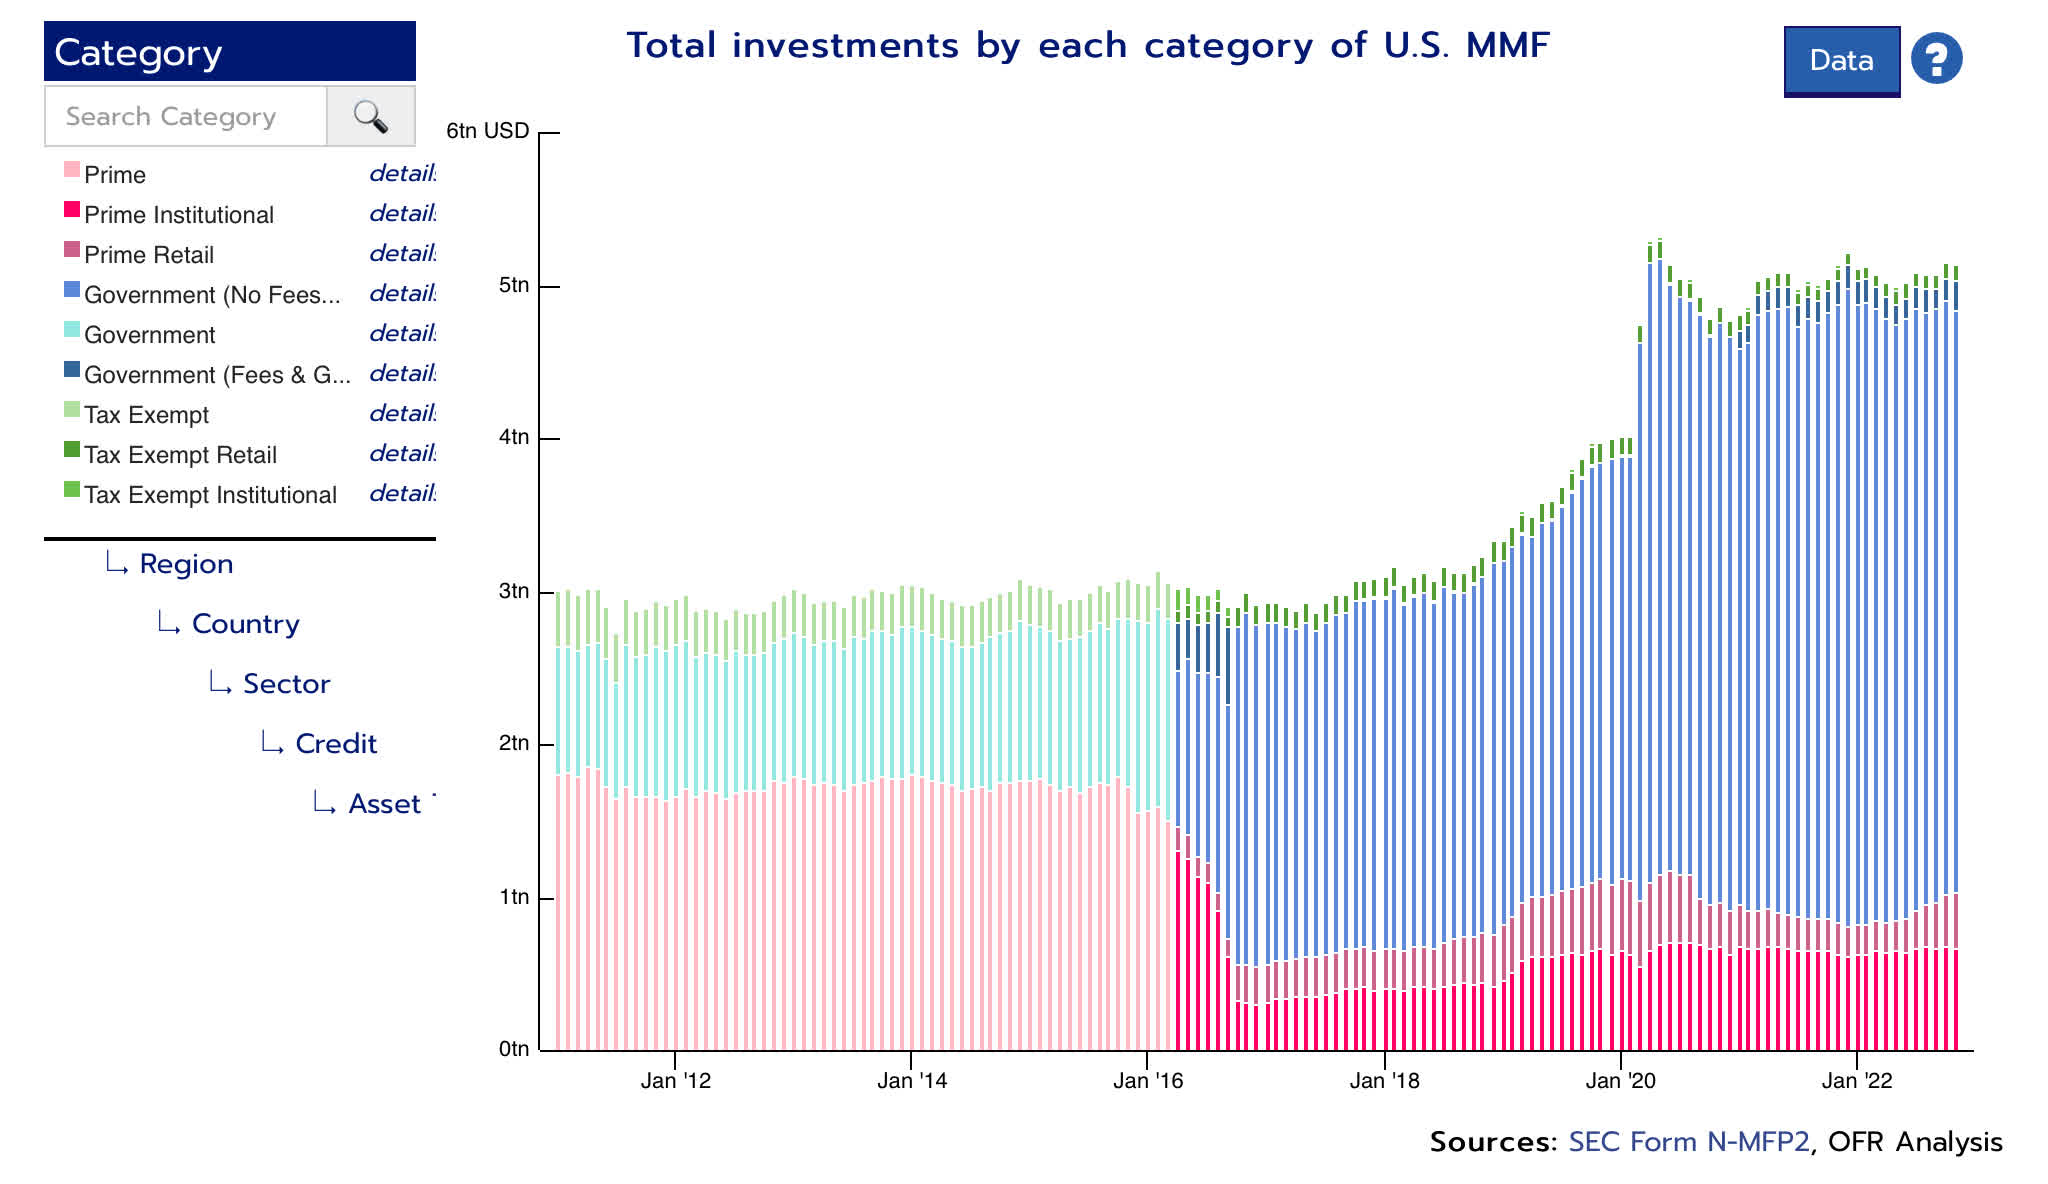
Margin Debt
Margin debt has come down to pre-pandemic levels, which is also supportive when the stock market starts an uptrend.
FINRA Margin Debt (Y Charts )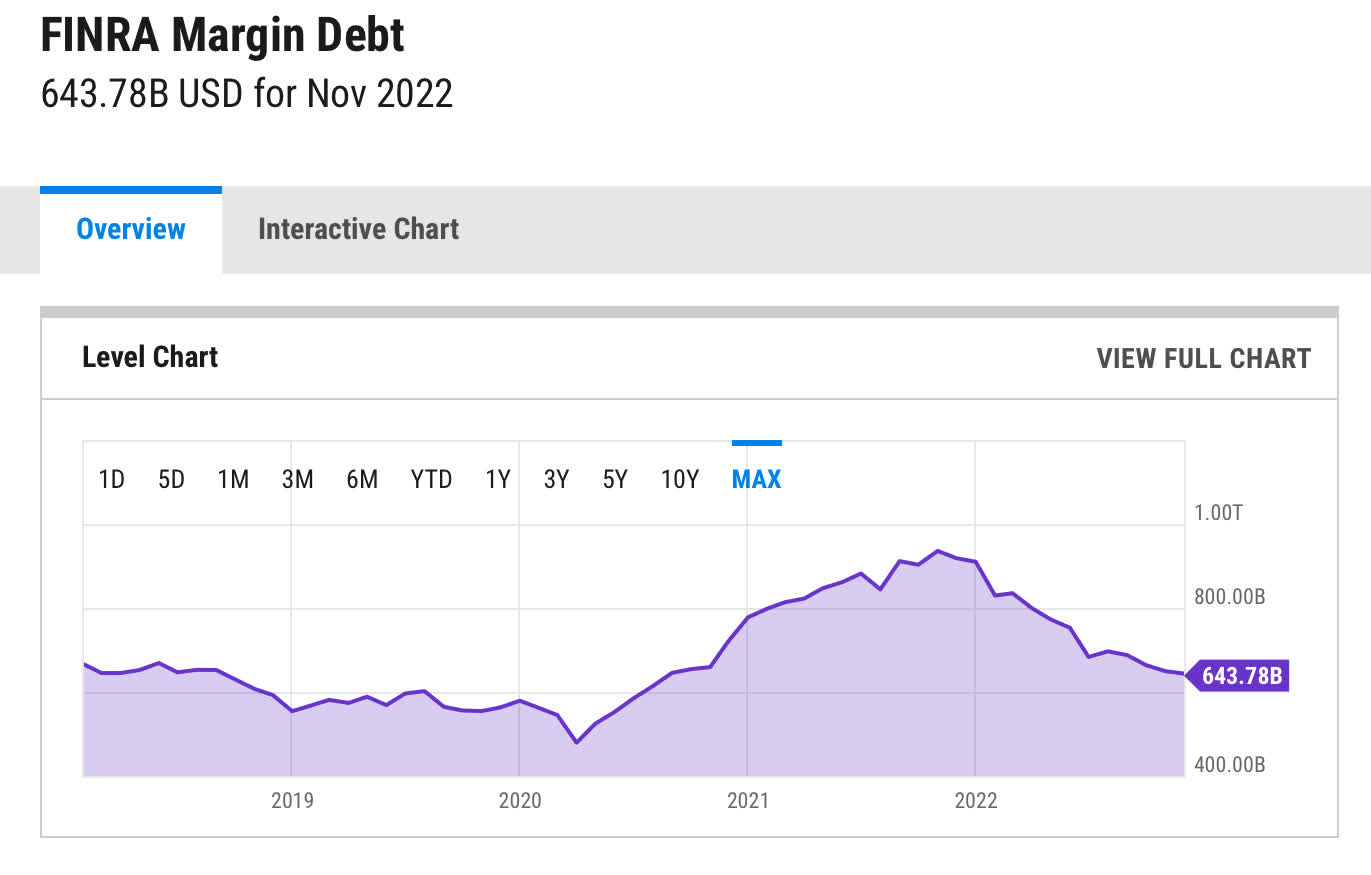
Stock Market & Earnings
The stock market’s bottom well ahead of earnings as shown below. The stock market will bottom months and even a full year before earnings bottom or economic growth picks up. The stock market is discounting nominal earnings well ahead of the economy.
S&P 500 bottom & Earnings (BEA)
Economic Indicators
The economic indicators show a slowing in economic activity and are now in contraction territory. Leading Economic Indicators are dropping quickly, as the Federal Reserve has increased Federal Funds Rate at the steepest rate experienced by the U.S. economy in decades.
LEI 6 month growth rate (The Conference Board)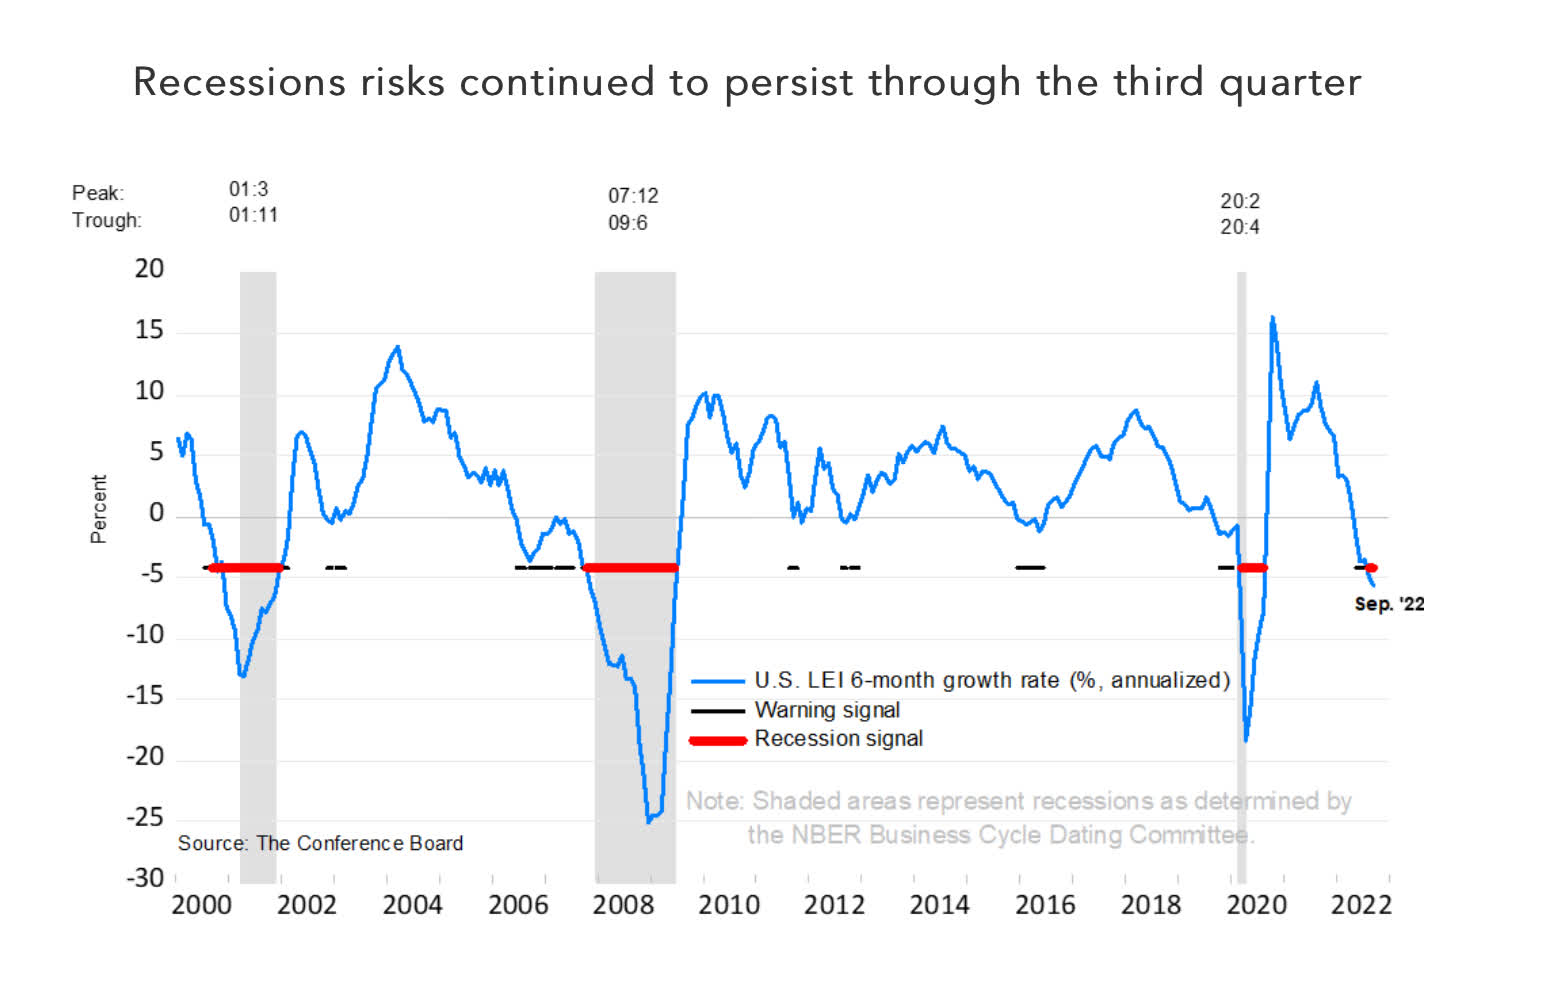
The services PMI went below 50 last month, which increases the likelihood of an economic slowdown in 2023.
Services PMI (ISM)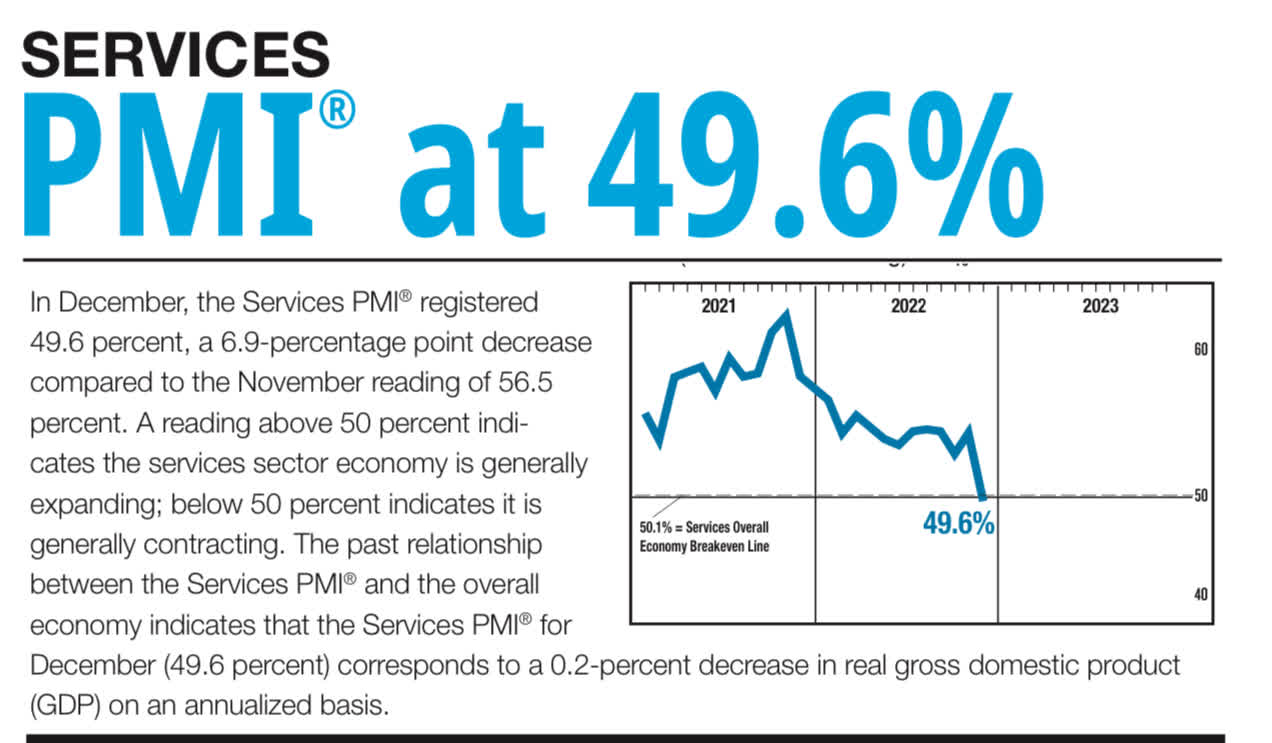
The manufacturing PMI has been below 50 for the past 2 consecutive months.
Manufacturing PMI (ISM)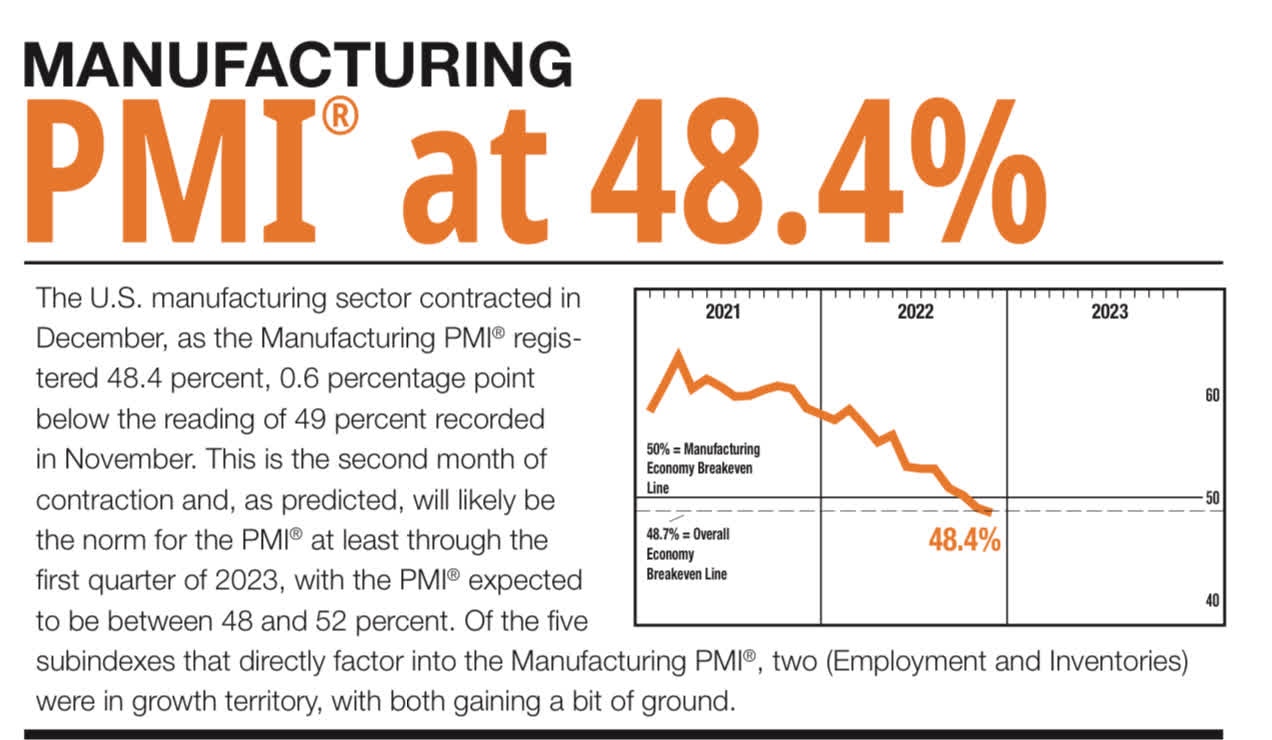
Inflation is falling quickly in spite of the fact that the rent component of the CPI is lagging by months and is still showing rents still increasing. In the coming months, both commodities and the lagging shelter component (largest percentage of CPI) will put downwards pressure on inflation. Last 6 months annualized CPI is below 2%.
CPI (Trading Economics)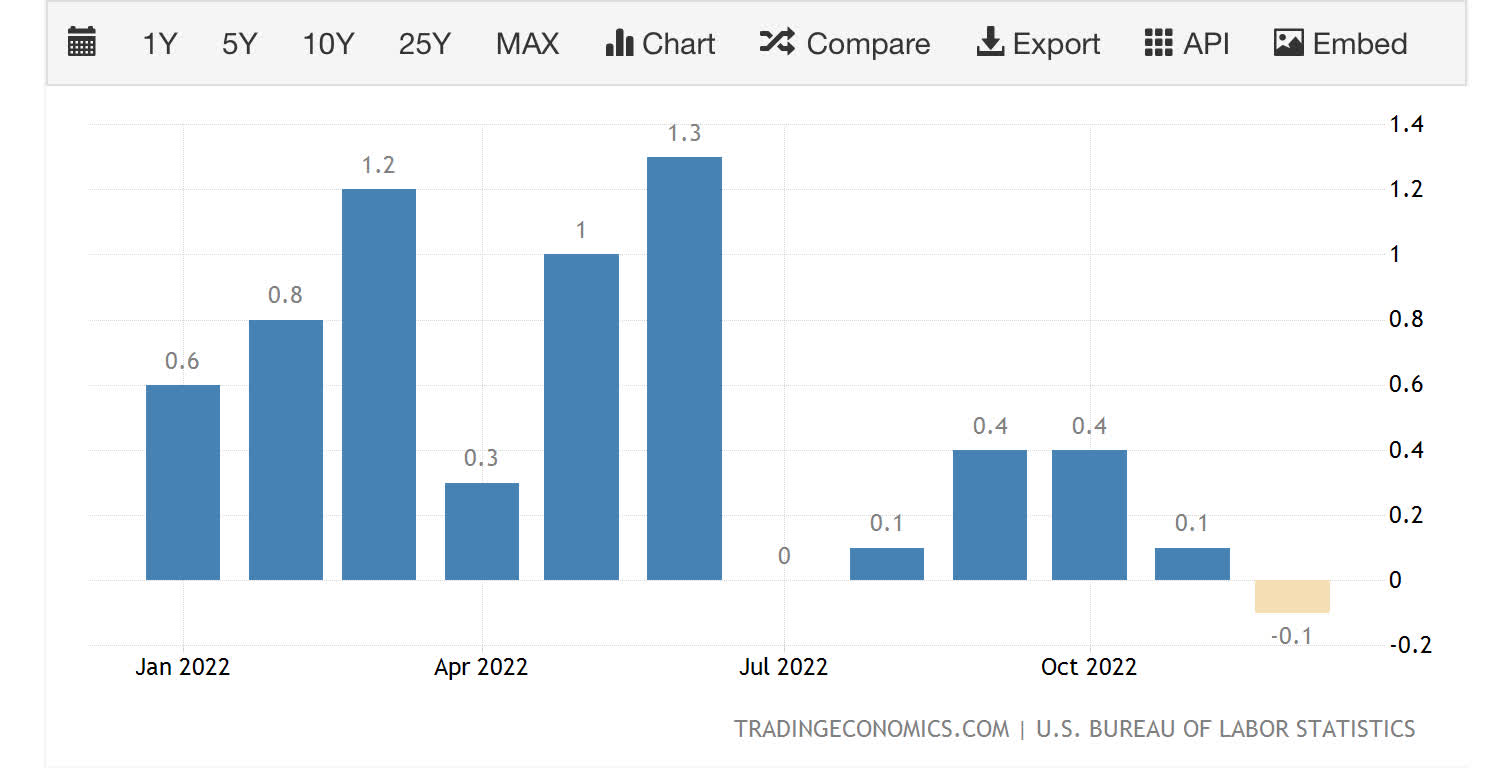
Fed Recession Forecast
The Fed is predicting near 50% probability of a recession. In the past 60 years, the New York Federal Reserve model has been fairly good at predicting a recession.
Fed Recession Model (New York Federal Reserve)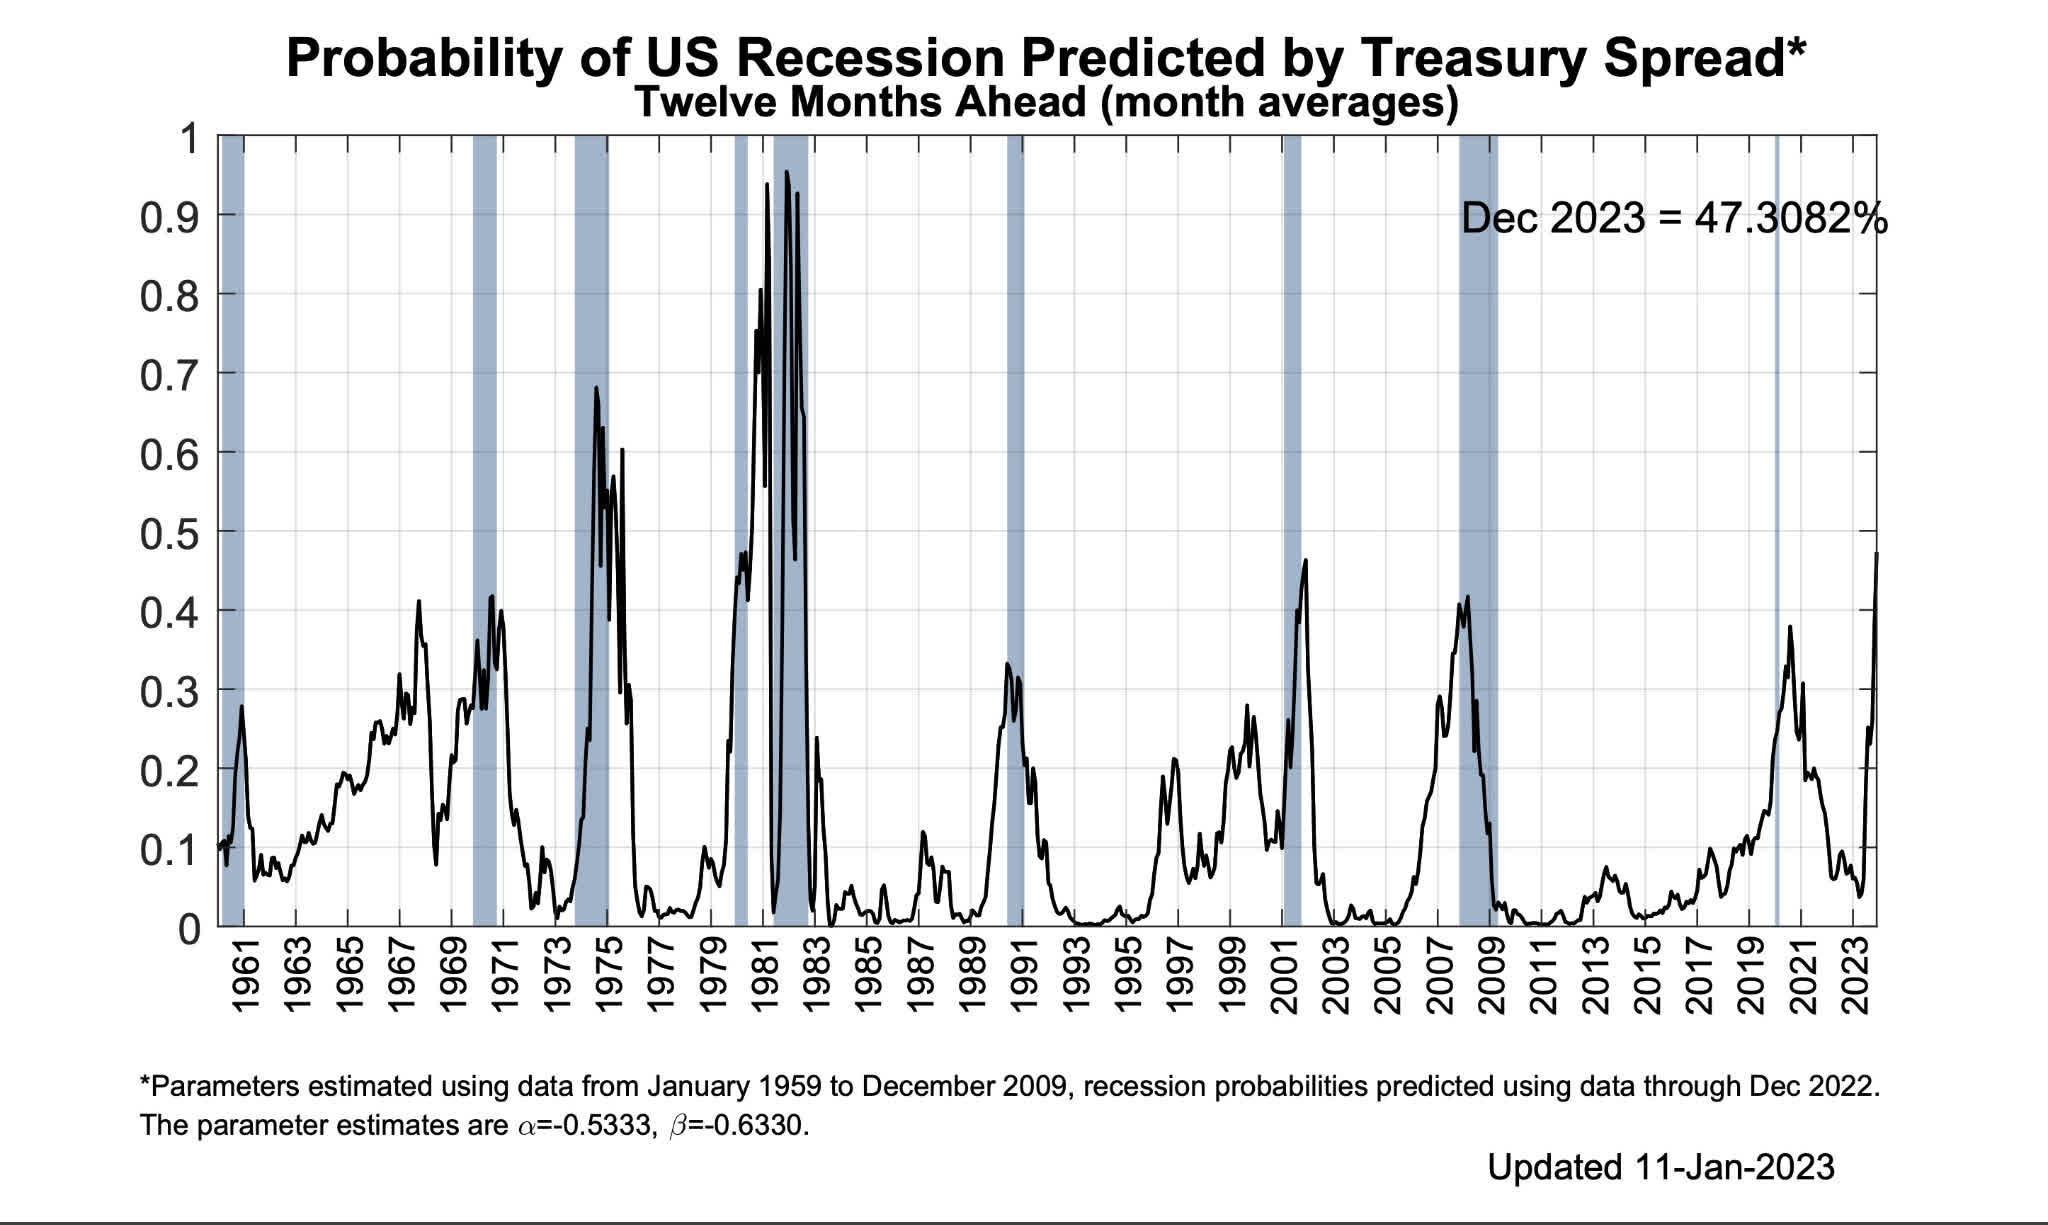
Summary
The economy is likely to experience a slowdown. However, the question remains if the stock market has fully discounted earnings for the next year and is comfortable with valuations. Even if there are green shoots, it is possible that the stock market does go down if unexpected news, that is not already priced in by the stock market, comes out. The inflation report last week continues to show a sharp drop in inflation. The earnings season has begun, and it will be instrumental in determining if the stock market is going to move higher or back down, which would retest the lows from October 2022.
I would not be impatient and would wait to see how stocks react to earning. Although, I would be ready to deploy new cash if earnings and guidance receive a positive reaction from the stock market.
Be the first to comment