

JHVEPhoto
If you have read my October 2nd article on Google (GOOGL) (NASDAQ:GOOG) The clouds get darker for Google (link) it was to ring true with earnings released in late October showing a miss on top and bottom lines. However, Google has seen a bullish turnaround on the lower timeframes with investors finding appetite for this equity at its current valuation.
In this article, we will examine both Google earnings and move to the charts to forecast what the next move could be.
Firstly we will re-visit my forecast target paragraph from early October’s publication :
“I would expect Google to arrive at its $81 target within the next 60-120 days. I will be looking at how it reacts both now at this price area and $81 should it reach that for signals of a bullish turnaround”
The only surprise so far has been that the target area was neared within 45 days and the wave has not technically completed by bottoming so far at the $83 region. However, we are witnessing a clear buy up in Google stock at this price level and will cover this after looking into Google’s latest earnings report.
According to CNBC, earnings per share (EPS): $1.06 vs. $1.25 expected, according to Refinitiv estimates.
Revenue: $69.09 billion vs. $70.58 billion expected, according to Refinitiv estimates.
YouTube advertising revenue: $7.07 billion vs $7.42 billion expected, according to StreetAccount estimates.
Google Cloud revenue: $6.9 billion vs $6.69 billion expected, according to StreetAccount estimates
Traffic acquisition costs (TAC): $11.83 vs $12.38 expected, according to StreetAccount estimates
Revenue growth slowed to 6% from 41% a year earlier as the company contends with a continued downdraft in online ad spending. Other than one period early in the pandemic, it’s the weakest period for growth since 2013.
YouTube ad revenue slid about 2% to $7.07 billion from $7.21 billion a year ago. Analysts were expecting an increase of about 3%. Alphabet reported overall advertising revenue of $54.48 billion during the quarter, up slightly from the prior year.
Philipp Schindler, chief business officer for Google, said the company saw a pullback in spend on search ads from certain areas such as insurance, loans, mortgage and cryptocurrencies.
Now we can look at the monthly chart below and see that the wave has seen a dive into the target region but falling short by a couple of dollars. Currently this monthly candle is showing a large wick carrying price higher from $83.
Google Monthly Chart (C Trader )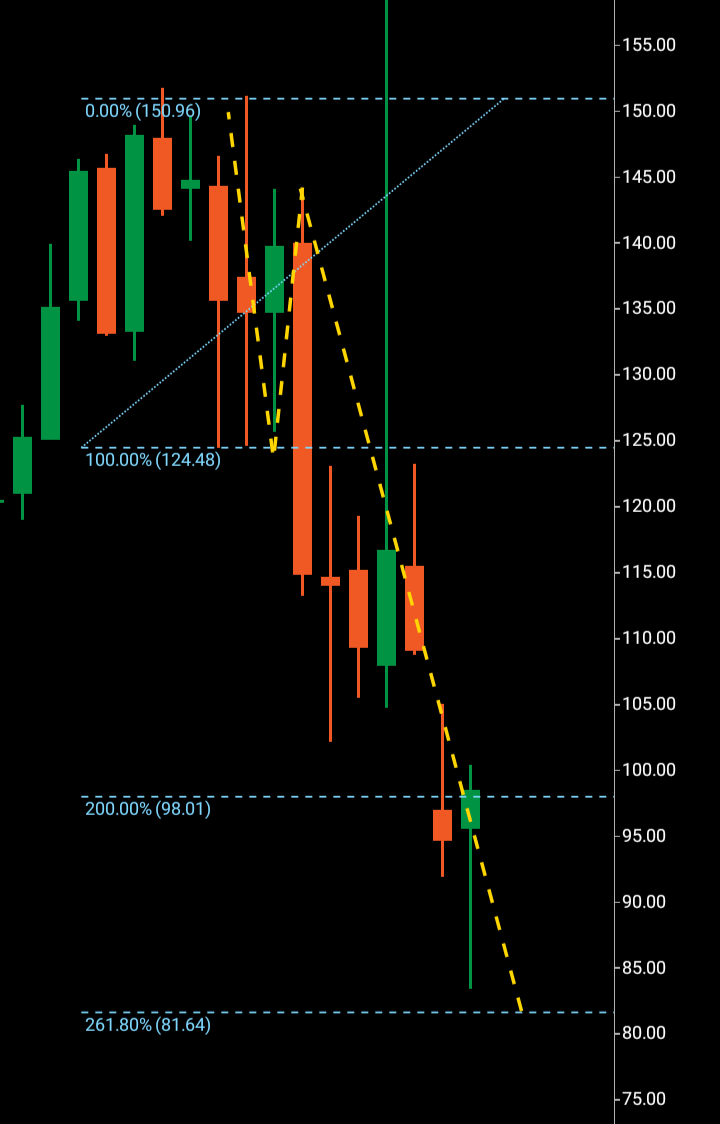
Now moving firstly to the daily chart below we can see the three wave structure in place with the rejection at the $90 region. The three wave move has already completed at $97 and currently is residing between the Fibonacci 261 and the former level.
Google daily (C Trader )
But it is the weekly chart that is the most interesting, a daily timeframe can lay a footprint for a macro move of course but it is when the weekly timeframe forms a rejection candle which paves the way for the third wave north can an actual bottoming at $83 be taken more seriously.
Google weekly (C Trader )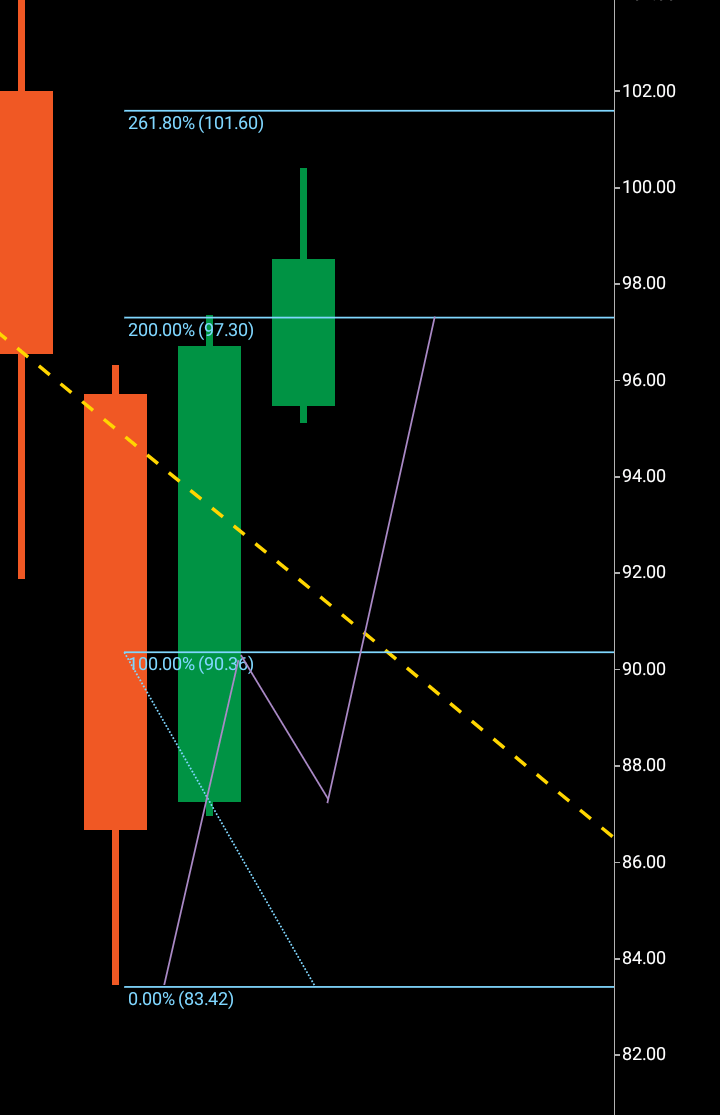
The weekly chart is printed amongst the skeleton of the daily wave pattern, it is possible that the rejection may form on the weekly chart at or around the $101 area which is the Fibonacci 261 from the daily pattern. If this turns out to be the case, and for the moment that is an (if) Google would have a third wave that would take it towards the $120 region should this transpire and the third wave break above the rejection if it comes.
To finalize, it is possible that Google has not bottomed at $83. The second case is that it has, once again a three wave pattern forming on the weekly chart will heighten the probability that it has. Another option is that the weekly timeframe does not form a three wave pattern and looks to break below $83 and in a very bullish case, the weekly bullish action continues and breaks above the $100 area and continues to drive higher before forming a rejection. If this bullish action does continue the eventuality will be that a macro monthly wave pattern will form, for the investors buying to this stock at this point, this is what they will be looking for.
About the Three Wave Theory
The three wave theory was designed to be able to identify exact probable price action of a financial instrument. A financial market cannot navigate its way significantly higher or lower without making waves. Waves are essentially a mismatch between buyers and sellers and print a picture of a probable direction and target for a financial instrument. When waves one and two have been formed, it is the point of higher high/lower low that gives the technical indication of the future direction. A wave one will continue from a low to a high point before it finds significant enough rejection to then form the wave two. When a third wave breaks into a higher high/lower low the only probable numerical target bearing available on a financial chart is the equivalent of the wave one low to high point. It is highly probable that the wave three will look to numerically replicate wave one before it makes its future directional decision. It may continue past its third wave target but it is only the wave one evidence that a price was able to continue before rejection that is available to look to as a probable target for a third wave.
Be the first to comment