

tomch
Thesis
Recent selloffs have sent the tech sector into a technical bear market. As you can see from the following chart, the tech sector, represented by Invesco QQQ Trust (QQQ), has suffered a total loss of almost 30% off its recent peak level. And Google, or Alphabet Inc. (NASDAQ:GOOG) (NASDAQ:GOOGL), has suffered a similar loss of 32% off its recent peak. In the next chart, you will see that such a correction, when combined with their earning potentials, has compressed their valuation substantially and created an entry opportunity after a long bull run.
Source: Seeking Alpha data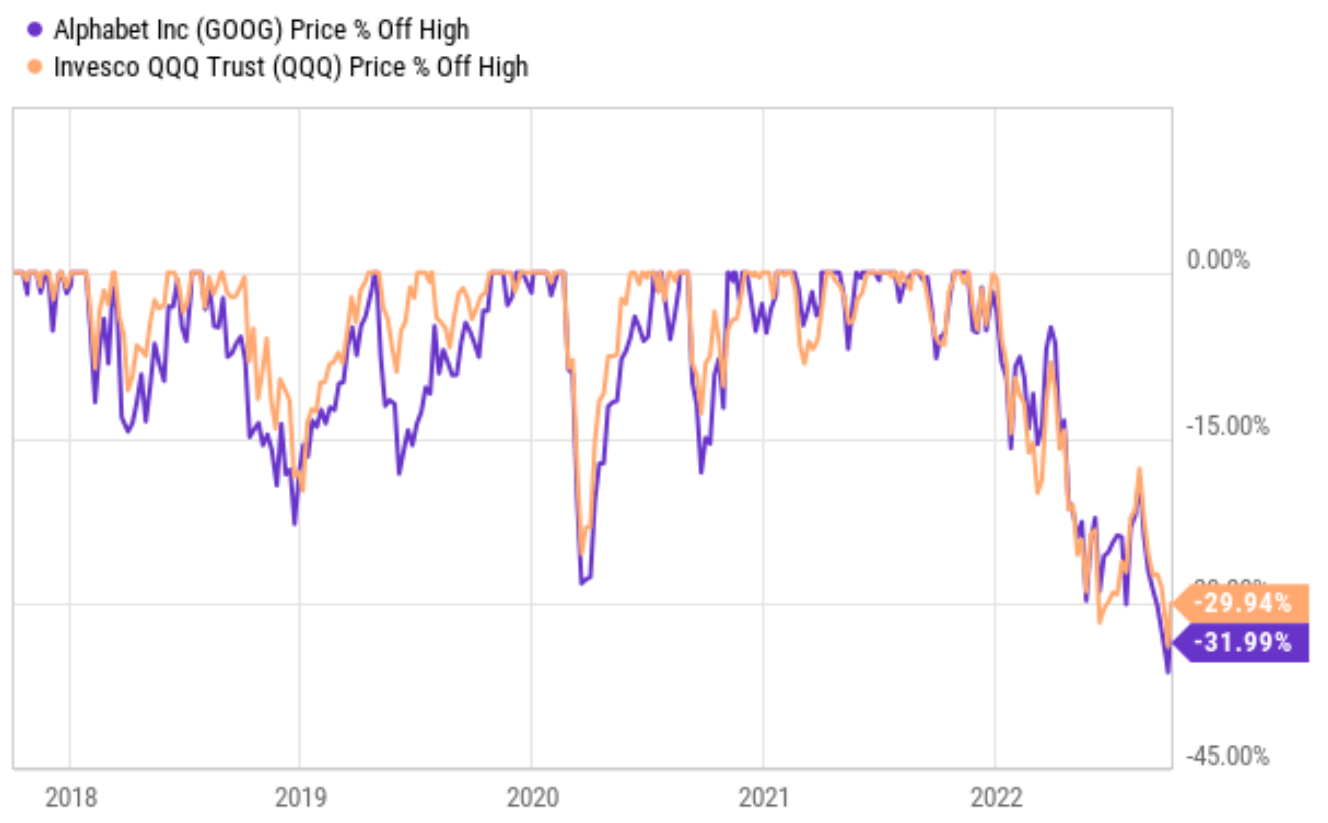
GOOG is currently trading at a PE of 18.15x as seen from the chart below. Considering the fact that it has a sizable cash position on its balance sheet, its true valuation is even lower. As of this writing, its total cash position is $125.0B and its total debt is only $28.81B, leading to a net cash position of more than $96B. When the net cash position is adjusted for, its PE is only 16.47x. Such valuation is the most attractive in a decade, as you can see. The last time its valuation has been compressed so severely was back in 2014. Its current valuation is not only compressed against its own historical record, but also against other peers and the broad sector. For example, its PE is about 22% cheaper than AAPL (whose PE TTM is 23.58x) and 26% cheaper than MSFT (whose PE TTM is 24.61x). It’s also cheaper than QQQ (which trades at 22.01x PE according to Yahoo Finance) by about 18%.
It’s debatable whether GOOG should trade at the same valuation as AAPL or MSFT – that would be a topic for a different day. However, I have little doubt that GOOG should trade add a valuation premium, not a discount, compared to QQQ because it provides far superior profitability and growth compared to the broader sector, as to be argued in more detail next.
Source: Seeking Alpha data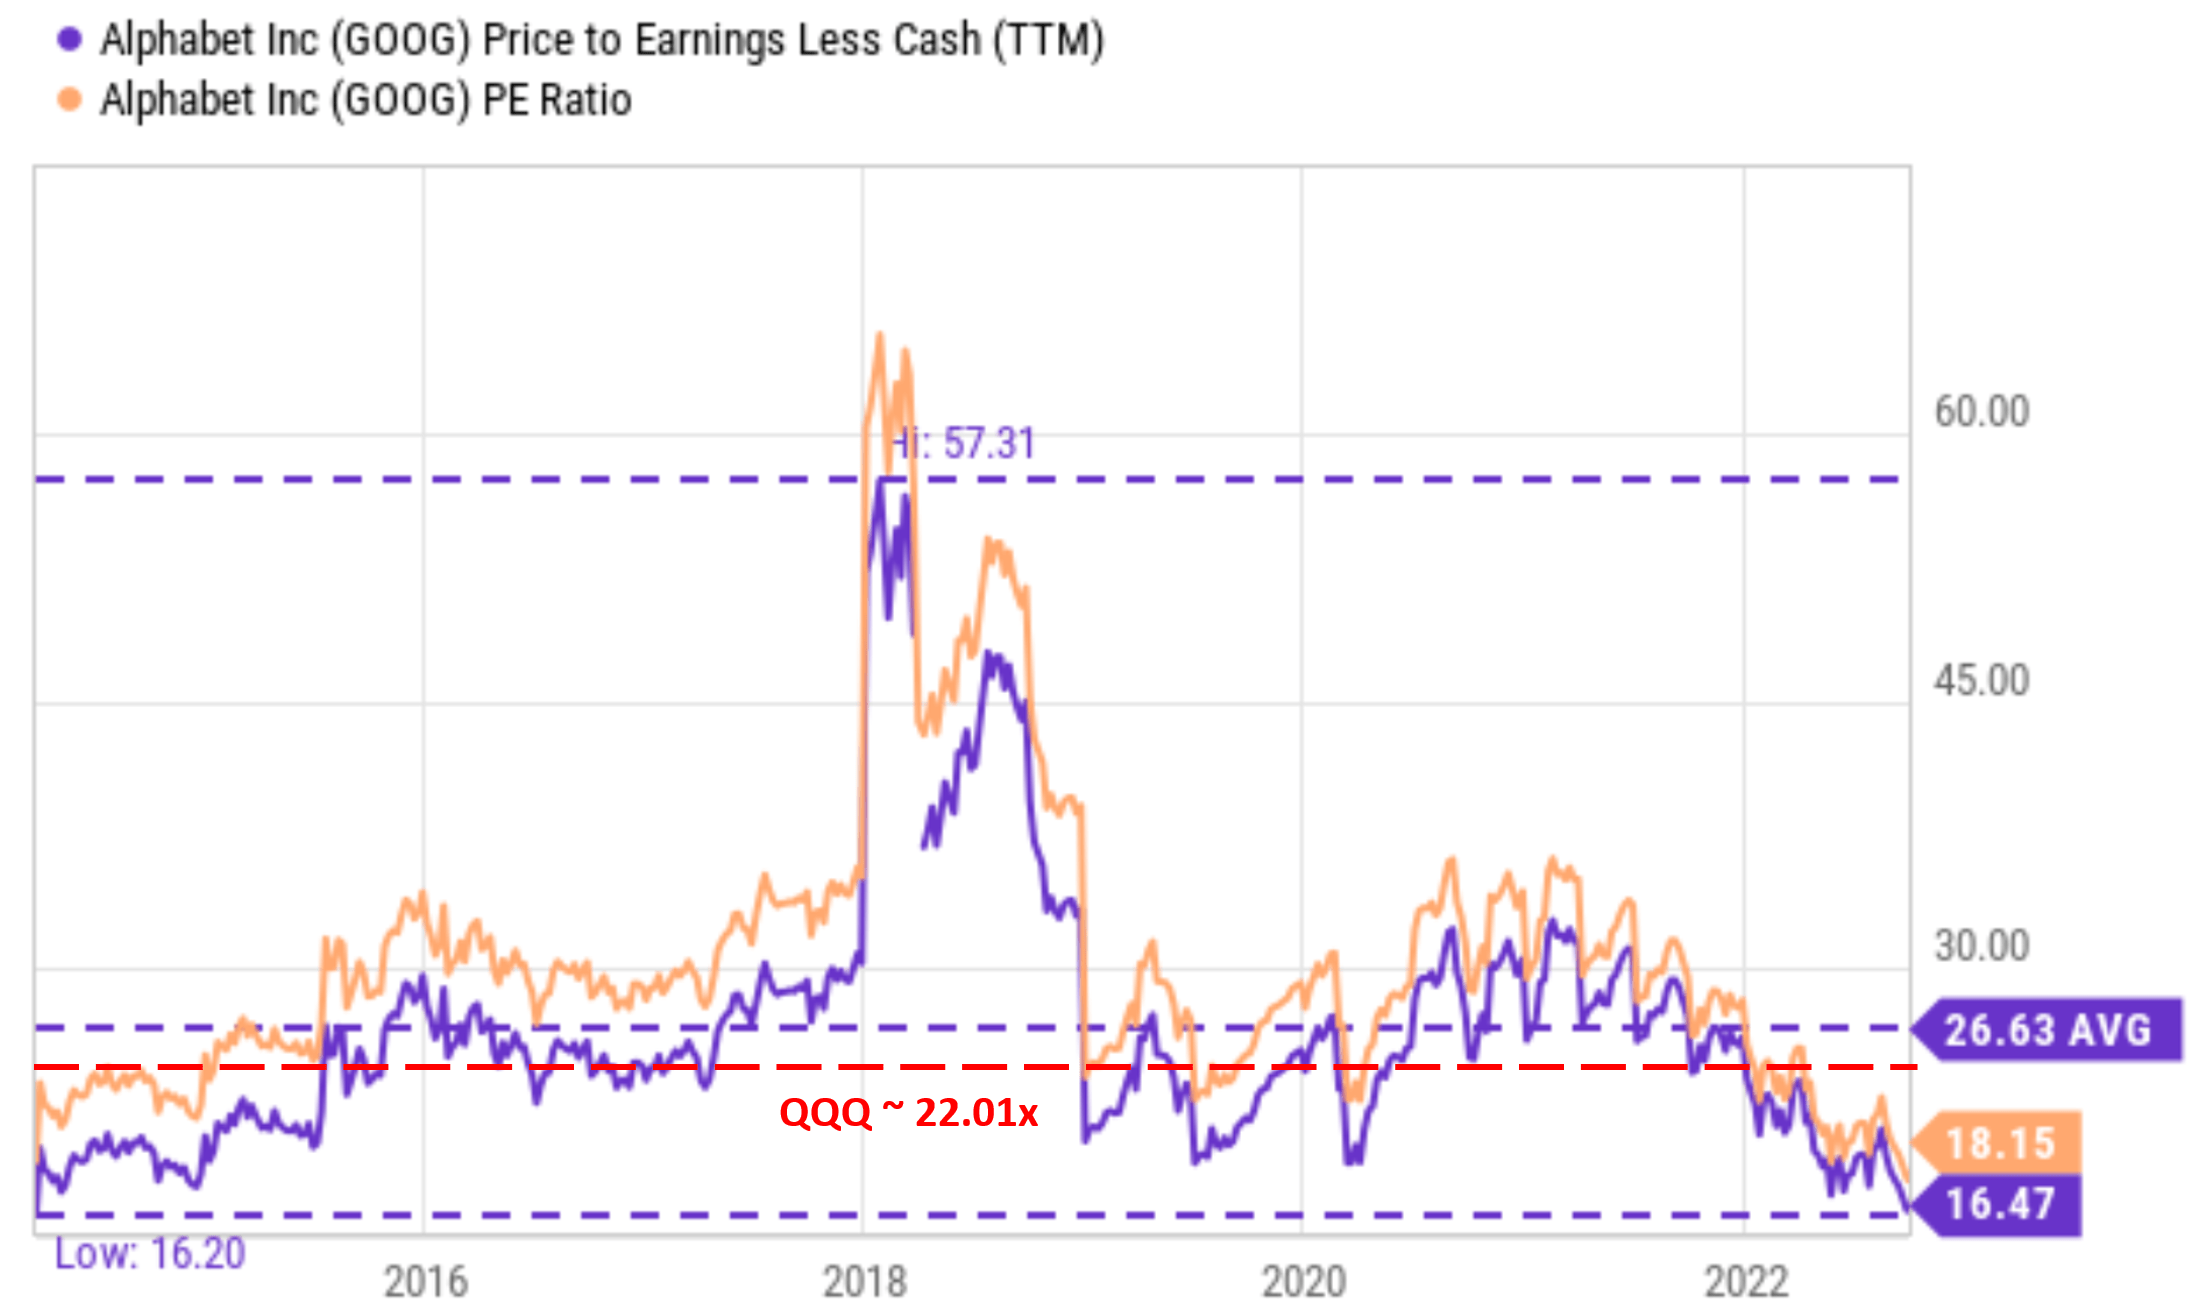
GOOG’s superior profitability and growth potential
The following chart shows GOOG’s profitability in terms of ROCE (return on capital employed), the most important profitability metric in my view. And this chart also compares it to the rest of the FAAMG group and also QQQ. As can be seen, the ROCE of GOOG is on average about 54% in recent years. Admittedly, its ROCE is slightly lower than MSFT and substantially lower than AAPL (that’s why I mentioned above it is debatable whether it should trade at the same valuation as these two). But its ROCE is far better than the overall sector represented by QQQ, whose ROCE is about 40.6%. Note that here I’m using ROE data obtained from Yahoo finance to approximate the ROCE of QQQ. For a whole, sector, ROCE is a reasonable approximation for ROCE as detailed in my blog article here.
Source: Author based on Seeking Alpha data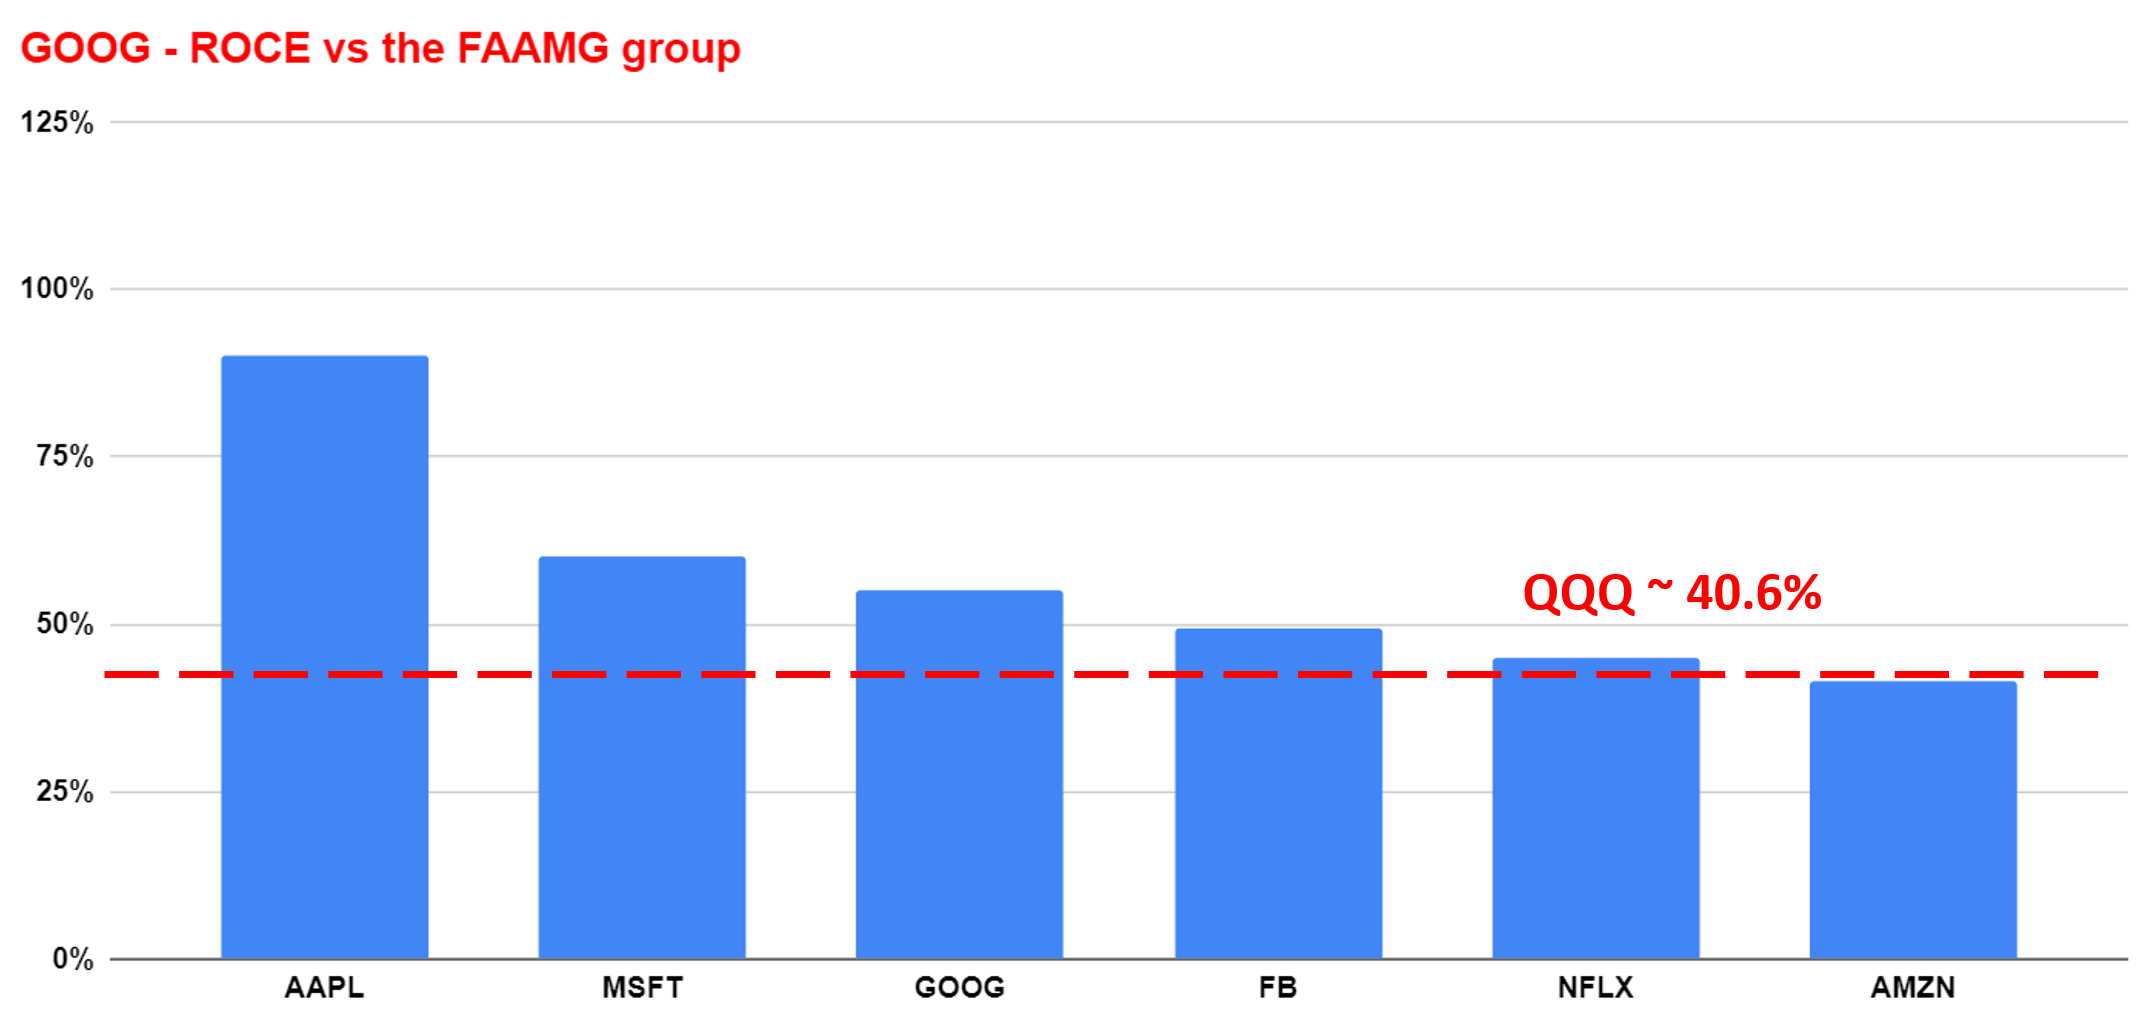
Looking forward, I’m expecting GOOG’s superiority over the sector to further expand given its scale, technological lead, and also its initiative. It’s one of the best-run tech companies with well-diversified revenue streams, as you can see from the following chart. A few notable examples. It derives 79.89% of its revenues from Web-Based Data and Services. And its cloud services are a jewel of the crown in this fast-growing segment. At the same time, it’s a leader in digital advertising (a duopoly with Meta Platforms). And its Marketing and Advertising Services segments contribute 24.84% of its total revenue. Finally, it also has a hardware segment that’s well integrated into its data-driven platform, its Wireless Mobile Equipment segment contributes 8.24% of its total revenue.
In contrast, QQQ’s exposure is shown in the right panel of the chart below. As seen, there are good reasons why it’s the most popular tech sector ETF. It provides convenient exposure to a broad range of tech companies. And the largest exposures are Technology Services (30.09%) and Electronic Technology (28.51%). These two sectors combined represent a total of 58% of QQQ’s exposure. The remainder, 42%, however, is less techy. For example, QQQ holds a good portion of healthcare stocks (6.19%), consumer staples (5.51%), and even some industrials (2.59%) and utility stocks (1.5%).
Of course, there’s nothing wrong to have exposure to less technological stocks of course depending on your risk profile and investment goals. However, when growth is concerned, especially at a cheap valuation, my view is that GOOG’s segments would enjoy a far better growth curve than the sector average represented by QQQ.
Source: Merrill Edge and ETF.com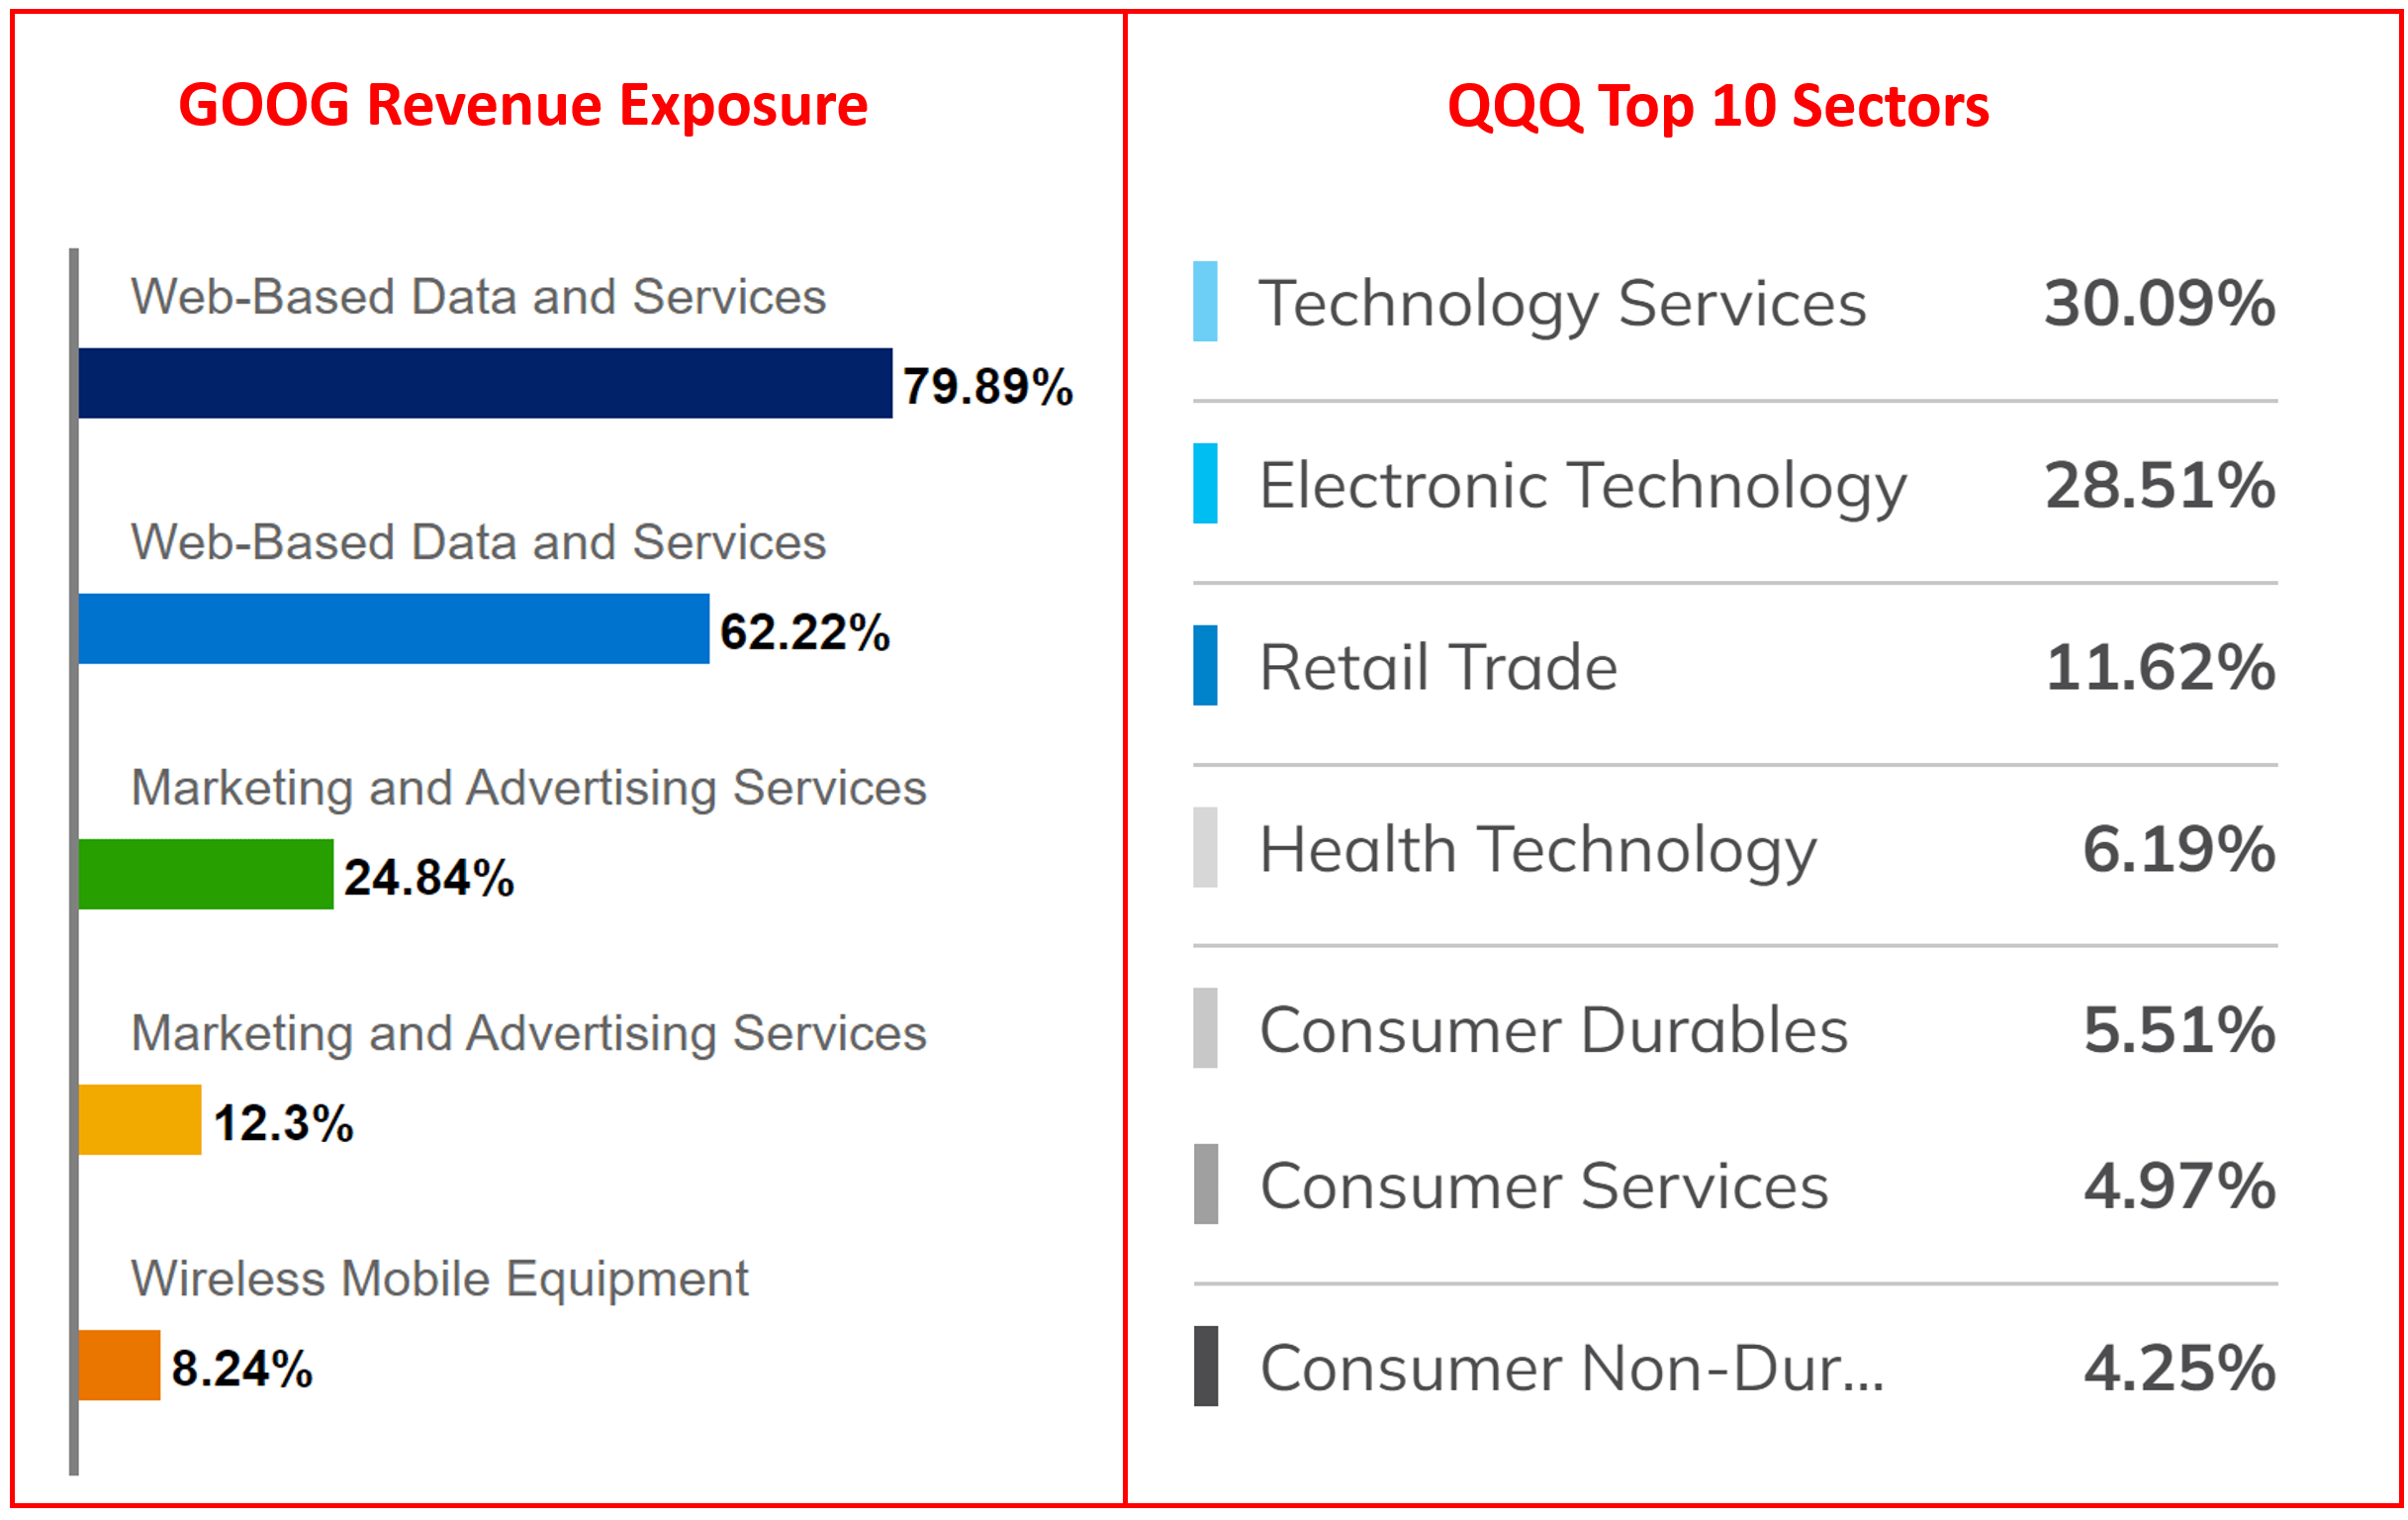
GOOG’s projected return potential
The next chart put it on our investing roadmap. It’s what we use ourselves and for our marketplace service to pick our tactical holdings. As you can see, GOOG is projected to provide a double-digit annual return (“ROI”) in the range of 11.1% to about 11.8% given its PE in the range of 16x to 18x depending on how you adjust its cash position. This projection also assumed a 10% reinvestment rate. While the QQQ fund is projected to return about 8.5% (again, not bad thanks to the recent corrections). The building of this roadmap is detailed in our earlier article. In short,
- The long-term ROI for a business owner is simply the summation of two things: A) the price paid to buy the business and B) the long-term growth rate of the business. More specifically, part A is determined by the owner’s earning yield (“OEY”) when we purchased the business.
- Part B, the long-term growth rate, is governed by ROCE and the Reinvestment Rate. These are the two most important growth engines, and they mutually enhance each other.
- Longer-Term ROI = valuation + quality = OEY + Growth Rate = OEY + ROCE*Reinvestment Rate.
So for GOOG, its perpetual growth rate is projected to be about 5.5% assuming 10% reinvestment rate (55% ROCE * 10% reinvestment rate = 5.5%). And at its current price level, the OEY is ~6.06% based on a PE of 16.5x adjusted for its cash position or 5.4% based on its nominal PE of 18.7x. In each case, the total return is in the double-digit range. In contrast, QQQ would provide both a lower growth rate (due to its lower ROCE of around 40%) and also a lower OEY (due to its higher valuation at PE ~22x), leading to a lower total return.
Source: Author based on Seeking Alpha data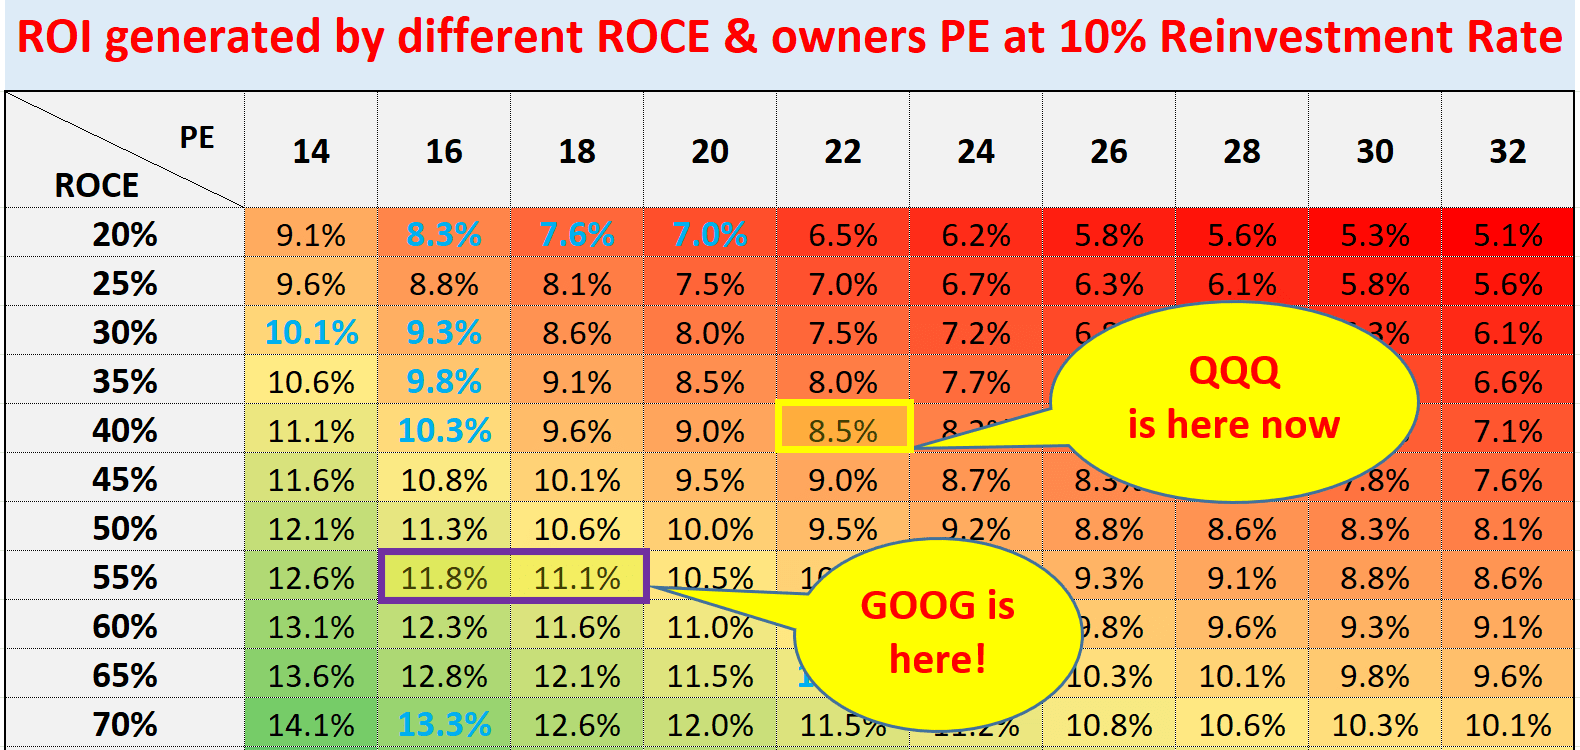
Risks and final thoughts
In terms of risks, GOOG is subject to ongoing macroeconomic and geopolitical risks. Although there are a few risks that are more relevant to GOOG than the general tech sector. First, GOOG faces large currency headwinds given the peak dollar strength. The sector represented by QQQ faces some currency headwinds too given the foreign revenue exposure. However, GOOG is more global than the sector in general and therefore more sensitive to currency exchange rate fluctuations than the average sector. GOOG probably has over-expanded in recent years, and so did the sector represented by QQQ. However, again, GOOG’s over-expansion is probably more server than the average sector. GOOG’s total headcount increased by almost 30k over the past year alone from 144,056 in Q2 2021 to the current 174,014. It is a more than 20% expansion in one year. Such over-expansion may have created some overcapacity.
To conclude, recent selloffs have created an entry opportunity to the tech sector after a long bull run. The sector has been extremely overvalued at the end of 2021 and the earlier part of 2021 due to the easy money policy and investors’ optimism for future growth. The selloffs have now normalized the valuation of the sector and many of its leading stocks. In particular, GOOG now trades in the range of about 16.5x to 18.7x. As such, GOOG now provides a far superior return profile (my projection is about 11% to 12% per year) than the overall market or the average tech sector thanks to its better profitability, higher growth potential, and also cheaper valuation.
Be the first to comment