

Jose Luis Pelaez Inc
This article was published on Dividend Kings on Tuesday, December 13th.
—————————————————————————————
2022 was an interesting year… to say the least. Consider just these two incredible facts.
- for a week in September, British 30- and 50-year treasuries were 5X as volatile as Bitcoin
- it’s the first year in history where bonds and stocks are both down double-digits
Charlie Bilello
It’s been the most volatile year since 2008. Yet the S&P is down just 15% for the year.
YCharts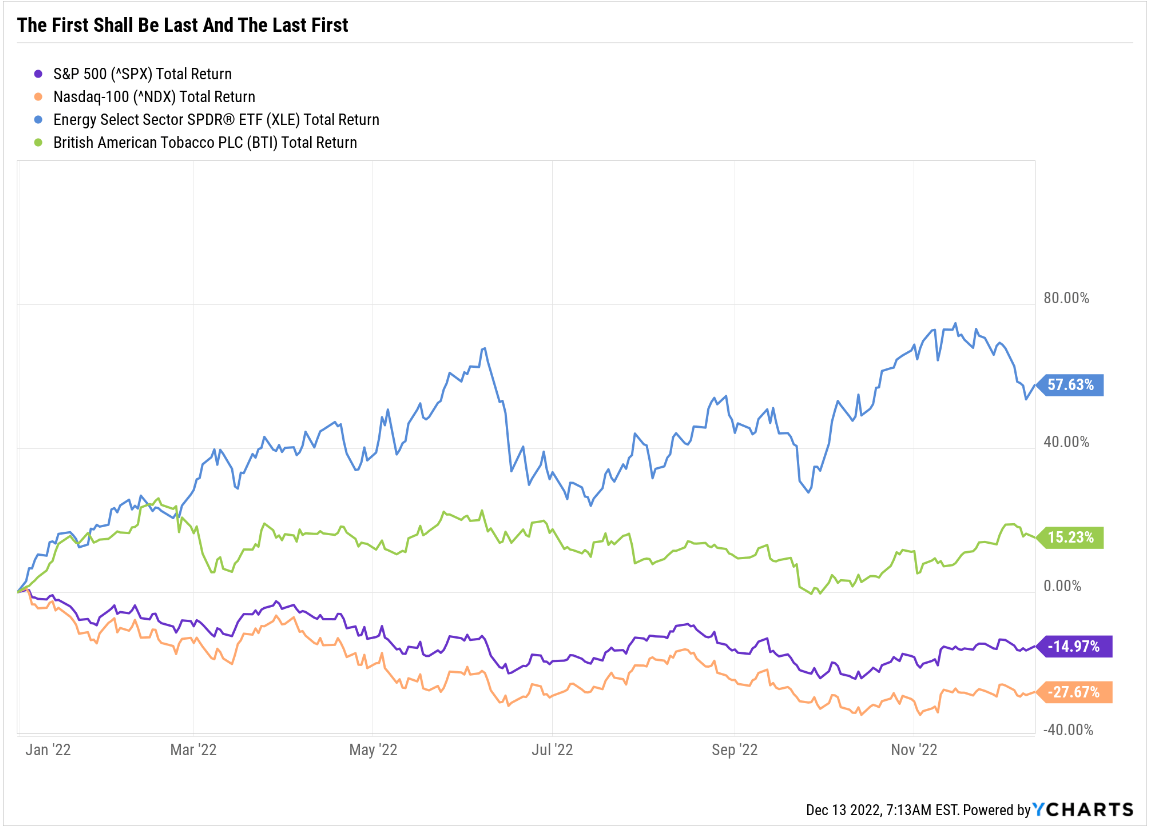
Oil prices have round tripped and are now down on the year. Yet oil stocks are up over almost 60%.
Interest rates rose at their fastest rate in 40 years in 2022 and hit the highest levels in 15 years. So naturally, high-yield “bond alternatives” like British American Tobacco (BTI) should have gotten crushed, right? Actually, BTI is up 15% and one of the darlings of Wall Street.
Daily Shot 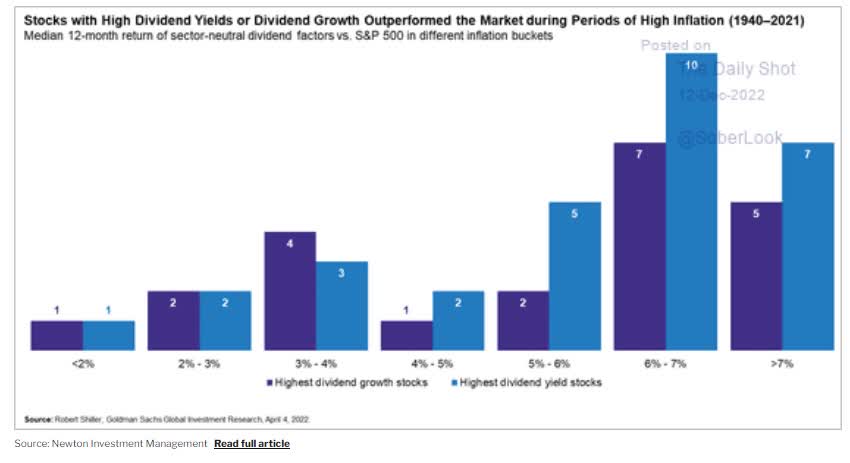
High-yield stocks historically perform the best in periods of high inflation. And guess what? Inflation is expected to remain relatively high for the next few years.
Daily Shot 
That means that value is likely to do well, but the point is that Wall Street is a lot more complicated than you think.
“The main purpose of Wall Street is to make fools of as many men as possible.” – Bernard Baruch
If you knew a once-in-a-century Pandemic was coming in 2020 that would shut down the global economy and cause GDP to fall at a 32% annual rate in Q2, you certainly wouldn’t have guessed stocks would finish the year up 18%.
If you knew that inflation would take off in 2021, you wouldn’t have guessed that stocks would have rallied by almost 30%.
And if you knew that 9.1% inflation was coming, you probably would have thought that gold would finally work after a decade of suck.
YCharts
Gold is down 5% during the worst inflation in 42 years and down 15% adjusted for inflation.
The point is that you can find all manner of plausible-sounding stories on Wall Street that sound smart and might make you want to change your portfolio.
“Don’t just do something, stand there.” – Jack Bogle, founder of Vanguard
“We believe time, not timing, is key to building wealth in the stock market.” – Bill Miller (beat the S&P 500 15 years in a row)
What is 2023 likely to bring? Most likely a significant stock decline in the year’s first half.
But Fidelity and JPMorgan, and some other blue-chip firms think the bottom is already in.
So how can you know what’s as close to a perfect blue-chip investment opportunity as exists on Wall Street for 2023?
31 Perfect 100% A+ Exceptional Investment Opportunities For 2023
Dividend Kings Automated Investment Decision Tool
By focusing on the fundamentals that drive 97% of long-term returns. In the short-term, stock prices are a crapshoot. In the long-term, they are fundamentals-driven destiny.
So let me show you why Alphabet (NASDAQ:GOOG)(NASDAQ:GOOGL) and Visa (NYSE:V) are two perfect 2023 blue-chip bargains you can safely buy today. Not to feel smart in the next few months, but to feel like a genius in 5+ years.
Alphabet: Buy One Of The Best Dividend Blue-Chips Of Tomorrow… Today
YCharts
GOOG is down as much as 45% in this bear market and is still 37% off its highs.
FactSet Research Terminal
Is that because we’re in an advertising recession? Is it because GOOG’s growth outlook has fallen to low double-digits?
Partially yes, GOOG gets 99% of its revenues from advertising, and so naturally, the growth outlook will deteriorate in a recession.
But I’d like to point out that from 2023 to 2027, GOOG’s five-year growth is expected to be 15.6%, similar to what it’s enjoyed since its IPO.
Statista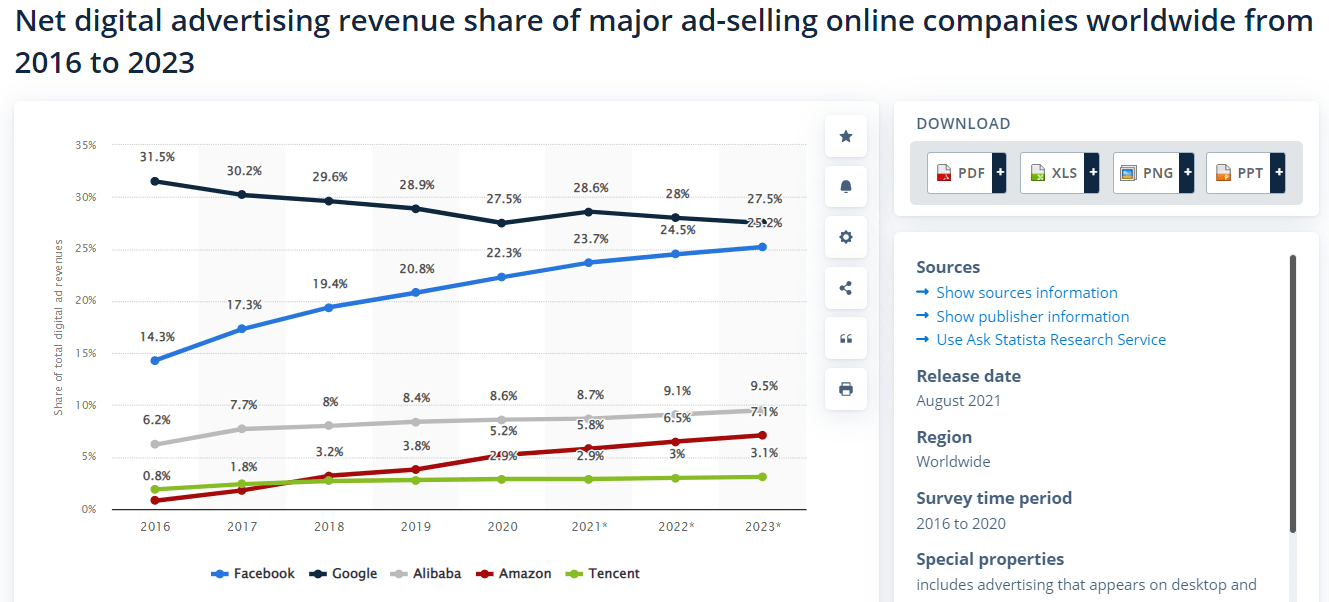
GOOG is the world’s #1 online advertiser, at 28% market share. Unlike Meta (META), Apple’s (AAPL) iOS privacy policy shift doesn’t significantly damage its ad business.
That’s because GOOG has 271 services, including Gmail (1.8 billion users) and Google Drive (over 1 billion users), and YouTube with 2.6 billion users.
In fact, 52% of global internet users use YouTube at least once per month.
Statista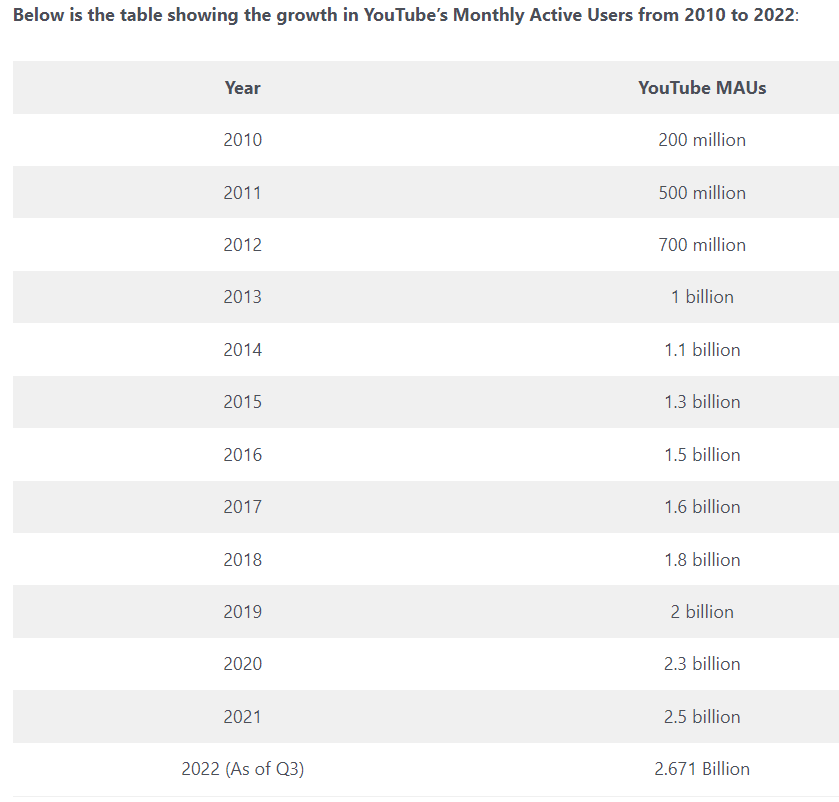
Buy GOOG Today For YouTube
Statista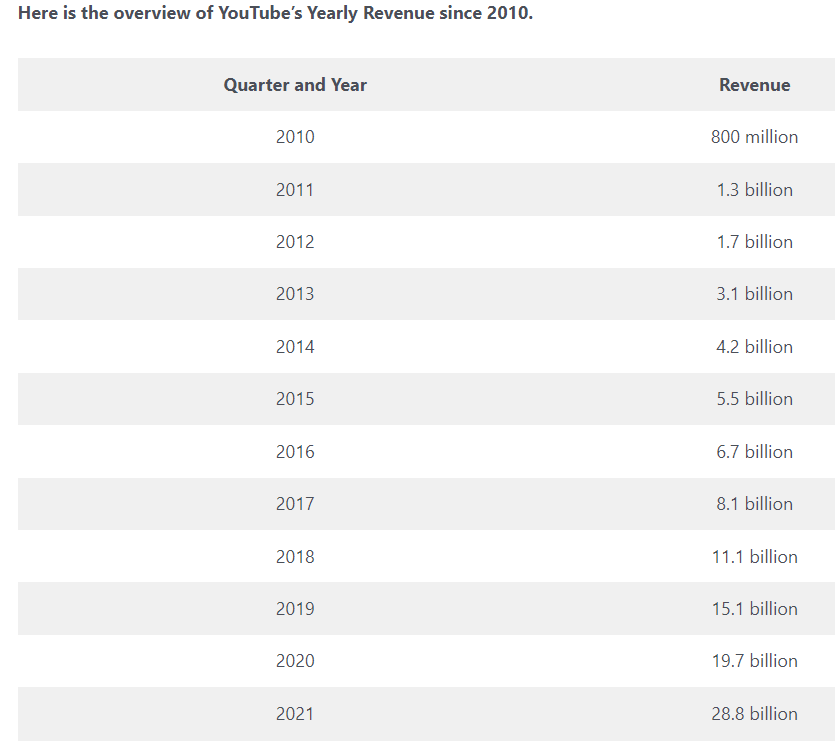
Because YouTube is the 2nd most popular platform for influencers and is the most popular with young people.
Daily Shot 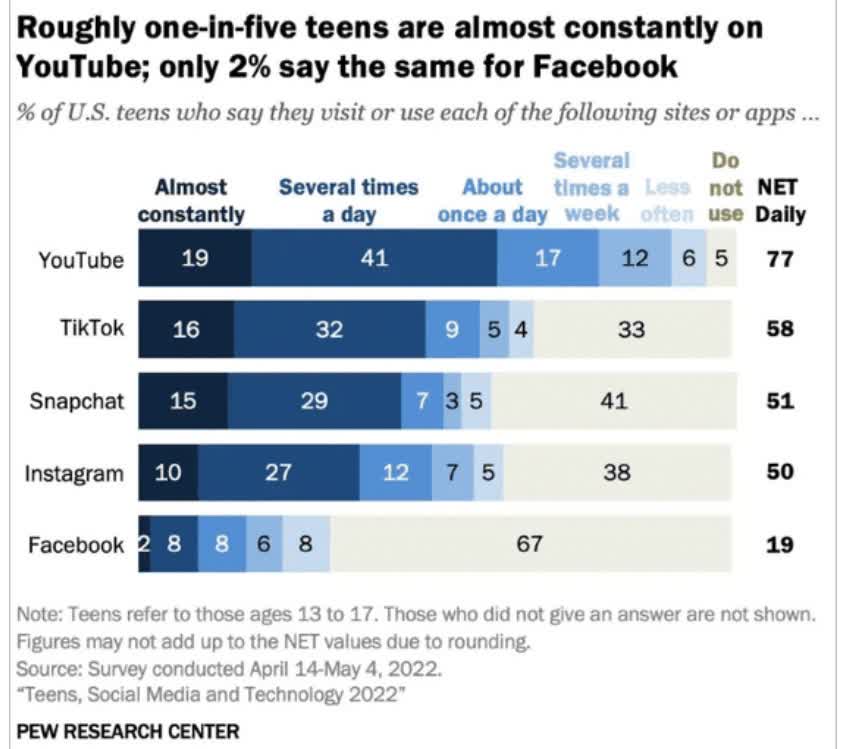
That makes it very valuable to advertisers.
FactSet Research Terminal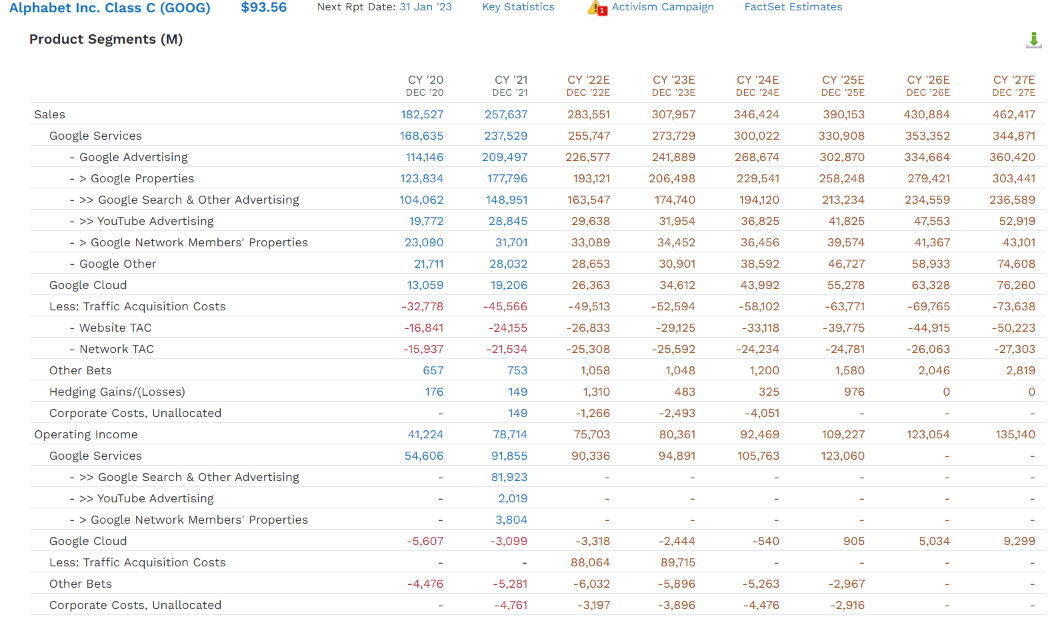
How fast is YouTube expected to grow in the next five years? Almost double from $29 billion in revenue to $53 billion. That’s 12.3% annual growth from an already dominant wide moat social media platform.
And YouTube isn’t even GOOG’s fastest-growing business.
- Google Cloud: 31.8% annually
- Other Bets: 30.2% annually
- YouTube: 12.3% annually
- advertising: 11.5% annually
- total sales growth: 10.2% annually
Buy GOOG for YouTube, but stay for Cloud and other bets (more on this later).
Buy Google For Its Incredible Future Dividend Potential
GOOG doesn’t pay a dividend today, but if it keeps growing at double-digits, it one day will.
Gurufocus Premium 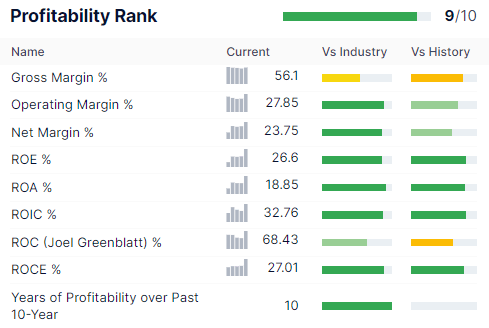
GOOG is historically in the top 10% of its peers for profitability, including excellent 24% net margins and very strong 68% returns on capital.
- 5.3X better returns on capital than the S&P 500
Its free cash flow margins are 26%, meaning one in every four dollars drops straight to the bottom line.
What about GOOG losing market share to the likes of Amazon (AMZN)? Keep in mind digital advertising is growing by about 10% annually and is expected to double to $1.25 trillion by 2030.
Precedence Research 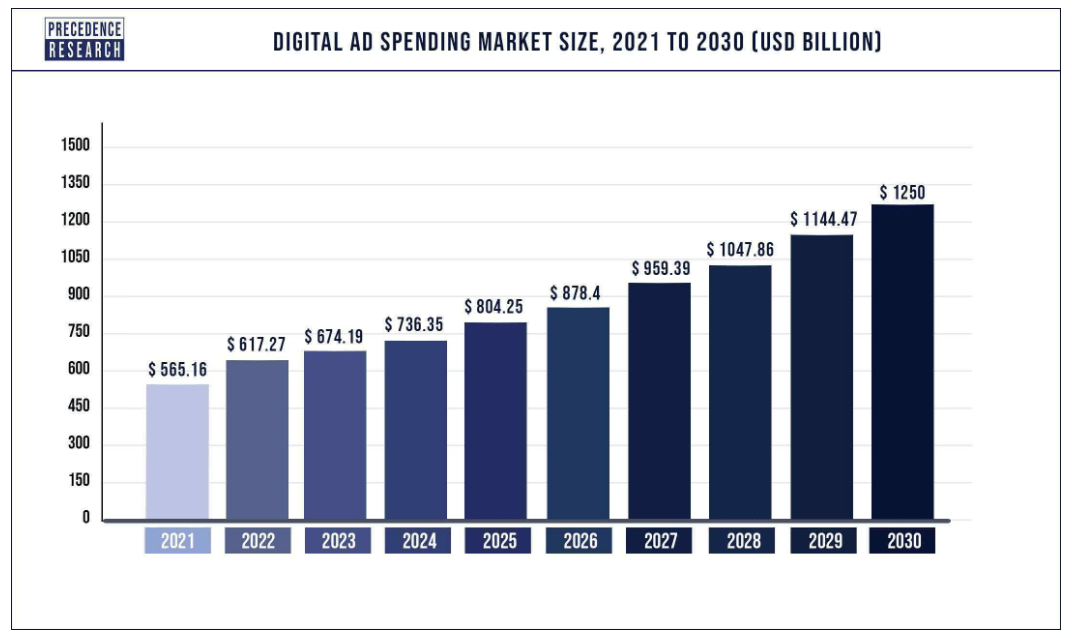
GOOG’s growth runway remains long and strong. And its margin outlook looks stable.
Alphabet Consensus Margin Forecast
| Year | FCF Margin | EBITDA Margin | EBIT (Operating) Margin | Net Margin |
| 2021 | 26.0% | 41.3% | 30.6% | 29.9% |
| 2022 | 23.6% | 39.0% | 26.7% | 22.0% |
| 2023 | 25.2% | 38.7% | 26.1% | 22.2% |
| 2024 | 26.5% | 39.3% | 26.7% | 22.6% |
| 2025 | 27.8% | 40.4% | 28.0% | 23.5% |
| 2026 | 32.7% | 40.6% | 28.6% | 24.1% |
| 2027 | 34.4% | 42.0% | 29.2% | 24.4% |
| Annualized Growth 2022-2027 | 4.75% | 0.25% | -0.74% | -3.27% |
(Source: FactSet Research Terminal)
In fact, GOOG’s free cash flow margins are expected to rise over time to a very impressive 34% by 2027.
Alphabet Consensus Medium-Term Growth Outlook
| Year | Sales | Free Cash Flow | EBITDA | EBIT (Operating Income) | Net Income |
| 2021 | $257,637 | $67,012 | $106,531 | $78,714 | $76,909 |
| 2022 | $283,551 | $66,808 | $110,457 | $75,703 | $62,380 |
| 2023 | $307,957 | $77,467 | $119,278 | $80,361 | $68,239 |
| 2024 | $346,424 | $91,770 | $136,259 | $92,469 | $78,292 |
| 2025 | $390,153 | $108,500 | $157,630 | $109,227 | $91,876 |
| 2026 | $430,884 | $140,964 | $174,923 | $123,054 | $104,056 |
| 2027 | $462,417 | $158,860 | $194,042 | $135,140 | $113,041 |
| Annualized Growth 2021-2027 | 10.24% | 15.47% | 10.51% | 9.43% | 6.63% |
| Cumulative 2022-2027 | $2,221,386 | $644,369 | $892,589 | $615,954 | $517,884 |
(Source: FactSet Research Terminal)
Over the next five years, GOOG is expected to generate over $640 billion in free cash flow, growing its free cash flow at over 15% per year.
GOOG is expected to generate almost $160 billion annually in free cash flow within five years. And that’s after spending an estimated $151 billion per year on growth.
Alphabet Consensus Medium-Term Growth Outlook
| Year | SG&A (Selling, General, Administrative) | R&D | Capex | Total Growth Spending | Sales | Growth Spending/Sales |
| 2021 | $36,422 | $31,562 | $24,640 | $92,624 | $257,637 | 35.95% |
| 2022 | $42,389 | $40,037 | $31,322 | $113,748 | $283,551 | 40.12% |
| 2023 | $46,248 | $44,818 | $32,705 | $123,771 | $307,957 | 40.19% |
| 2024 | $50,794 | $49,723 | $33,628 | $134,145 | $346,424 | 38.72% |
| 2025 | $55,384 | $51,900 | $35,465 | $142,749 | $390,153 | 36.59% |
| 2026 | $58,920 | $55,565 | $33,022 | $147,507 | $430,884 | 34.23% |
| 2027 | $62,080 | $55,239 | $33,374 | $150,693 | $462,417 | 32.59% |
| Annualized Growth | 9.29% | 9.78% | 5.19% | 8.45% | 10.24% | -1.62% |
| Total Spending 2022-2027 | $315,815 | $297,282 | $199,516 | $812,613 | $2,221,386 | -3.89% |
(Source: FactSet Research Terminal)
And that brings us to the GOOG’s balance sheet.
Alphabet Balance Sheet Consensus
| Year | Total Debt (Millions) | Cash | Net Debt (Millions) |
| 2021 | $14,817 | $20,945 | $6,128 |
| 2022 | $15,495 | $26,797 | $11,302 |
| 2023 | $15,580 | $77,390 | $61,810 |
| 2024 | $15,903 | $111,072 | $95,169 |
| 2025 | $14,087 | $169,629 | $155,542 |
| 2026 | $13,804 | $268,903 | $255,099 |
| 2027 | $14,817 | $344,365 | $329,548 |
| Annualized Growth | 0.00% | 59.46% | 94.28% |
(Source: FactSet Research Terminal)
GOOG is expected to have potentially $344 billion in cash and $330 billion in net cash by 2027. It already has more cash than debt and an AA+ stable credit rating.
- 0.29% 30-year bankruptcy risk, according to S&P
What’s even more amazing? That mountain of cash, which would be the largest net cash pile in history, is AFTER spending a fortune on buybacks.
Alphabet Buy Back Consensus
| Year | Consensus Buybacks ($ Millions) | % Of Shares (At Current Valuations) | Market Cap |
| 2022 | $38,479 | 3.2% | $1,209,179 |
| 2023 | $38,180 | 3.2% | $1,209,179 |
| 2024 | $37,975 | 3.1% | $1,209,179 |
| 2025 | $77,857 | 6.4% | $1,209,179 |
| 2026 | $80,465 | 6.7% | $1,209,179 |
| 2027 | $92,423 | 7.6% | $1,209,179 |
| Total 2023 through 2027 | $326,900 | 27.0% | $1,209,179 |
| Annualized Rate | 6.1% | Average Annual Buybacks | $54,483 |
| 1% Buyback Tax | $3,269 | Average Annual Buyback Tax | $545 |
(Source: FactSet Research Terminal)
GOOG is expected to buy back $327 billion in stock over the next five years, roughly 6.1% at current valuations.
- $344 billion in cash AFTER spending potentially $327 billion on buybacks
- and generating $160 billion per year in free cash flow
- free cash flow growing at 13% in 2027
GOOG paying a very safe and rapidly growing dividend isn’t a matter of speculation; it’s a matter of time and a limit on how big a cash pile can grow.
Buy GOOG For YouTube, Keep It For Future Dividends, And Hold It For SpaceX And Other Bets
“Google-backed Calico Labs is an R&D company with quite the mission: combatting the aging process. Founded in 2013, and with former Genentech CEO Arthur Levinson at the helm, the company hopes to uncover the biological pathways of aging and the diseases that come with it and develop treatments that allow people to live for longer.” – Pharmaceutical Technology
Calico Labs is one of GOOG’s “other bets” and one of two subsidiaries working on a cure for aging.
It’s a joint venture with AbbVie (ABBV), and in 2021 both companies recommitted to this research. This is a long-shot bet, though one that Harvard is confident it can crack within 15 years.
How big of a potential market is this?
- countries like Japan could view it as their only hope of survival
- Europe, too is screwed demographically
Imagine if a government paid $5,000 per year to keep its population healthy and young. That would solve a lot of expensive problems like the eventual collapse of the EU social safety net.
Per person personal health care spending for the 65 and older population was $19,098 in 2014, over 5 times higher than spending per child ($3,749) and almost 3 times the spending per working-age person ($7,153).” – Center For Medicare And Medicaid Services
How much would governments be willing to be able to ensure slow but steady population growth and avoid the collapse of their safety net?
How about cutting their health spending by 2/3rd?
- The population of the EU is 447 million (358 million adults)
- The population of Japan is 126 million (105 million adults)
- 463 million adults in the EU and Japan alone
- $2.3 trillion per year potential market for anti-aging treatments in the EU and Japan alone
Estimated Population 20 to 79-Year-Olds
IDF Diabetes Atlas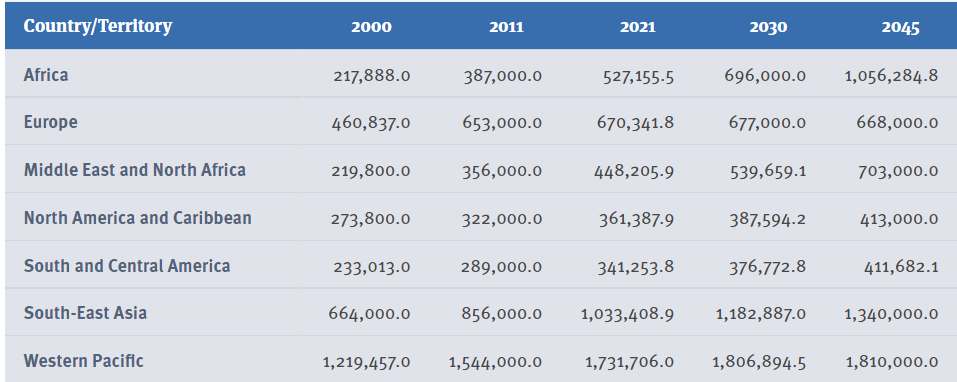
By 2045 the global population of 20 to 79-year-olds is expected to reach potentially 6.4 billion people.
- If GOOG and ABBV charged $1K per year in anti-aging treatments, this represents approximately $6.4 trillion in revenue
- $3.2 trillion GOOG’s share
What if governments don’t offer anti-aging treatments to their citizens? Then guess who will buy the ability to stay young forever (or as long as you want)? The rich.
There are an estimated 3,112 billionaires in the world in 2022.
What if GOOG and ABBV charged $1 million per year for their anti-aging treatment?
- a small price to pay for a longer life.
Then we’re back to a $3.1 trillion potential addressable market.
In other words, in the future, 50% or more of GOOG’s revenue could come from breakthrough technology like biotech.
But Wait…There’s One More Thing
Statista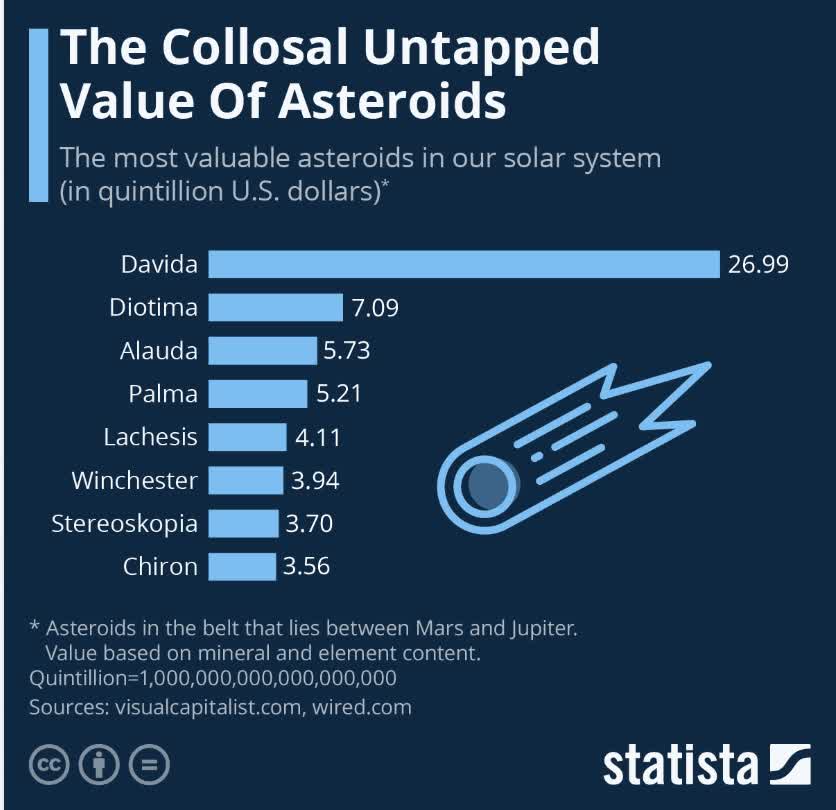
Did you know NASA estimates there are 200 earths’ worth of resources in the solar system? The eight most valuable asteroids alone hold an estimated $60.3 quintillion or $60.3 million trillion worth of metals and minerals.
That’s 603,000 years of total global GDP in 2022.
The US Is Poised to Reveal a ‘Major Scientific Breakthrough’ on Nuclear Fusion
Humans achieved positive net energy on fusion for the first time in history. While fusion is still many years away from commercialization (2035 is when most private companies think it will be ready), fusion powered spaceships could change everything.
- 60% faster travel to Mars, for example
In other words, fusion enables colonizing the solar system, which means access to quintillions of dollars’ worth of potential resources.
- and the potential to sustain up to 200 billion humans sustainably, according to NASA.
The first quadrillionaire is likely to be the person who masters space mining.
Ok, this is some amazing Star Trek-like trivia, but what does it have to do with GOOG?
In 2015, GOOG invested $1 billion into SpaceX for a 10% stake that’s since fallen to 7%.
An asteroid mining startup will soon launch on a SpaceX rideshare mission
Asteroid mining is in its infancy but could one day be a multi-trillion industry.
And guess who is revolutionizing commercial space travel?
Daily Shot 
SpaceX has slashed the cost of going into space from $178,000 per KG in 1965 to $1500 today. And it’s working on the Starship, which it says can cut that down to $50 per KG.
SpaceX is a private company, and one of the only ways you can own it is by buying GOOG.
- a 10% stake in GOOG = a 0.7% stake in SpaceX
- the Nasdaq 100 is 0.4% SpaceX due to GOOG’s stake
So you see, buying GOOG is a bet on the future. Not just the future of digital advertising but also future dividends, potentially revolutionary biotech, and even the future of space exploration.
All This At At 31% Discount
| Metric | Historical Fair Value Multiples (all years) | 2021 | 2022 | 2023 | 2024 | 2025 | 12-Month Forward Fair Value |
| Earnings | 25.79 | $144.68 | $122.24 | $136.17 | $163.25 | $196.26 | |
| Average | $144.68 | $122.24 | $136.17 | $163.25 | $196.26 | $135.90 | |
| Current Price | $93.31 | ||||||
|
Discount To Fair Value |
35.51% | 23.67% | 31.48% | 42.84% | 52.46% | 31.34% | |
| Upside To Fair Value | 55.06% | 31.01% | 45.93% | 74.96% | 110.33% | 45.65% | |
| 2022 EPS | 2023 EPS | 2022 Weighted EPS | 2023 Weighted EPS | 12-Month Forward PE | 12-Month Average Fair Value Forward PE | Current Forward PE |
Current Forward Cash-Adjusted PE |
| $4.74 | $5.28 | $0.09 | $5.18 | $5.27 | 25.8 | 17.7 | 9.9 |
(Source: DK Research Terminal)
GOOG is historically worth about 26X earnings and today trades at 17.7X and just 9.9X cash-adjusted earnings.
- 0.9 PEG = Peter Lynch’s growth at a reasonable price
For context, the average private equity deal in 2022 was for 11.3X cash-adjusted earnings. So GOOG, a bet on the future of all mankind, is trading at a bargain by even private equity standards.
|
Analyst Median 12-Month Price Target |
Morningstar Fair Value Estimate |
| $126.61 (24.0 PE) | $160 (30.4 PE) |
|
Discount To Price Target (Not A Fair Value Estimate) |
Discount To Fair Value |
| 26.30% | 41.68% |
|
Upside To Price Target (Not Including Dividend) |
Upside To Fair Value (Not Including Dividend) |
| 35.69% | 71.47% |
(Source: DK Research Terminal)
Analysts expect GOOG to be up 36% within a year, and that forecast is 100% justified by its fundamentals. In fact, if GOOG grows as expected, a 46% rally in the next year would merely return it to historical fair value.
GOOG 2024 Consensus Total Return Potential
(Source: FAST Graphs, FactSet)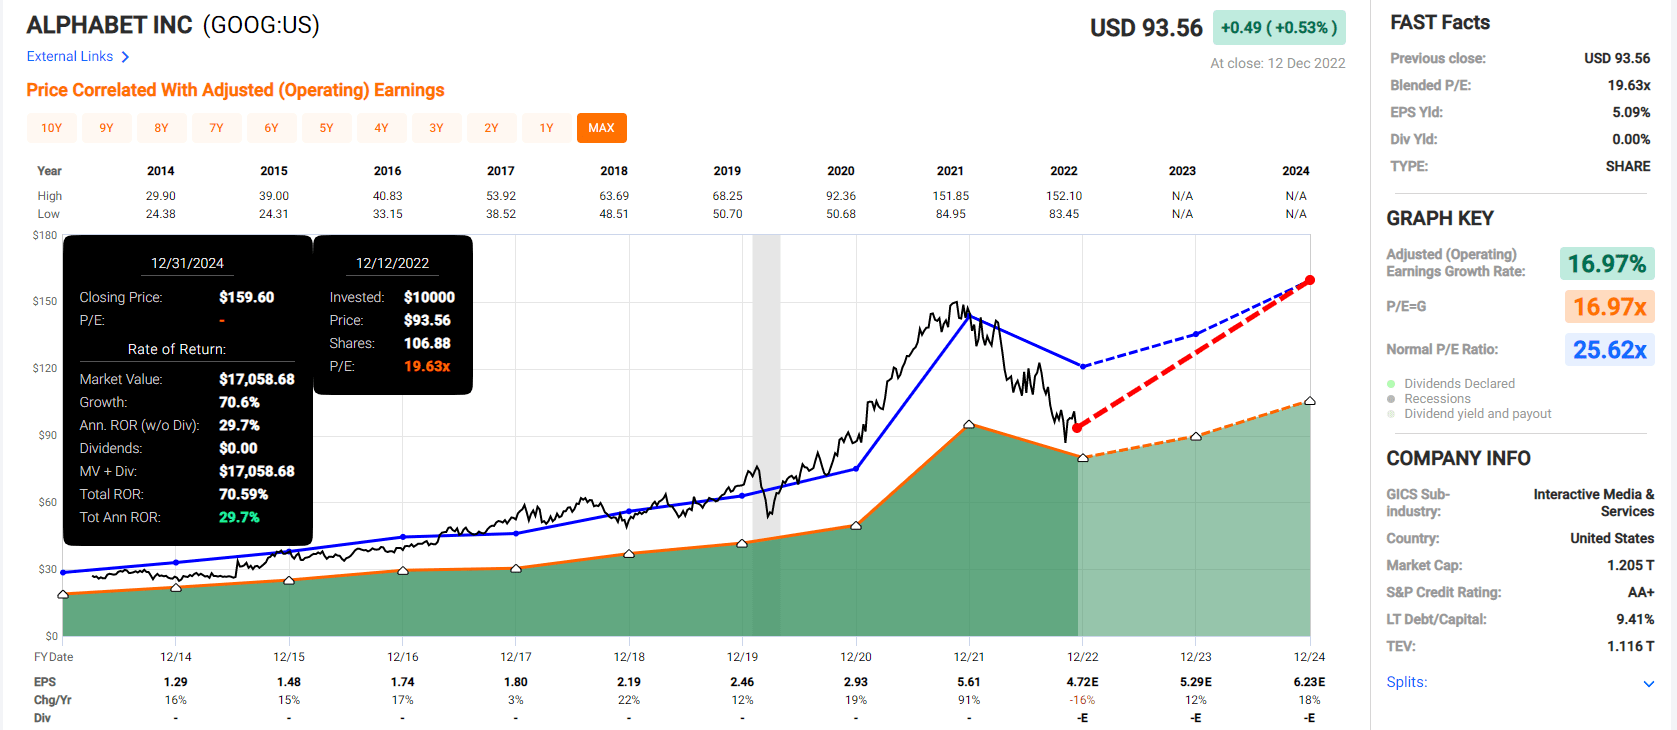
If GOOG grows as expected and returns to historical fair value, it could deliver 71% total returns within two years or 30% annually.
- 3.5X more than the S&P 500 consensus
- Buffett-like return potential from a world-beater blue-chip bargain hiding in plain sight
GOOG 2028 Consensus Total Return Potential
(Source: FAST Graphs, FactSet)
If GOOG grows as expected and returns to historical fair value, it could deliver 168% total returns or 18% annually over the next five years.
- over 3X more than the S&P 500
Alphabet Investment Decision Score
Dividend Kings Automated Investment Decision Tool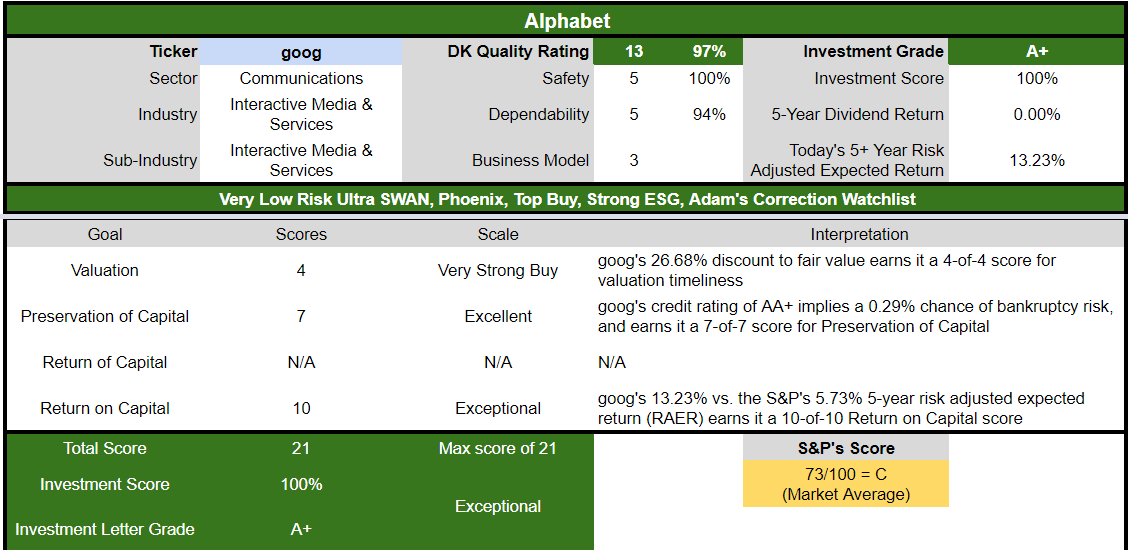
GOOG is as close to a perfect growth opportunity as exists on Wall Street for anyone comfortable with its risk profile. Look at how it compares to the S&P 500.
- 27% discount to fair value vs. 3% premium S&P = 29% better valuation
- approximately 11.1% long-term annual return potential vs. 10.2% CAGR S&P
- about 2X higher risk-adjusted expected returns
Visa: A Wide Moat Dividend Growth Powerhouse
Visa is a somewhat unique company in that it is a longtime, established market leader that still enjoys strong growth prospects. Despite the ongoing evolution of the payments industry, we think a wide moat surrounds the business and that Visa’s position in the global electronic payment infrastructure is essentially unassailable.” – Morningstar (emphasis added)
Visa’s card processing market share worldwide is 39%, making it the king of payment processing.
Visa 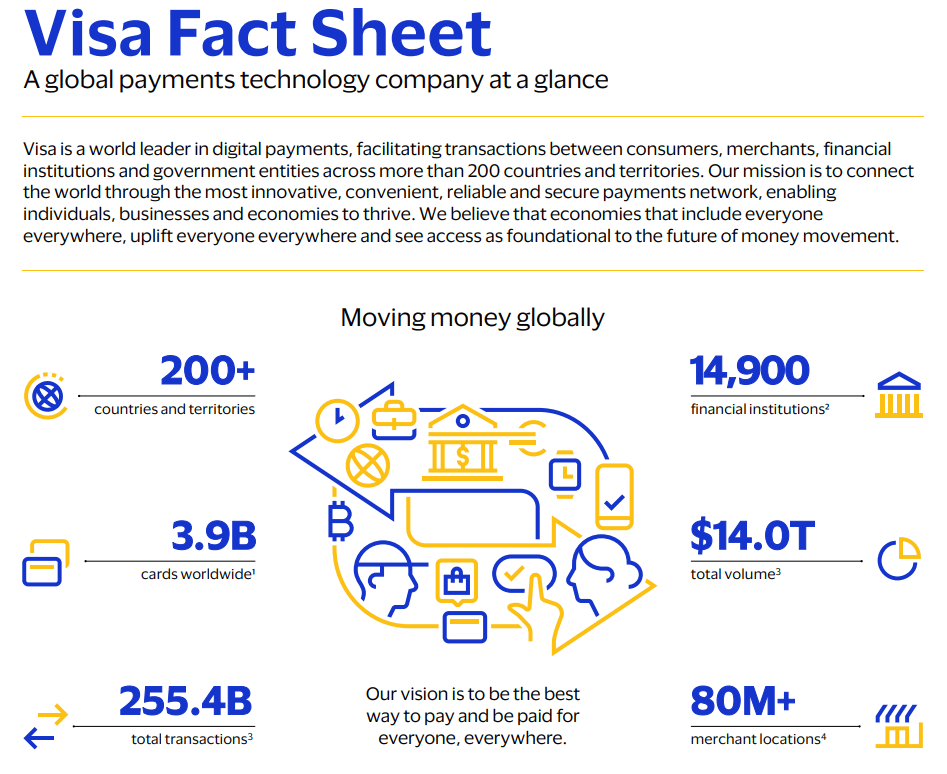
It operates in every country and connects to almost 15,000 global banks. It processes a total of $14 trillion worth of transactions. That means about 14% of the entire global economy is running through Visa’s network, which takes a cut of each of those 255 billion transactions.
Do you know how much it costs Visa to maintain this incredible network?
FactSet Research Terminal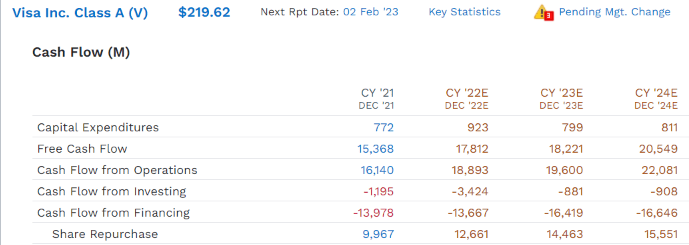
About $800 million per year. That capital-light business model means Visa’s profitability is the stuff of legend.
GuruFocus Premium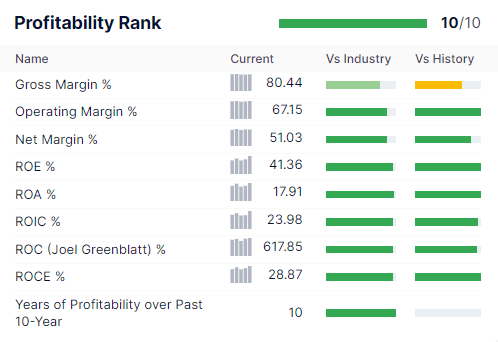
Net margins of 51% and returns on capital of 618%, or 6X that of the dividend aristocrats and 42X more than the S&P 500.
YCharts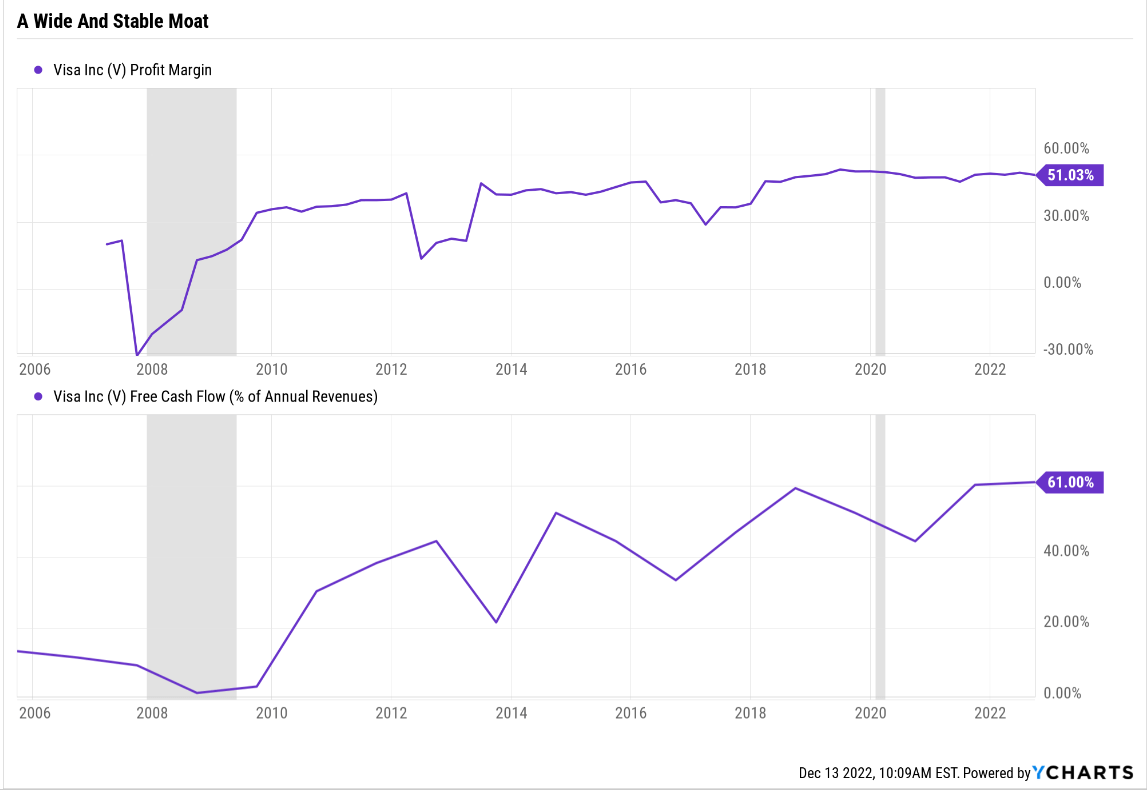
If you think net margins of 51% are amazing, how about free cash flow margins of 61%? 61 cents of every dollar coming in the door falls straight to the bottom line.
That’s in the top 0.5% of all companies on earth and exemplifies Visa’s wide and stable moat.
OK, but aren’t there competitors like Mastercard (MA), American Express (AXP), Discover (DFS), and even European networks? Surely capitalism won’t allow such profit margins to endure, will it?
Visa Profit Margin Consensus Forecast
| Year | FCF Margin | EBITDA Margin | EBIT (Operating) Margin | Net Margin |
| 2021 | 60.2% | 69.6% | 65.7% | 53.7% |
| 2022 | 61.0% | 70.5% | 68.0% | 54.7% |
| 2023 | 55.1% | 70.7% | 67.9% | 54.2% |
| 2024 | 56.2% | 70.5% | 68.4% | 54.7% |
| 2025 | 55.2% | 71.3% | 69.1% | 55.2% |
| Annualized Growth 2022-2027 | -2.16% | 0.59% | 1.24% | 0.70% |
(Source: FactSet Research Terminal)
Actually, Visa’s margins are expected to remain stable or improve in the coming years.
Visa Profit Margin Consensus Forecast
| Year | Sales | Free Cash Flow | EBITDA | EBIT (Operating Income) | Net Income |
| 2021 | $24,105 | $14,522 | $16,780 | $15,843 | $12,933 |
| 2022 | $29,310 | $17,879 | $20,668 | $19,923 | $16,034 |
| 2023 | $31,956 | $17,614 | $22,592 | $21,700 | $17,312 |
| 2024 | $35,743 | $20,078 | $25,187 | $24,438 | $19,548 |
| 2025 | $39,648 | $21,892 | $28,256 | $27,378 | $21,874 |
| Annualized Growth 2021-2027 | 13.25% | 10.81% | 13.91% | 14.65% | 14.04% |
| Cumulative 2022-2027 | $136,657 | $77,463 | $96,703 | $93,439 | $74,768 |
(Source: FactSet Research Terminal)
Visa is expected to grow its top line by about 13% over the next three years and its bottom line at about the same rate.
(Source: FactSet Research Terminal)
But Visa’s earnings are expected to grow closer to 17% per year due to buybacks.
Visa Buyback Consensus Forecast
| Year | Consensus Buybacks ($ Millions) | % Of Shares (At Current Valuations) | Market Cap |
| 2022 | $12,030 | 2.9% | $411,073 |
| 2023 | $14,534 | 3.5% | $411,073 |
| 2024 | $14,292 | 3.5% | $411,073 |
| 2025 | $19,247 | 4.7% | $411,073 |
| Total 2023 through 2025 | $48,073 | 11.7% | $411,073 |
| Annualized Rate | 4.2% | Average Annual Buybacks | $16,024 |
| 1% Buyback Tax | $481 | Average Annual Buyback Tax | $80 |
(Source: FactSet Research Terminal)
Visa is expected to spend almost $50 billion on buybacks in the next three years, enough to repurchase about 4% of shares each year at current valuations.
Visa Buyback Consensus Forecast
| Year | Total Debt (Millions) | Cash | Net Debt (Millions) |
| 2021 | $20,977 | $16,487 | $2,018 |
| 2022 | $22,450 | $15,689 | $3,928 |
| 2023 | $21,261 | $17,381 | $2,103 |
| 2024 | $21,261 | $19,010 | -$3,130 |
| 2025 | $22,450 | $23,021 | -$10,854 |
| Annualized Growth | 1.71% | 8.70% | NA |
(Source: FactSet Research Terminal)
But even with Visa spending an average of $16.2 billion per year on buybacks and $3.8 billion on dividends, a total of $20 billion in annual cash return to shareholders, Visa’s cash position is expected to climb to $23 billion by 2025.
Speaking of dividends, just take a look at how much dividend growth Visa has delivered.
Dividend Growth To Make Grown Men Weep With Joy
Portfolio Visualizer Premium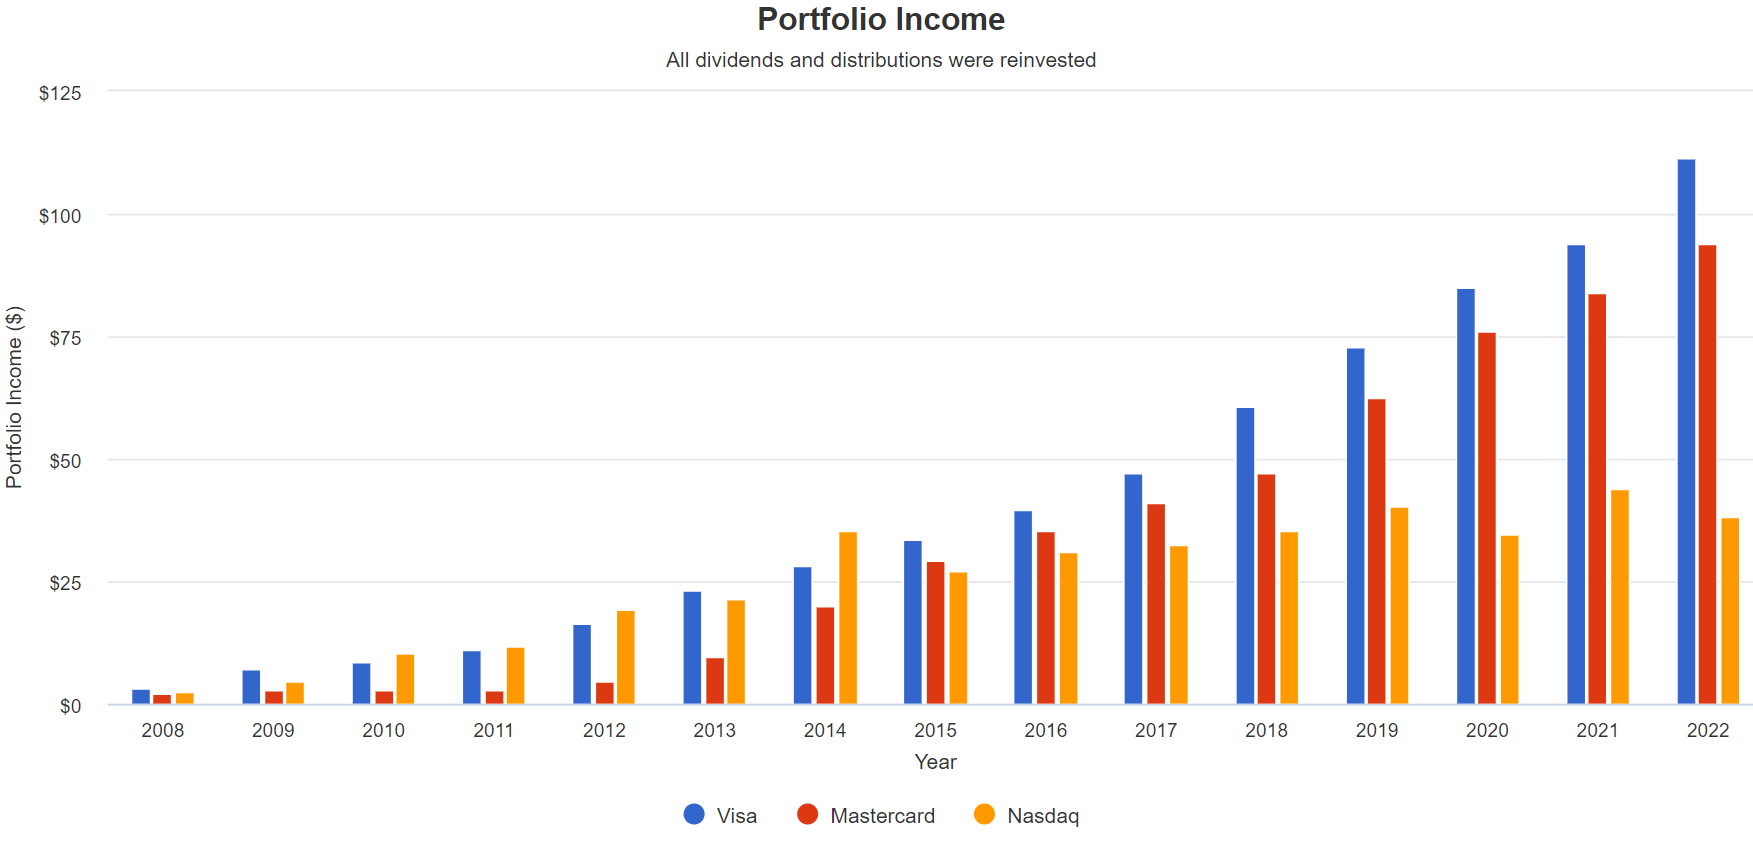
The annualized dividend growth for Visa has been sensational.
- Visa: 23.7% CAGR = 11.1% yield on cost
- Mastercard: 30.3% CAGR = 9.4% yield on cost
- Nasdaq: 16.9% CAGR = 3.8% yield on cost
The Nasdaq is the best dividend growth ETF I’ve ever seen, and yet Visa’s dividend growth runs circles around it.
Consensus Long-Term Return Potential
| Investment Strategy | Yield | LT Consensus Growth | LT Consensus Total Return Potential | Long-Term Risk-Adjusted Expected Return | Long-Term Inflation And Risk-Adjusted Expected Returns | Years To Double Your Inflation & Risk-Adjusted Wealth |
10-Year Inflation And Risk-Adjusted Expected Return |
| Visa | 0.8% | 16.8% | 17.6% | 12.3% | 9.9% | 7.3 | 2.57 |
| Nasdaq | 0.8% | 11.8% | 12.6% | 8.8% | 6.4% | 11.2 | 1.87 |
| Safe Midstream | 5.9% | 6.4% | 12.3% | 8.6% | 6.2% | 11.6 | 1.83 |
| Schwab US Dividend Equity ETF | 3.2% | 7.6% | 10.8% | 7.6% | 5.2% | 14.0 | 1.65 |
| Dividend Aristocrats | 1.9% | 8.5% | 10.4% | 7.3% | 4.9% | 14.8 | 1.61 |
| S&P 500 | 1.7% | 8.5% | 10.2% | 7.1% | 4.7% | 15.2 | 1.59 |
| REITs | 3.9% | 6.1% | 10.0% | 7.0% | 4.6% | 15.7 | 1.57 |
| 60/40 Retirement Portfolio | 2.1% | 5.1% | 7.2% | 5.0% | 2.6% | 27.3 | 1.30 |
(Source: DK Research Terminal, FactSet, Morningstar, YCharts)
Visa is expected to keep delivering Nasdaq-crushing returns for years, or even potentially decades to come. All while approximately doubling the dividend every five years.
OK, this is all very impressive, but what about Visa’s risk profile? How well does it manage its many risks, including all the regulators gunning for its margins?
Visa: A Master Of Risk Management
Even Ultra SWANs like Visa have risks to be aware of.
Visa’s revenue is tied to the amount and volume of consumer purchases, which creates macroeconomic sensitivity. Both Visa and Mastercard have paid substantial fines historically related to the oligopolistic nature of the industry, and legal and regulatory risk is intrinsic to the business model, given merchants’ desires to lower fees. While Visa’s and Mastercard’s positions in the current electronic payment industry are largely set, it continues to evolve in ways that could reduce its volume or profitability. Some governments have shown a preference for local payment networks, which could freeze Visa out of certain markets and impede the value it drives from its global network.
We see the company’s largest ESG risk as data security. Any company involved in processing payments has potential exposure to breaches in its systems.” – Morningstar
How well does Visa manage its complex risk profile?
DK uses S&P Global’s global long-term risk-management ratings for our risk rating.
- S&P has spent over 20 years perfecting their risk model
- which is based on over 30 major risk categories, over 130 subcategories, and 1,000 individual metrics
- 50% of metrics are industry specific
- this risk rating has been included in every credit rating for decades
The DK risk rating is based on the global percentile of how a company’s risk management compares to 8,000 S&P-rated companies covering 90% of the world’s market cap.
Visa scores 84th Percentile On Global Long-Term Risk Management
S&P’s risk management scores factor in things like:
- supply chain management
- crisis management
- cyber-security
- privacy protection
- efficiency
- R&D efficiency
- innovation management
- labor relations
- talent retention
- worker training/skills improvement
- occupational health & safety
- customer relationship management
- business ethics
- climate strategy adaptation
- sustainable agricultural practices
- corporate governance
- brand management
Visa’s Long-Term Risk Management Is The 122th Best In The Master List 76th Percentile In The Master List)
| Classification | S&P LT Risk-Management Global Percentile |
Risk-Management Interpretation |
Risk-Management Rating |
| BTI, ILMN, SIEGY, SPGI, WM, CI, CSCO, WMB, SAP, CL | 100 | Exceptional (Top 80 companies in the world) | Very Low Risk |
| Strong ESG Stocks | 86 |
Very Good |
Very Low Risk |
| Visa | 84 |
Very Good |
Very Low Risk |
| Foreign Dividend Stocks | 77 |
Good, Bordering On Very Good |
Low Risk |
| Ultra SWANs | 74 | Good | Low Risk |
| Dividend Aristocrats | 67 | Above-Average (Bordering On Good) | Low Risk |
| Low Volatility Stocks | 65 | Above-Average | Low Risk |
| Master List average | 61 | Above-Average | Low Risk |
| Dividend Kings | 60 | Above-Average | Low Risk |
| Hyper-Growth stocks | 59 | Average, Bordering On Above-Average | Medium Risk |
| Dividend Champions | 55 | Average | Medium Risk |
| Monthly Dividend Stocks | 41 | Average | Medium Risk |
(Source: DK Research Terminal)
Visa’s risk management is in the top 26% of the world’s best blue chips and is similar to:
- Lowe’s (LOW): Ultra SWAN dividend king
- T. Rowe Price (TROW): Ultra SWAN dividend aristocrat
- 3M (MMM): Ultra SWAN dividend king
- BlackRock (BLK): Ultra SWAN
- Royal Bank of Canada (RY): Ultra SWAN
The bottom line is that all companies have risks, and Visa is very good at managing theirs, according to S&P.
Valuation: A Wonderful Company At A Wonderful Price
| Metric | Historical Fair Value Multiples (15-Years) | 2021 | 2022 | 2023 | 2024 | 2025 | 12-Month Forward Fair Value |
| 5-Year Average Yield | 0.63% | $212.70 | $285.71 | $285.71 | $315.87 | $339.68 | |
| 13-Year Median Yield | 0.63% | $212.70 | $285.71 | $285.71 | $315.87 | $339.68 | |
| 15- Year Average Yield | 0.69% | $194.20 | $260.87 | $260.87 | $288.41 | $310.14 | |
| Earnings | 30.21 | $82.17 | $232.62 | $261.01 | $292.13 | $338.65 | |
| Average | $115.48 | $264.34 | $272.77 | $302.52 | $331.54 | $272.60 | |
| Current Price | $215.96 | ||||||
|
Discount To Fair Value |
-87.01% | 18.30% | 20.83% | 28.61% | 34.86% | 20.78% | |
|
Upside To Fair Value (including dividend) |
-46.53% | 22.40% | 26.30% | 40.08% | 53.52% | 27.06% | |
| 2022 EPS | 2023 EPS | 2022 Weighted EPS | 2023 Weighted EPS | 12-Month Forward EPS | Historical Average Fair Value Forward PE | Current Forward PE |
Current Forward Cash-Adjusted PE |
| $7.70 | $8.64 | $0.15 | $8.47 | $8.62 | 31.6 | 25.0 | 20.4 |
(Source: DK Research Terminal)
Visa is 20% historically undervalued and trading at 25X earnings, or 20.4X cash-adjusted earnings.
- 1.2 PEG = growth at a reasonable price
| Rating | Margin Of Safety For Very Low Risk 13/13 Ultra SWAN (Sleep Well At Night) Quality Companies | 2022 Fair Value Price | 2023 Fair Value Price |
12-Month Forward Fair Value |
| Potentially Reasonable Buy | 0% | $264.34 | $272.77 | $272.60 |
| Potentially Good Buy | 5% | $251.12 | $259.13 | $258.97 |
| Potentially Strong Buy | 15% | $224.69 | $231.85 | $231.71 |
| Potentially Very Strong Buy | 25% | $188.34 | $204.58 | $204.45 |
| Potentially Ultra-Value Buy | 35% | $171.82 | $177.30 | $177.19 |
| Currently | $215.96 | 18.30% | 20.83% | 20.78% |
| Upside To Fair Value (Including Dividends) | 23.23% | 27.14% | 27.06% |
(Source: DK Research Terminal)
For anyone comfortable with its risk profile, Visa is a potentially strong buy.
Visa 2025 Consensus Total Return Potential
(Source: FAST Graphs, FactSet)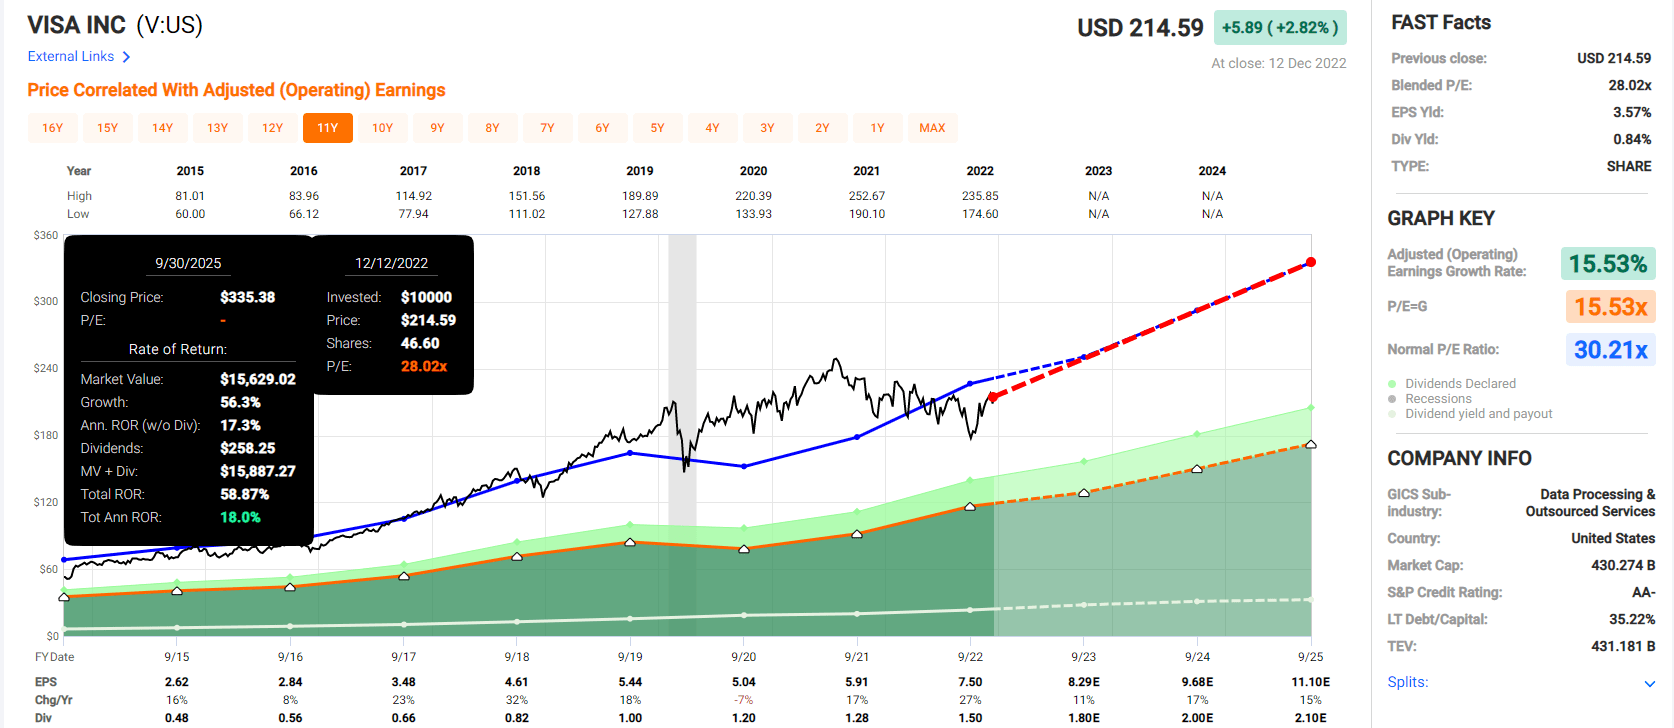
If Visa grows as expected and returns to historical fair value, it could deliver 60% over the next three years, or 18% per year.
- about 2X more than the S&P 500 consensus
Visa 2029 Consensus Total Return Potential
(Source: FAST Graphs, FactSet)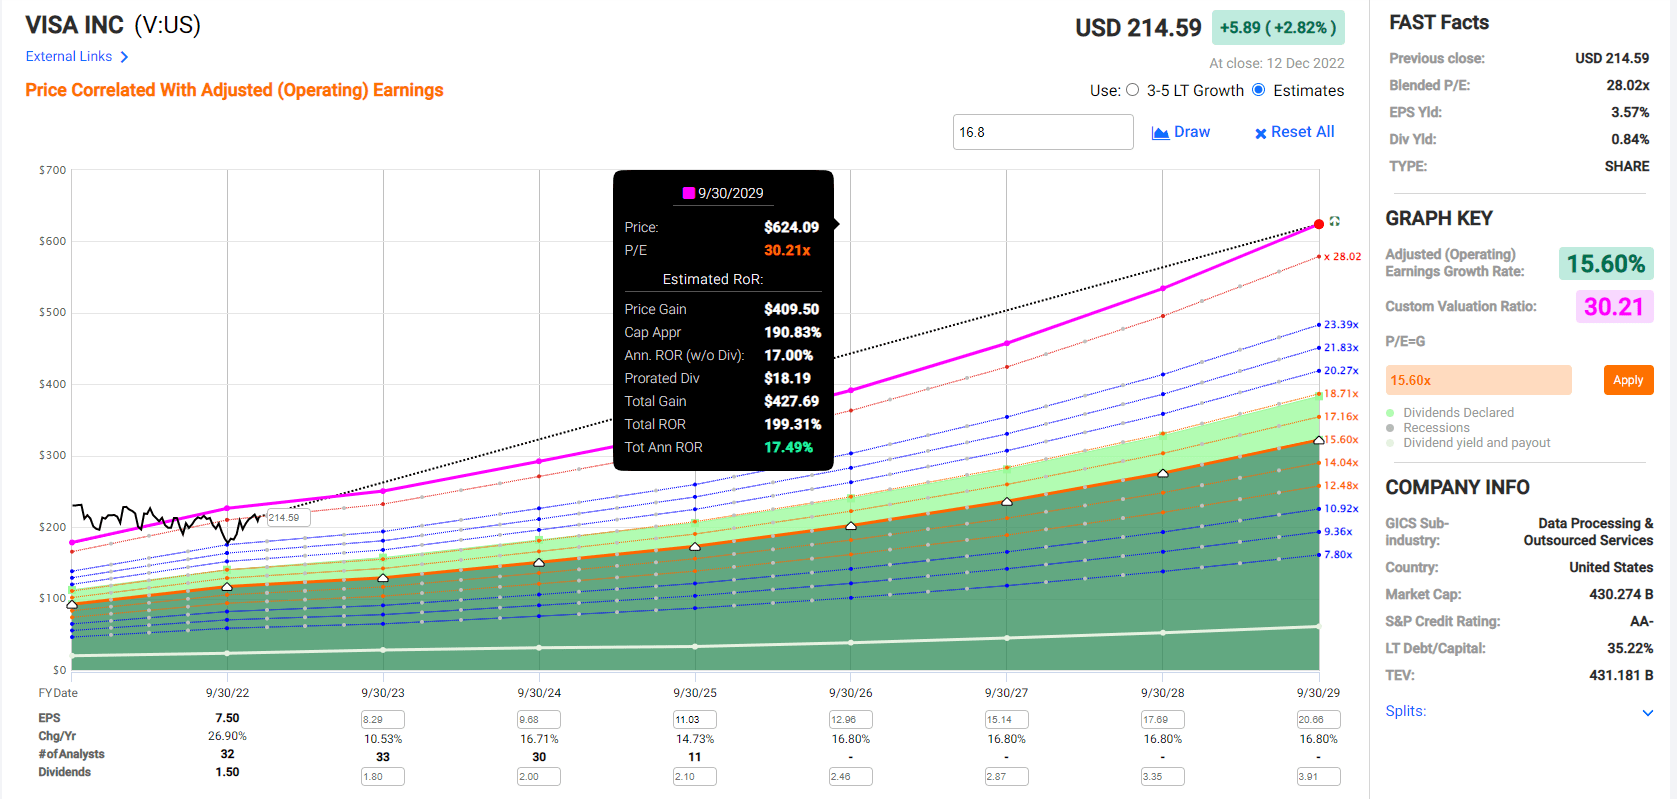
If Visa grows as expected and returns to historical fair value, it could triple by 2029, delivering 18% annual returns.
Visa Investment Decision Score
Dividend Kings Automated Investment Decision Tool 
Visa is as close to a perfect dividend hyper-growth Ultra SWAN opportunity for anyone comfortable with its risk profile. Look at how it compares to the S&P 500.
- 21% discount to fair value vs. 3% premium S&P = 24% better valuation
- 0.8% safe yield vs. 1.7% (much safer and growing 2X as fast)
- approximately 17.6% long-term annual return potential vs. 10.2% CAGR S&P
- about 2X higher risk-adjusted expected returns
Bottom Line: Alphabet And Visa Are Perfect 2023 Blue-Chip Buys
Let me be clear: I’m NOT calling the bottom in GOOG or V (I’m not a market-timer).
Ultra SWAN quality does NOT mean “can’t fall hard and fast in a bear market.”
Fundamentals are all that determine safety and quality, and my recommendations.
- over 30+ years, 97% of stock returns are a function of pure fundamentals, not luck
- in the short term; luck is 25X as powerful as fundamentals
- in the long term, fundamentals are 33X as powerful as luck
While I can’t predict the market in the short term, here’s what I can tell you about GOOG and V.
These are two of the best world-beater blue-chips on earth. They offer:
- Fortress balance sheets: AA+ for GOOG and AA- for Visa
- great risk management: 93rd percentile for GOOG and 84th for Visa
- solid double-digit growth potential for decades to come
Visa is already one of the best dividend growth Ultra SWANs, with a 14-year dividend growth streak at a blistering 24% rate.
GOOG is likely to start paying a dividend within a decade, and grow at a solid double-digit rate as well.
Their wide moat and cash-rich businesses offer long growth runways. Visa is the king of global financial transactions and in the top 0.5% of all companies in profitability with its stable 61% free cash flow margins.
GOOG is one of the most flexible growth stocks on earth, with dominant positions in cloud computing, advertising, and social media. Buy GOOG for YouTube and keep it for the future dividends, and its 7% stake in SpaceX and the potential for Calico to rake in trillions from anti-aging.
For those looking for the world’s best growth blue-chips for 2023, GOOG and V are as close to perfect opportunities as currently exist on Wall Street.
I can’t promise you quick gains in the months ahead; no one can. But if you have 5+ years, then I’m confident you’ll be pleased if you buy them today.
And within a decade, you could feel like a stock market genius.
Be the first to comment