

Michael M. Santiago/Getty Images News
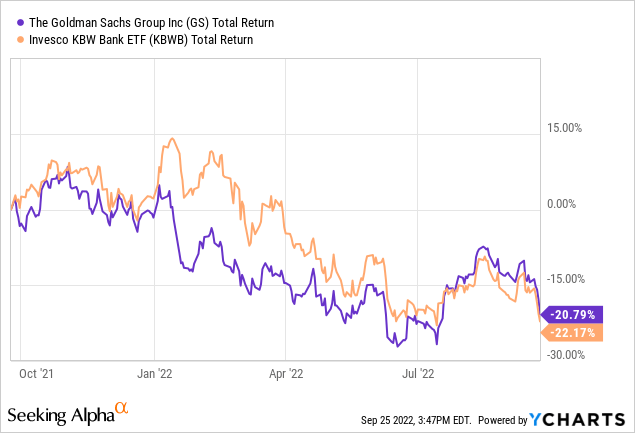
Goldman Sachs (GS) is always at the apex of discussion when it comes to banking stocks. The bank’s more than 20% year-to-date drawdown shouldn’t be much of a surprise given its cyclical attributes. However, many investors might ask themselves: “Is Goldman a buy on the dip?”
This thesis’ approach to the central question follows a bottom-to-top thread where operations are analyzed in tandem with stock valuation. Lastly, the macroeconomic climate is studied to contextualize systemic influences and draw an objective conclusion.
So, without further ado, let’s get into it.
Operational Review
Segmental Analysis
The table inserted below is a summary of Goldman Sachs’ second-quarter financial results.
As anticipated, global markets income dipped (by 18%) as the bear market continued to add pressure on stock and bond traders. Furthermore, Goldman’s investment banking activities also slumped (down 11%) since the previous quarter due to the interlinkage with the equity markets. However, Goldman Sachs’ fee-based services, such as asset management, shot up sharply during the quarter to provide hope.
Looking ahead, Goldman will likely continue to struggle holistically. The bank generates approximately 86% of its revenue from non-interest activities. Additionally, roughly 40% of the bank’s income stems from trading activities.
Trading activities are usually considered the riskiest business activity for a bank, and with high-risk premiums attached to global markets, it’s unlikely that Goldman would benefit from this division anytime soon.
Moreover, the bank only generates a small portion of its revenue from interest-bearing activities. With rising interest rates, interest-bearish activities are where banks will most likely profit, and Goldman looks set to miss out on the sector’s prospective cash cow.
Goldman Sachs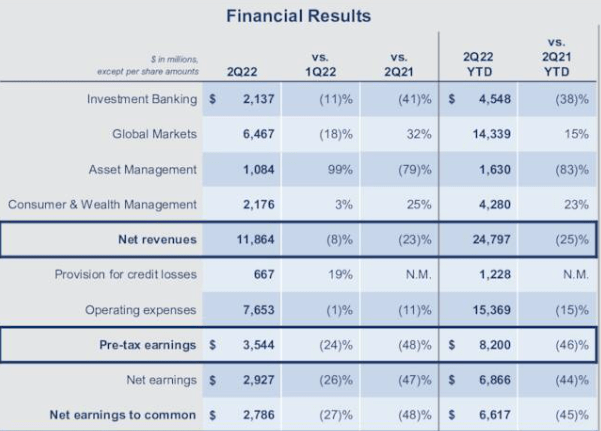
Goldman Sachs
Basel III
The Basel III stress test is a globally recognized framework that measures the risk of a bank’s allocated assets. According to Goldman’s latest results, its CET1 of 14.3% exceeds the 8% regulatory requirement, meaning the bank’s equity-based assets present optimal returns per unit of risk.
I personally see a marginal downside in all of the bank’s risk-weighted asset metrics. I say this because I believe investment risk premiums will remain elevated, and earnings likely won’t recover anytime soon. But that’s just eyeballing it, and I encourage investors to do further research on this matter.
Goldman Sachs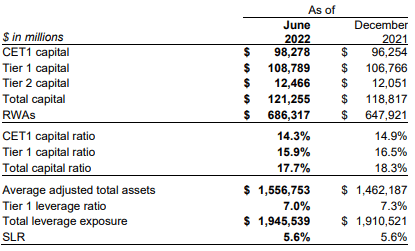
Valuation & Dividends
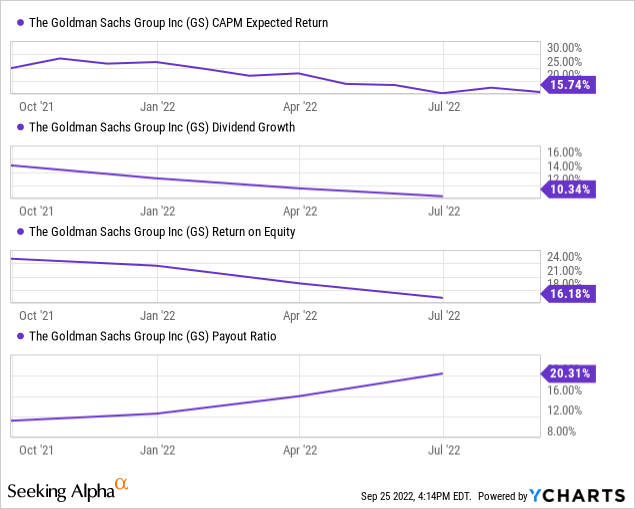
I valued Goldman stock by utilizing justified price multiples that I calculated with altered Gordon’s Growth Models. The data points listed in the figure are all available via end-of-section panels.
When it comes to banking stocks, the cornerstone valuation metric to observe is the price-to-book ratio. A price-to-book ratio exceeding 1.00 is usually considered overvalued; however, the justified model suggests that Goldman’s valuation threshold is 1.082 instead. Therefore, considering Goldman’s current price-to-book value of 0.92, it’s safe to conclude that the stock’s undervalued relative to its justified price-to-book threshold.
However, on the flip side, Goldman Sachs stock is seemingly overvalued relative to its justified price-to-earnings ratio. This could be because of the slumping year-over-year results mentioned in the previous section.
Although the price-to-earnings ratio bears less substance than the price-to-book ratio, it’s still a valuable valuation data point, especially for cyclical stocks.
Author’s Calculations; Seeking Alpha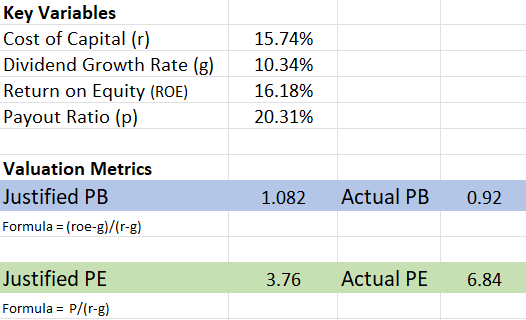
I took matters a step further by constructing a three-stage dividend discount model to value Goldman Sachs stock. This model should be considered with a pinch of salt as it requires eyeballing three distinct growth periods; nonetheless, it’s a useful indicator of stock value.
I decided to build this model as Goldman is a cyclical stock. I utilized retrospective growth rates as I bargained the bank’s 5-year growth cycle would repeat itself (5 years is the usual duration of a business cycle).
Based on my calculations, Goldman is significantly overvalued and set for a cyclical correction unless it bolsters its residual growth rate (often conveyed by dividend growth). I don’t see Goldman exponentially increasing its growth rates in the current economic climate, which I justified in the following section.
Author’s Calculations; Seeking Alpha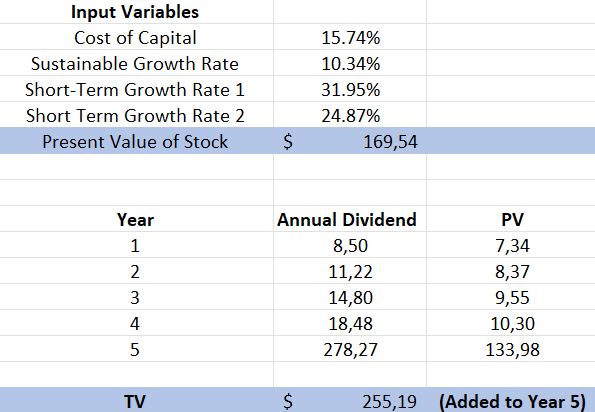
Although Goldman’s valuation is questionable, it still presents lucrative dividends. The stock presents a lucrative forward dividend yield of 3.31%, covered by a solid dividend coverage ratio of 3.79, and cash from operations worth $1.16 billion.
Even if we enter a deep recession, It’s evident that the bank possesses enough slack to pay its shareholders compensation. Nonetheless, investors need to ask themselves if dividends will justify possible total return losses.
| Dividend Yield (fwd) | 3.31% |
| Dividend Coverage | 3.79 |
| CFO | $1.16 billion |
Source: Seeking Alpha
Deep Recession Risk
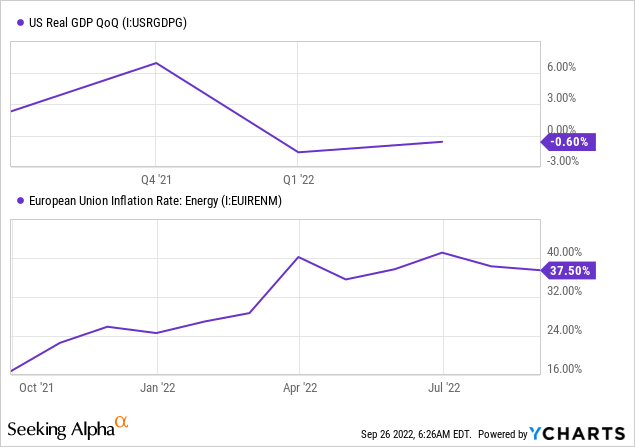
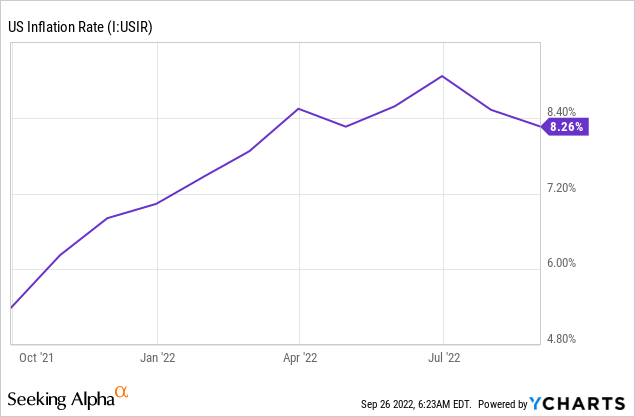
The constant argument about whether the U.S. is in a recession or not is pointless as the bottom line is that there’s slowing growth, which is due to both endogenous and exogenous factors. In addition, global growth is waning due to ultra-high emerging market inflation, a pending energy crisis in Europe, and shaky monetary policy in most nations.
Today’s economic contraction is unique in a sense. Recent economic blows such as the 2008 credit event (a.k.a housing crisis), the 2016 earnings recession, and 2020’s COVID-19-driven crisis were all followed by aggressive expansionary monetary policy, which reignited growth. However, the current economic contraction can’t be avoided by adding additional capital to the system due to the high levels of current inflation. As such, we’re likely set for a sustained period of negative or slow growth, which could result in multi-year lows for the stock market.
I performed a scenario analysis on the S&P 500 and a portfolio with a 60%/40% S&P 500 and Goldman Sachs stock. Based on the results of the Dotcom crash, the 2008 crisis, and COVID-19, both portfolios drew down by the same or more than 2022’s bear market. In addition, notice how much more the 60%/40% portfolio crashed than the general equity-blended S&P 500 portfolio in all three scenarios.
I wanted to juxtapose two portfolios to convey Goldman’s cyclicality and how it could suffer excess losses in a deep recession.
Pearl Gray Equity and Research; Portfolio Visualizer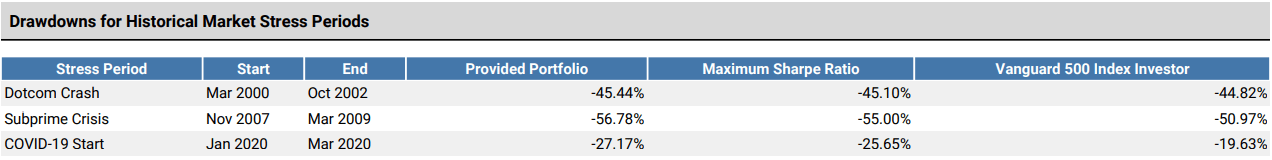
Lastly, I’d like to highlight Goldman Sachs’ quantitative risk metrics. The bank stock has a poor Sharpe Ratio, communicating its historically poor risk Vs. return profile. In addition, its value-at-risk is high, indicating the stock’s likely to lose more than 13.41% of its market value in 5% of its traded months.
YCharts; Seeking Alpha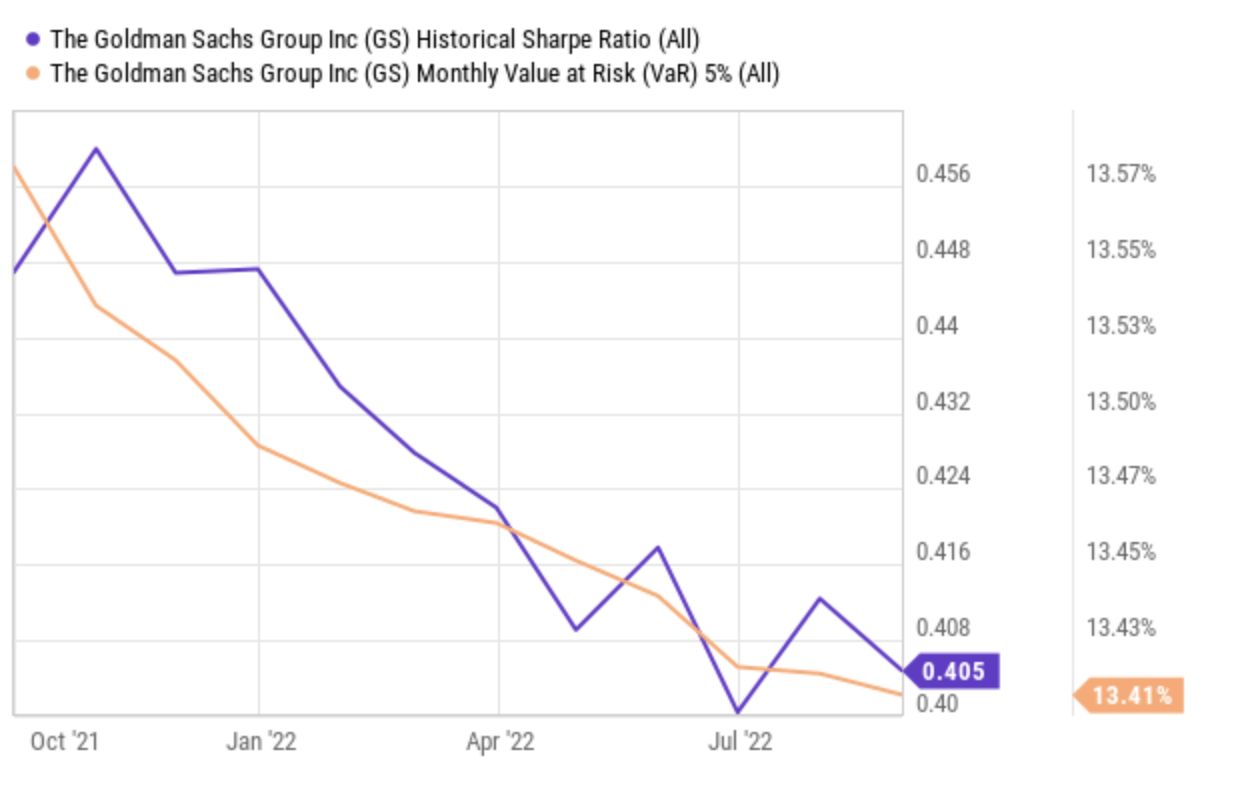
Concluding Thoughts
Based on key metrics and numerous valuation models, we believe Goldman stock is yet to experience its bottom. Although the bank’s Basel III is robust and its wealth-based business has picked up in Q-2, we don’t think we’ll see a strong enough recovery in the company’s core earnings to entice investor attention.
Lastly, quantitative risk metrics convey the stock’s poor risk Vs. return alignment in contractionary macroeconomic periods.
If you’re interested in more advanced analysis, be sure to keep an eye out for our marketplace program, “The Factor Investing Hub,” which launches soon. FIH is an AI-driven “smart beta/factor investing” portfolio management concept with the goal of balancing long-term portfolios relative to “factors.”
Be the first to comment