

Ravitaliy
In spite of it being considered a safe haven asset and inflation hedge, gold has had a rough year with a nearly 10% decline year-to-date. The yellow metal has consistently traded below its 50-DMA over the past few months, while the 200-DMA is fairly flat. Over the past several days, gold has been trending sideways right near 52-week lows.
Front Month Gold Futures – Past Year (Author)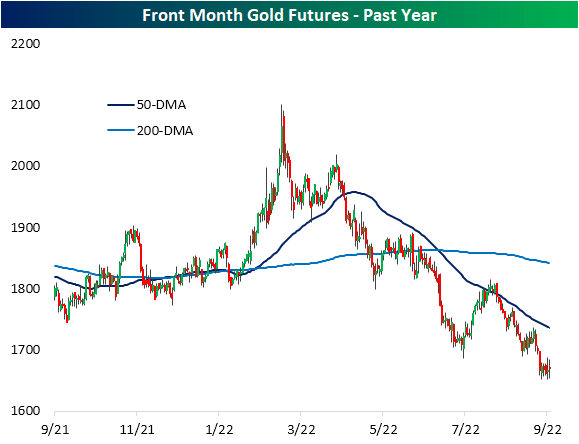
Silver has not avoided declines and, like gold, has largely remained below its moving averages. However, its sideways action in recent days has proven a bit more constructive. Unlike gold, silver rallied in the first half of September, moving back above its 50-DMA in the process. Since then, there has not been a massive degree of follow-through, but it has managed to hold above that moving average.
Front Month Silver Futures – Past Year (Author)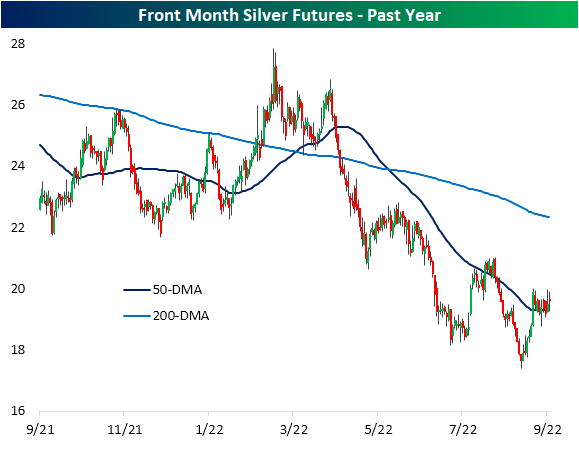
For the past year and a half, gold has generally outperformed silver, as shown in the uptrend of the ratio of the two metals since early 2021. However, the underperformance of gold in recent weeks has led the ratio to pivot sharply lower. Over the past 15 days, the ratio has fallen 11% – the first double-digit decline since February 2021. Looking back through the early 1990s, there have only been a handful of other periods in which the gold-to-silver ratio has fallen by a similar degree or more in the same span of time. Outside of last year, the only other occurrences in the past decade were 2013, 2016, and 2020.
Gold To Silver Ratio – Past Five Years; Gold To Silver Ratio 15-Day % Change – Past 30 Years (Author)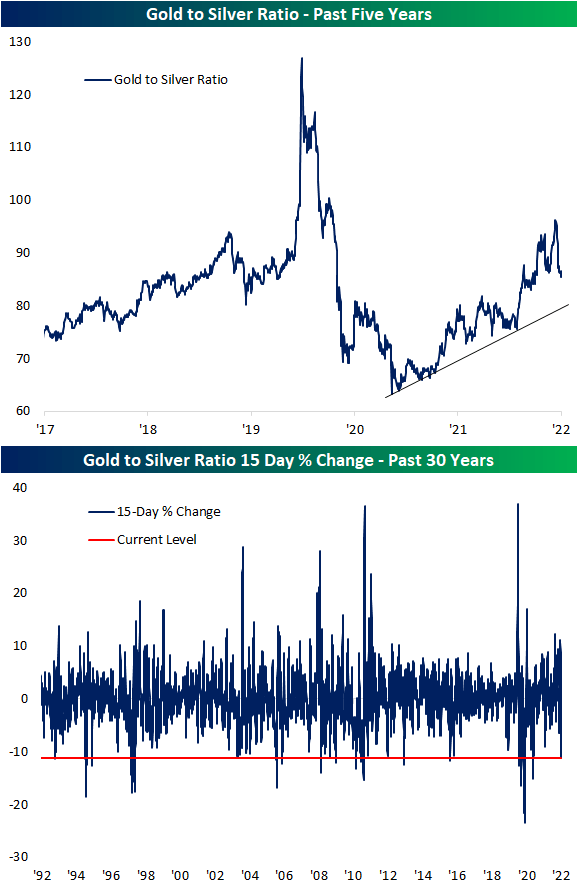
Editor’s Note: The summary bullets for this article were chosen by Seeking Alpha editors.
Be the first to comment