

Comstock/Stockbyte via Getty Images
Since 2020, gold has made two attempts to break out above its 2011 peak of ~$1,900. Both attempts failed. After the early 2022 effort was unsuccessful, gold dropped all the way to the low $1,600s. However, since then, it’s had a stunning reversal, and now it’s on its third attempt at a major breakout. Is the third time the charm? I believe so, and in this article, I will 1) explain why gold declined so aggressively in the second half of last year, and 2) discuss gold’s bullish fundamentals that not only drove the reversal but that will be the catalysts for much higher prices over the next few years.
StockCharts.com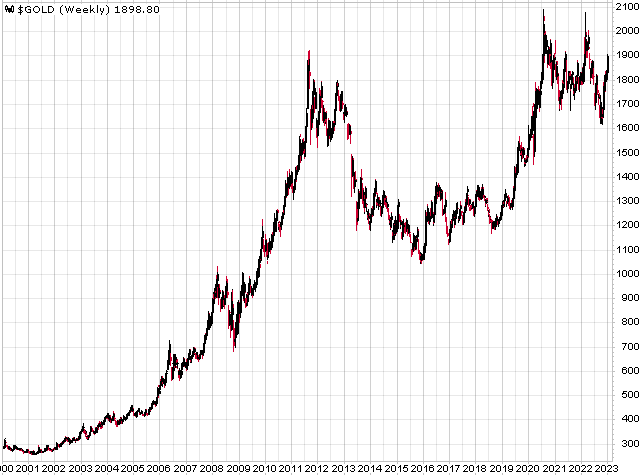
Gold Vs. USD
Many investors believe that gold is influenced by the direction of the U.S. Dollar, but that’s only true during occasional short-term periods—as there are times when there is a strong inverse correlation between the two.
The price of gold is ultimately determined by money supply (i.e., monetary inflation), and real interest rates can also greatly impact demand.
As we entered 2022, price inflation was increasing aggressively in response to surging money supply (M2), and the Fed would soon be raising rates. Gold typically rises with rates—at least until the Fed gets in front of the curve, which might take years—and with inflation soaring and the Fed still not moving on rates, gold and the Au mining stocks were well positioned.
By March and April, that became clear, as the HUI (an index of gold mining stocks) was up almost 30% for the year, the SPDR Gold Trust ETF (GLD) was flirting with double-digit gains, while the Nasdaq was down 15%.
However, as it became evident that inflation was not slowing down but rather accelerating, the Fed began to get more aggressive. The first rate hike started at just 25 basis points in March 2022, then quickly jumped to 50 basis points at the next meeting, and then 75 basis point increases at the four FOMC meetings that followed.
Fed Rate Hikes 2022 (Forbes)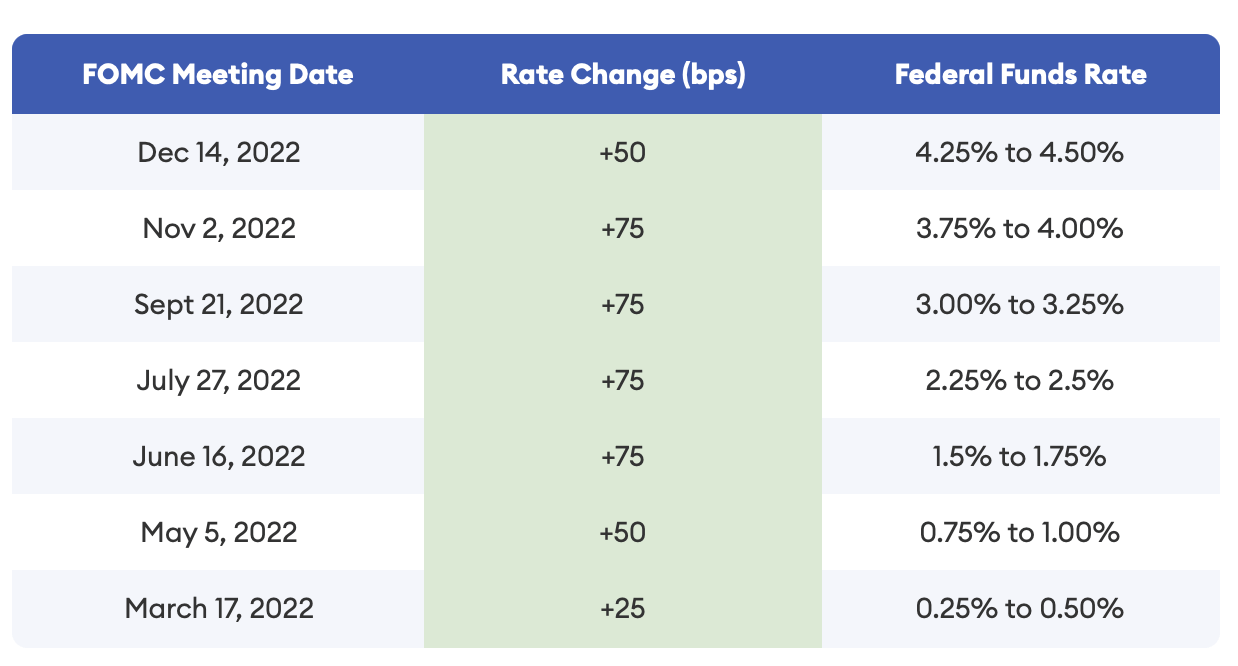
The USD was already on the rebound, having increased 10%, but the action by the Fed created a spike in the dollar, as it hit 115, which was a level not seen since the early 2000s. It was the strength in the USD that crushed gold, not rising interest rates.
StockCharts.com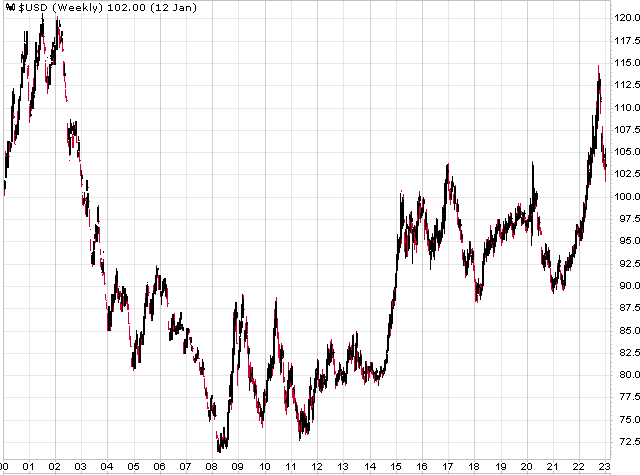
It’s been clear over the last ~9 months that enemy #1 for GLD/gold has been the USD. The strong inverse relationship since April 2022 put tremendous pressure on gold when the dollar was soaring, with the metal down ~15% at the trough, while the USD’s performance had been a mirror image. Since then, the USD has sold off aggressively, which ignited the reversal in gold.
StockCharts.com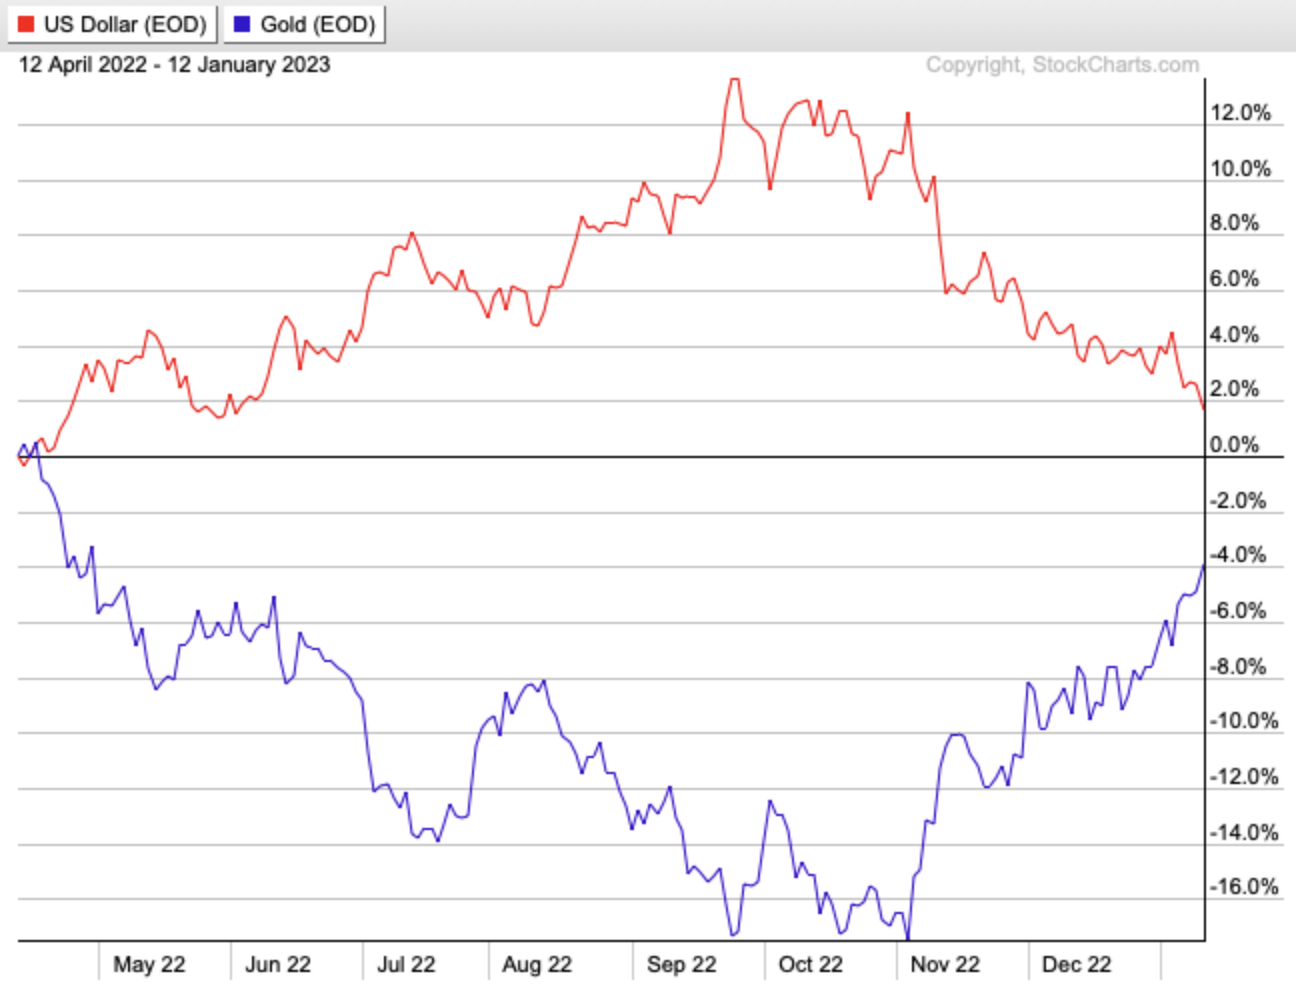
Now, there isn’t—and can’t be—a long-term inverse correlation between the USD and gold, as the value of the dollar doesn’t determine the value of gold.
Let’s deal with extremes to drive this point home. Hypothetically, let’s say the USD increases by 1% annually for the next 50 years. Given the way gold has traded against the greenback and investors’ perceptions of the dollar/gold relationship, that would imply gold would consistently lose value over the next five decades and fall to just under $1,000 per ounce if it suffered a 1% decline every year. Some might say well, that’s not too extreme of a scenario, but that’s not an inflation-adjusted price. If we assume similar inflation over the next 50 years as the previous half-century, that will equate to about a $100-$150 gold price in today’s dollars. That would also mean one could buy roughly 10-15x as much gold as they could today, greatly increasing the overall demand for the metal. Meanwhile, on the supply side, zero gold mining companies would exist because inflation-adjusted AISC would be close to $10,000 in 50 years, yet gold would be ~$1,000.
This is why the laws of supply and demand will never allow gold to trade inverse to the USD over the long-term and why gold’s true relationship is with M2.
And this is exactly why the USD has increased by~45% since its 2008 GFC lows, but gold has increased over 100%, as surging M2 (~200% increase) has driven gold’s gains. Ultra-strong USD price action only acts as a serious headwind for a short period of time. For instance, we saw a similar USD/Gold inverse relationship in the early 2000s, as the USD rose 25% in less than a year, tanking the price of gold. Gold and the dollar only have a temporary inverse relationship, and it’s usually most prevalent when there are extreme increases/decreases in the US$. When currency markets eventually calm, that’s when gold decouples from the dollar and begins to trade based on fundamentals (i.e., money supply and real interest rates). Gold wasn’t behaving as it should have most of last year because of the unrelenting (and unwarranted) strength in the USD, but that wasn’t sustainable and would end, and the metal would make up ground quickly. A strong USD won’t ever prevent gold from reaching its true price.
StockCharts.com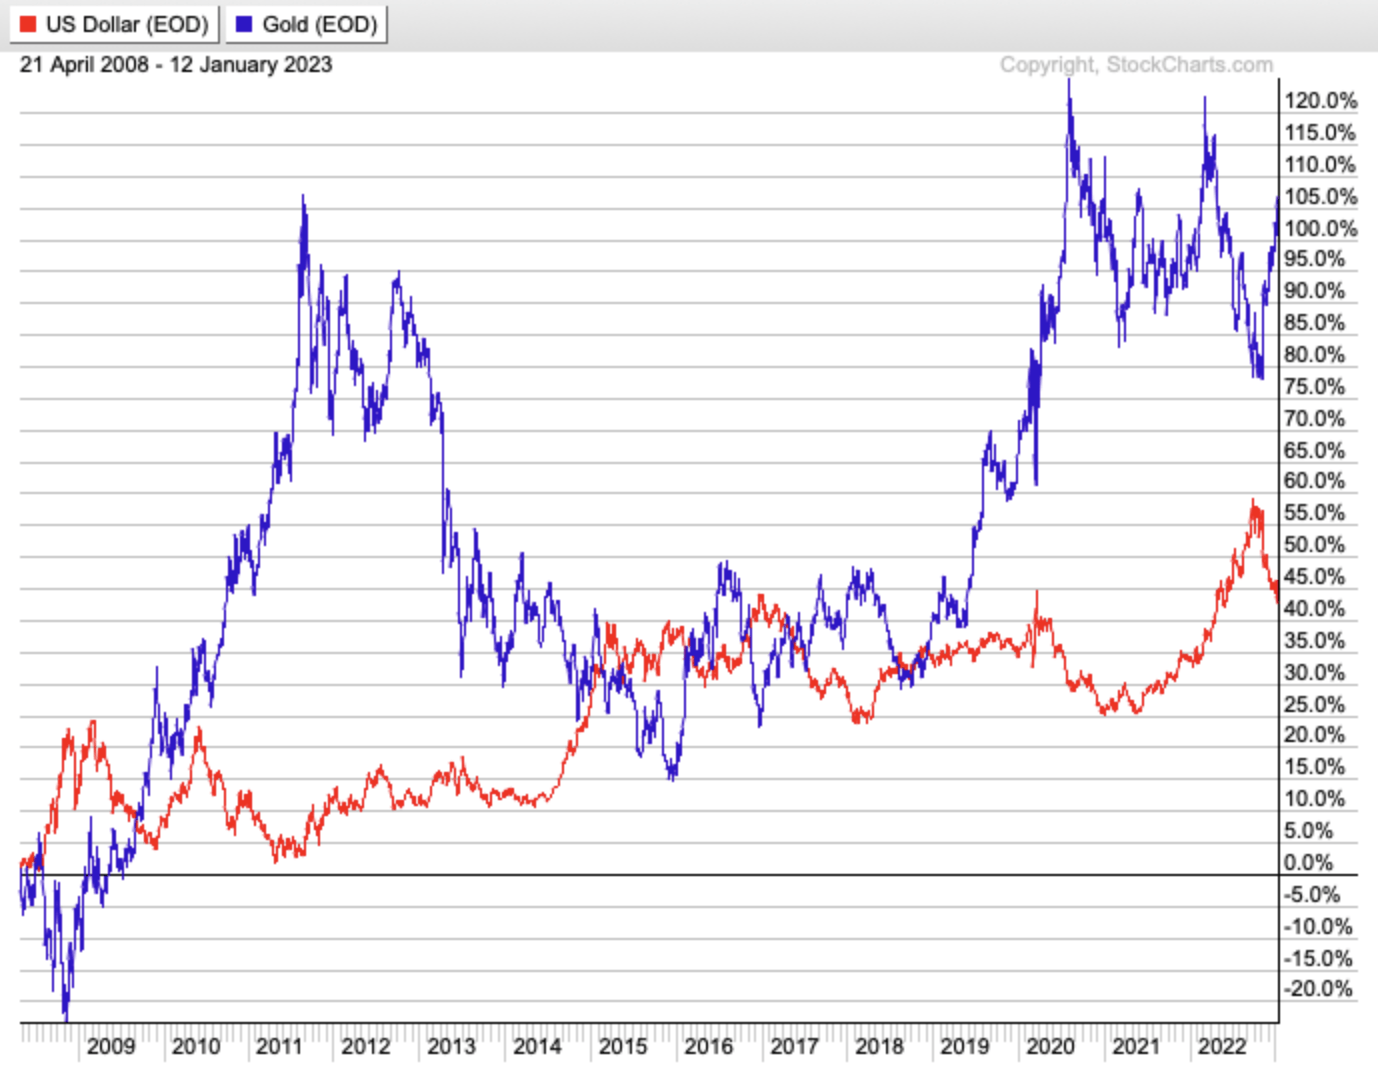
The U.S. Dollar has taken a tumble since September 2022 and has broken down further over the last few weeks. Likely because the move became far overextended, and the Fed is near its target range for rates (at least in the short-term).
Fed Chair Powell has remained hawkish, but with the Fed Funds rate at 4.25-4.50% and the FOMC participants expecting the rate to top out at 5.1% over the next few meetings, the central bank isn’t too far from its goal. Roughly 75 basis points more is all that’s required, if we are to believe that the latest projection by Fed members is accurate. While that’s a higher target rate than what was projected in September, it does appear that inflation has peaked in the short-term, and this estimate could prove accurate.
For the USD, I believe that it’s a negative that the Fed is close to its 5.1% target, especially since the ECB is also raising rates aggressively and has much further to go. If the Fed Funds rate peaks within the next few months while the ECB continues to raise rates, it will be tougher for the USD to regain its rally form, which will be bullish for gold if the inverse correlation remains intact for longer.
Again, eventually, the correlation breaks, and we could already be past that point. The real test for gold will be how it reacts if the USD puts in a modest reversal higher. If both the metal and greenback rally together, then we know gold is back to trading on fundamentals.
And let’s discuss those now.
The Fundamentals That Are Driving Gold Higher
1) Gold Undervalued Relative To Recent Expansion of U.S. Money Supply
The money supply is the total amount of money in circulation and includes cash, coins, and balances in bank accounts.
M2 (one of the broadest measures of the money supply) in the U.S. had increased at an average annual rate of 5-10% for the first two decades of this century before the pandemic hit. The Federal Reserve and U.S. Government—and other central banks and governments around the world—responded to the crisis by flooding consumers and businesses with cash funded by the creation of new money, which resulted in an unprecedented spike in M2. In less than two years, M2 in the U.S. had increased by almost 50%.
FRED
What determines gold’s value is monetary inflation. M2 continually increases with time, and gold follows the money supply higher over the decades, with the metal going through its own bull/bear cycles (oscillating around M2 on the way higher). Sometimes, gold trades well above fair value relative to M2, sometimes below. The last two major bull markets (1970-1980 and 2001-2011) saw gold spike to levels that were multiples of fair value based on the money supply. Gold was about 25-30% below fair value last year at the lows—a pricing environment that wasn’t sustainable. Despite the robust recovery, gold is still ~15% below fair value today, and it will likely increase to a price that greatly exceeds fair value as this bull market progresses. M2 has been flat over the last year, but by no means is inflation contained. Inflation comes in waves, and the second wave will be caused by a renewed surge in M2, followed by higher price inflation.
SomaBull Research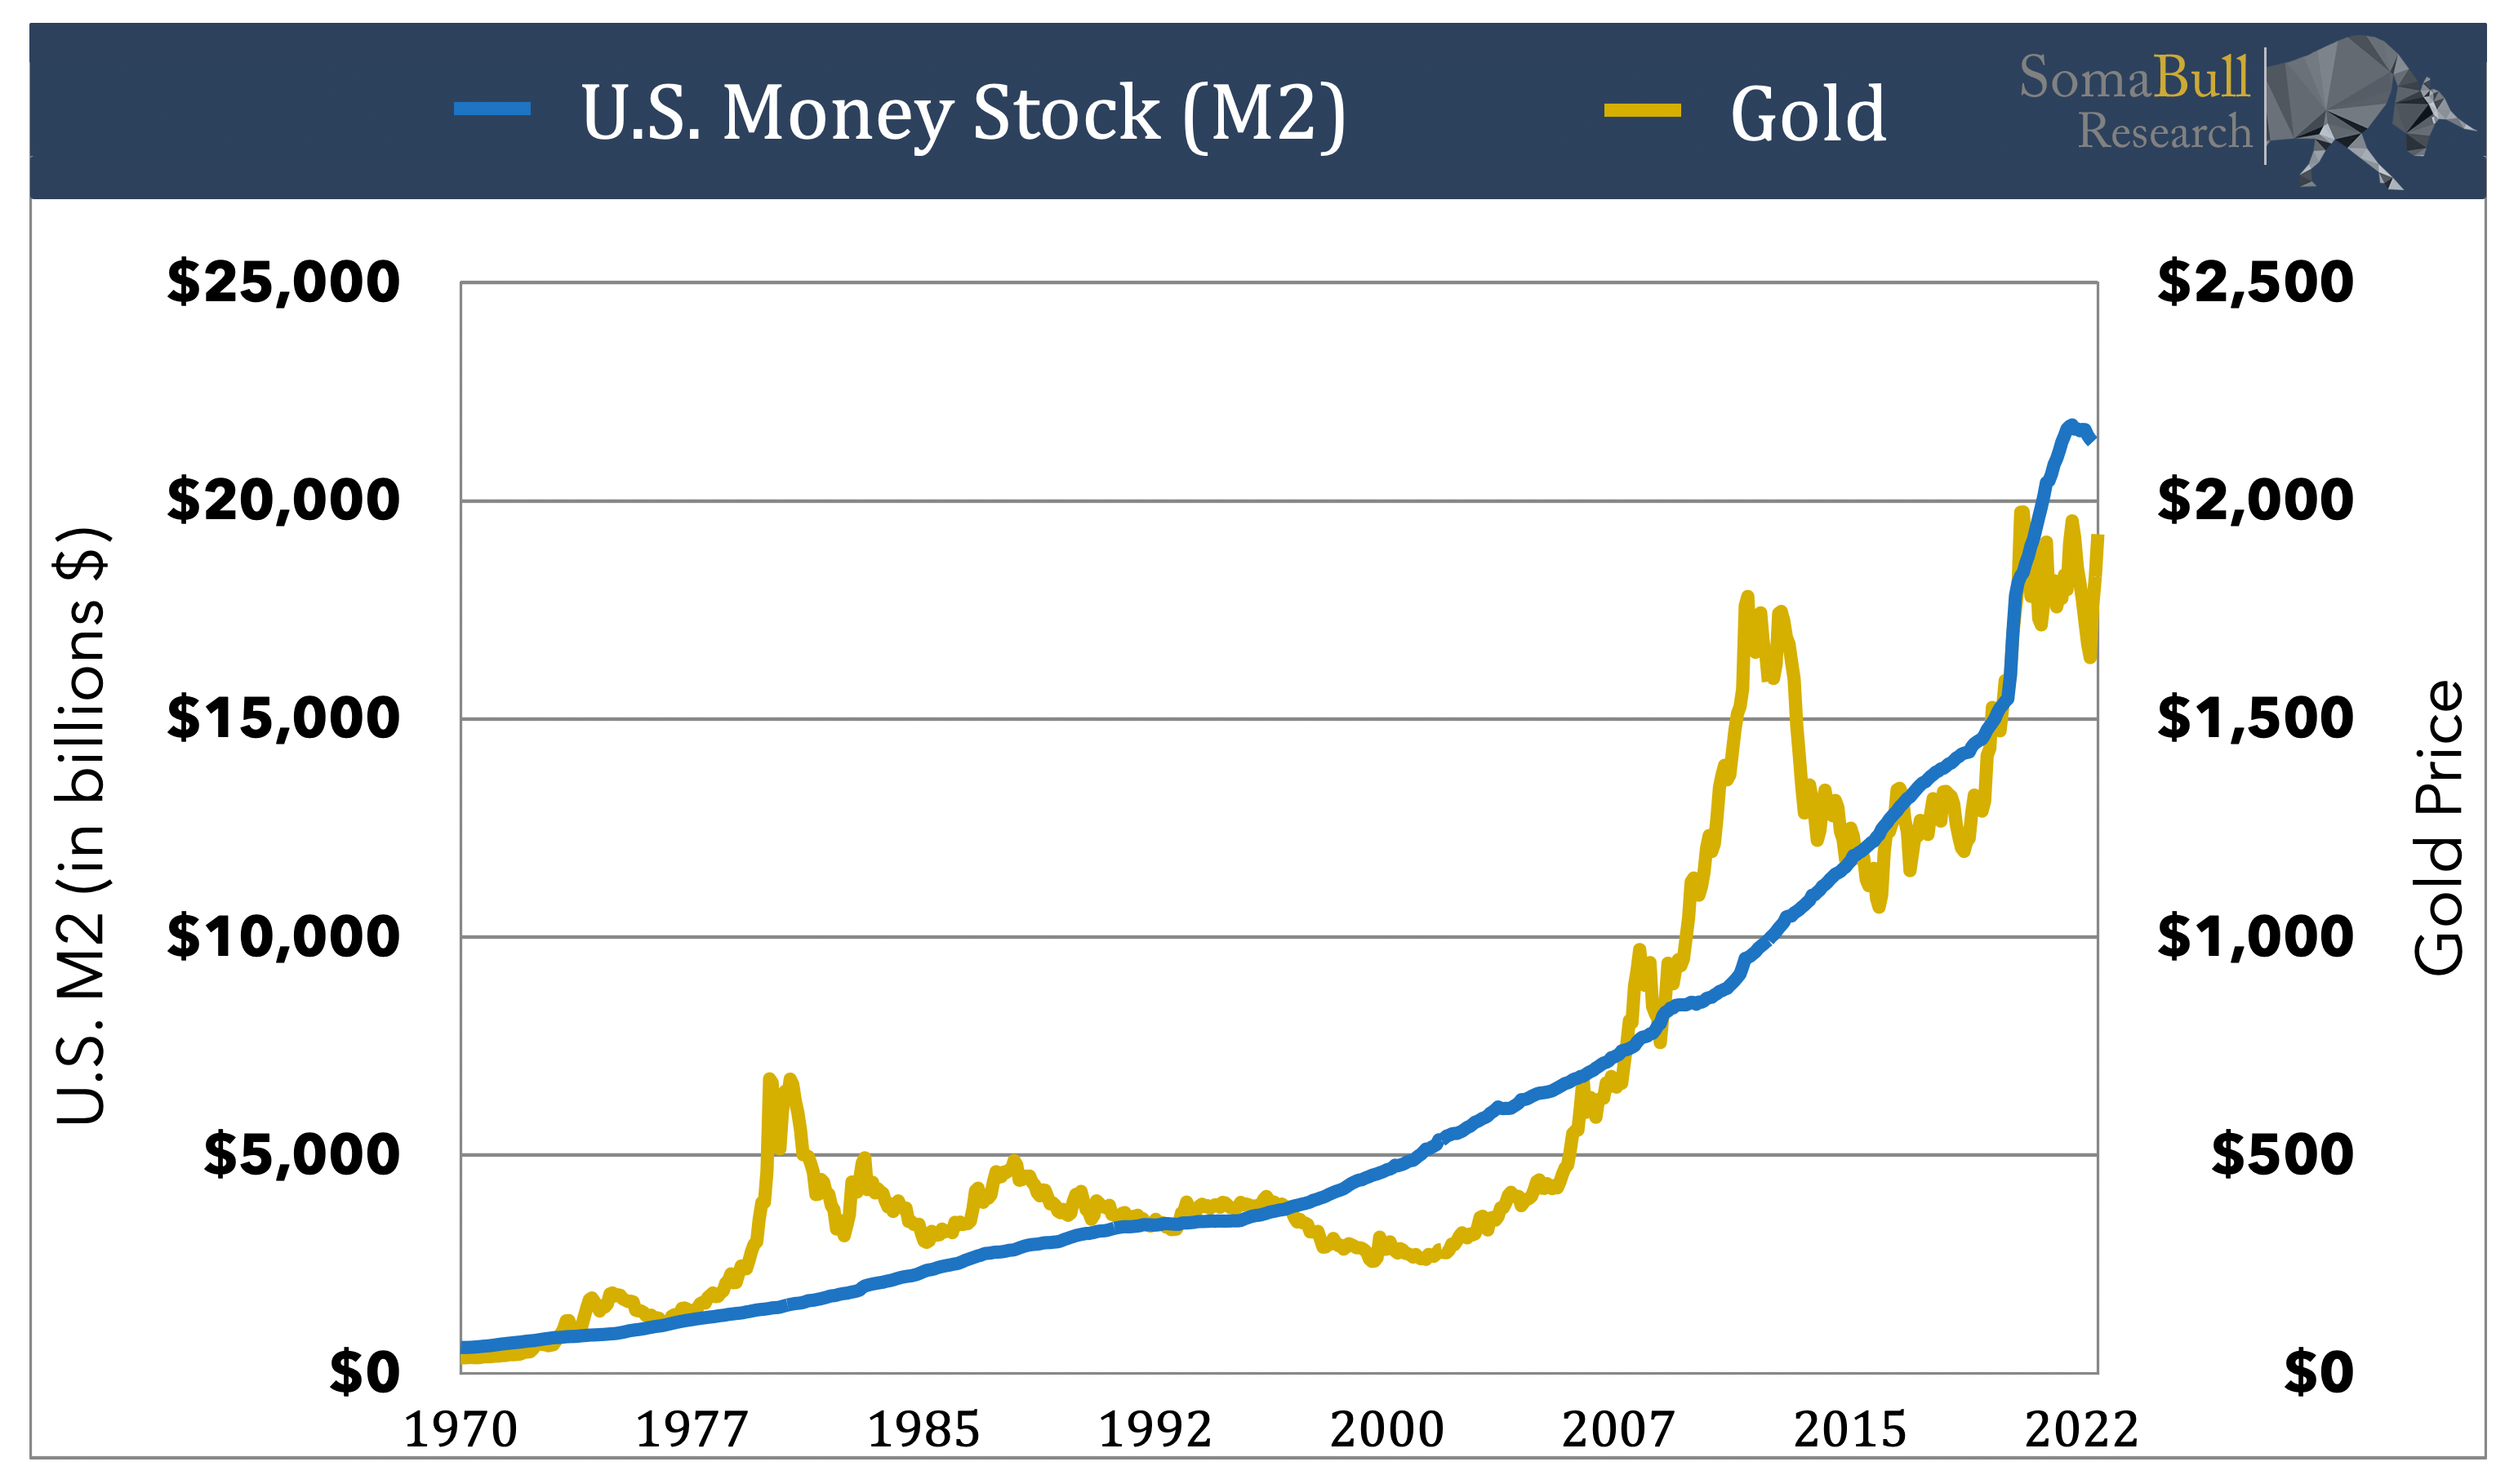
2) Negative Real Interest Rates Further Driving Demand For Gold
Gold performs best during periods of high inflation and negative real yields. To explain the mechanics, when prices for goods and services are increasing at a rate much faster than the typical average, central banks are usually behind the curve and fighting an uphill battle.
It’s in this environment where real interest rates are negative (i.e., yields on government bonds are lower than the inflation rate), which makes gold a more attractive investment than other asset classes as it preserves purchasing power.
Let’s use a real-world example.
The 10-year U.S. Treasury rate is currently 3.5%, which is lower than the most recent CPI that showed the all items index at 6.5% for the 12 months ending December 2022 and the core index (less food and energy) at 5.7% over the last 12 months. As a result, Treasuries of all durations are generating a negative real return, and investors that buy them are losing out to inflation. Gold, on the other hand, preserves purchasing power, making it a far more attractive investment during periods of negative real interest rates.
Real yields have reversed but are still well in negative territory. It’s quite a similar environment to the 1970s stagflation era in the U.S., with slowing growth, persistently high inflation, and the Fed behind the curve.
FRED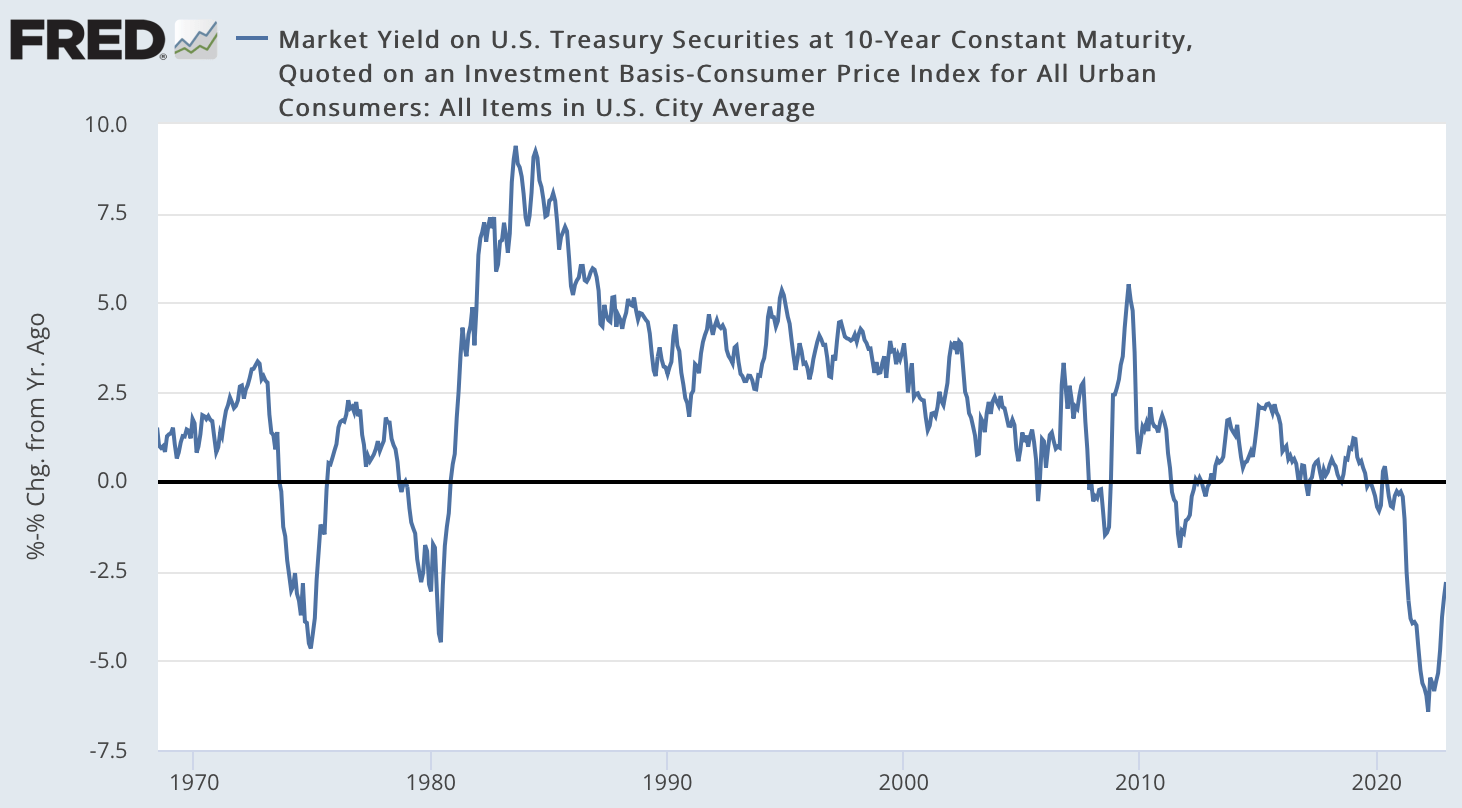
As stagflation continues, real interest rates will remain in negative territory for the foreseeable future or at least have a bias toward this direction.
Stagflation favors gold over stocks, bonds, and other commodities, as the precious metal has the highest annualized average return in this environment compared to those investments.
World Gold Council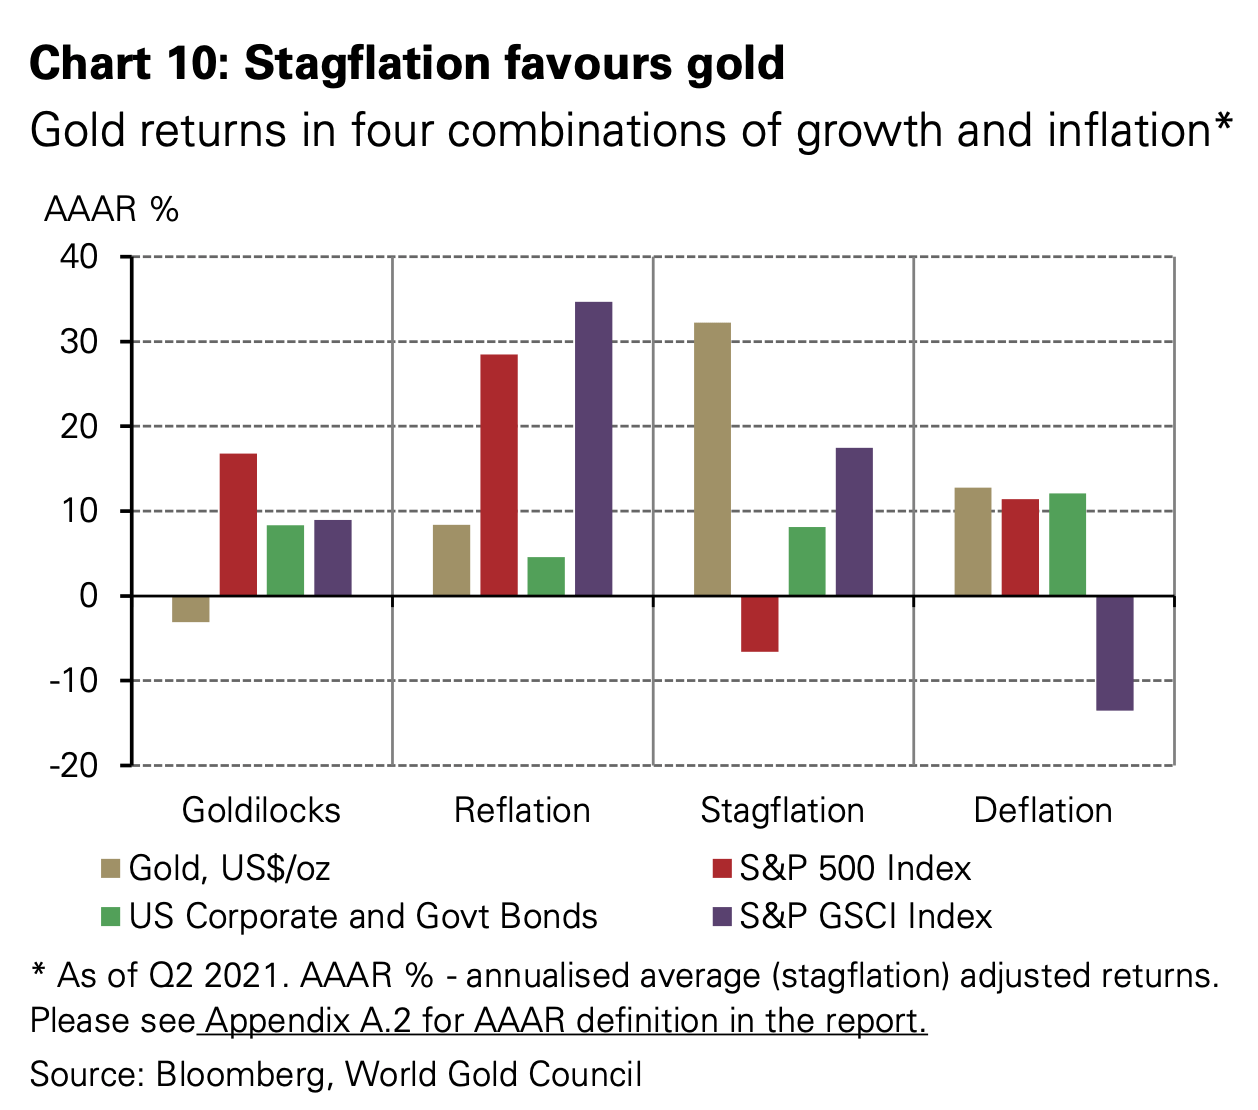
There are some that have the misguided belief that gold is a poor hedge against inflation, and they use the 1980-2000 period as an example. The critical flaw in this argument is it fails to understand the difference between positive and negative real interest rates and the impact each setting has on gold. Not all inflation is the same.
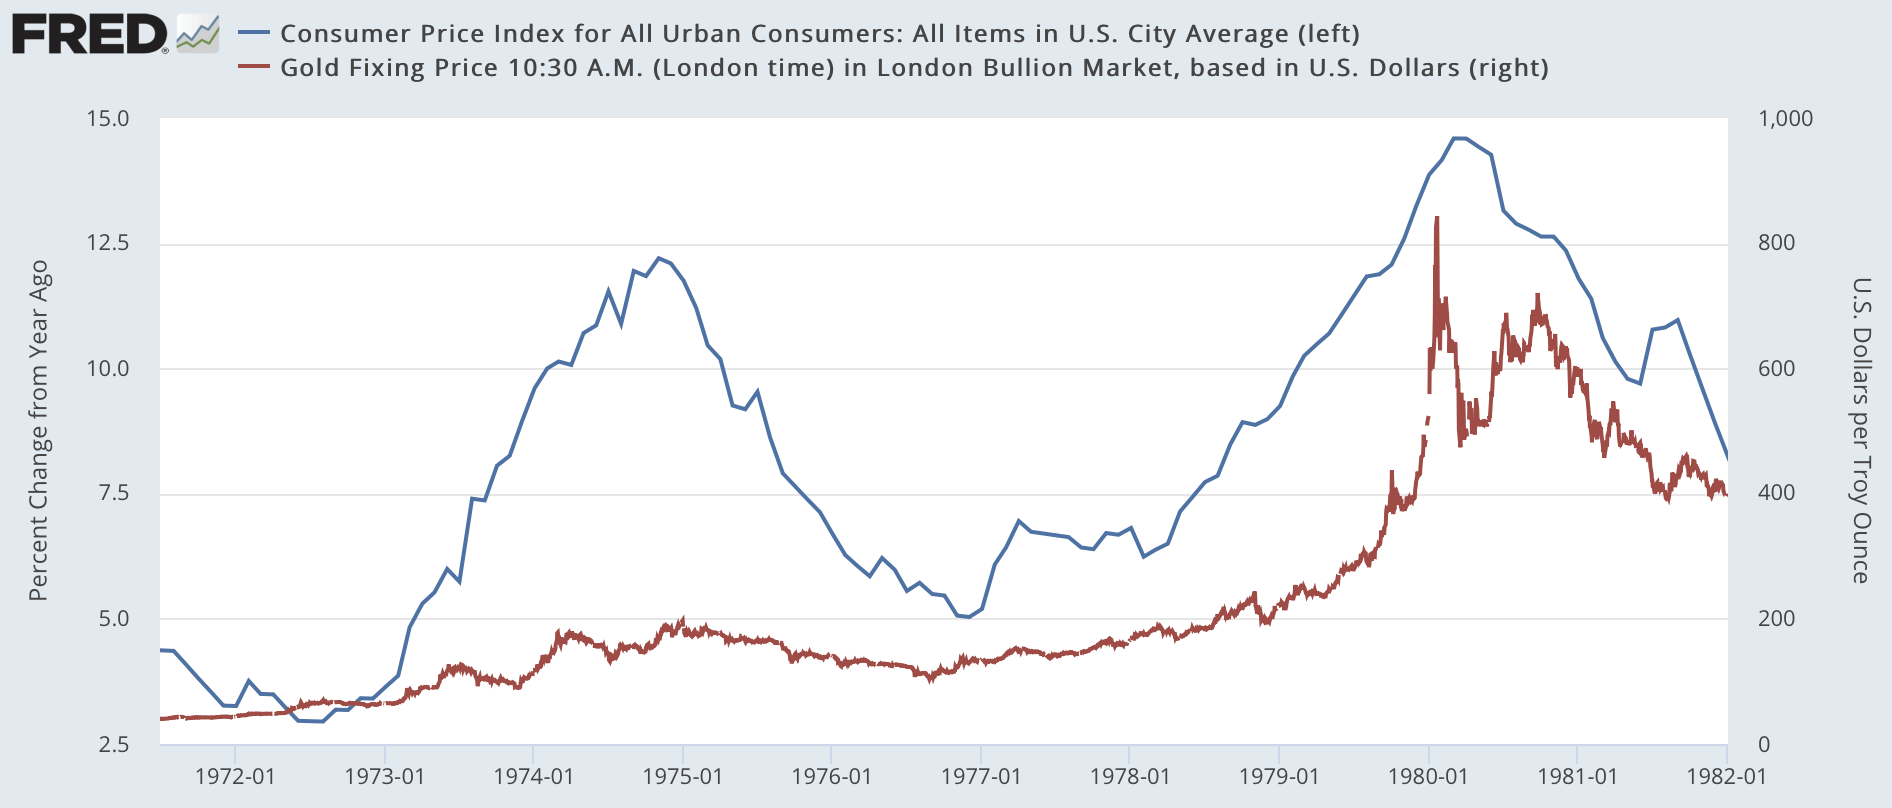
Gold and the CPI were highly correlated in the 1970s, as the rate of inflation was well above interest rates for most of the decade.
3) Rising Interest On U.S. Debt Creates Snowball Effect
Twenty years ago, the average interest rate on U.S. Treasury Securities was 6.5%; last year, the average dropped to under 1.6%. While U.S. debt has increased by more than 5x since 2000 (from just over $5 trillion to over $30 trillion), interest on the public debt has remained manageable because of the consistent trend of declining interest rates over the last 2+ decades. However, now that trend has reversed, and the great bond bull market has ended and bonds have entered a bear market. As interest rates return to more historically normal levels, the interest rate on the debt will continue to climb as the debt rolls over. The problem is interest on the debt will be well over $1 trillion as rates normalize, which leads to higher annual deficits and higher debt. It’s a snowball effect as debt and deficits grow larger and at a more rapid pace. The U.S. can’t manage a scenario where it’s paying 6-7% interest on its debt like in the early 2000s. 3-4% is the breaking point, in my opinion. This is why it’s imperative for the Fed to get inflation back below 2% ASAP, but they are fighting a battle they likely cannot win. At this point, it’s just simple math and logical reasoning.
Treasury.gov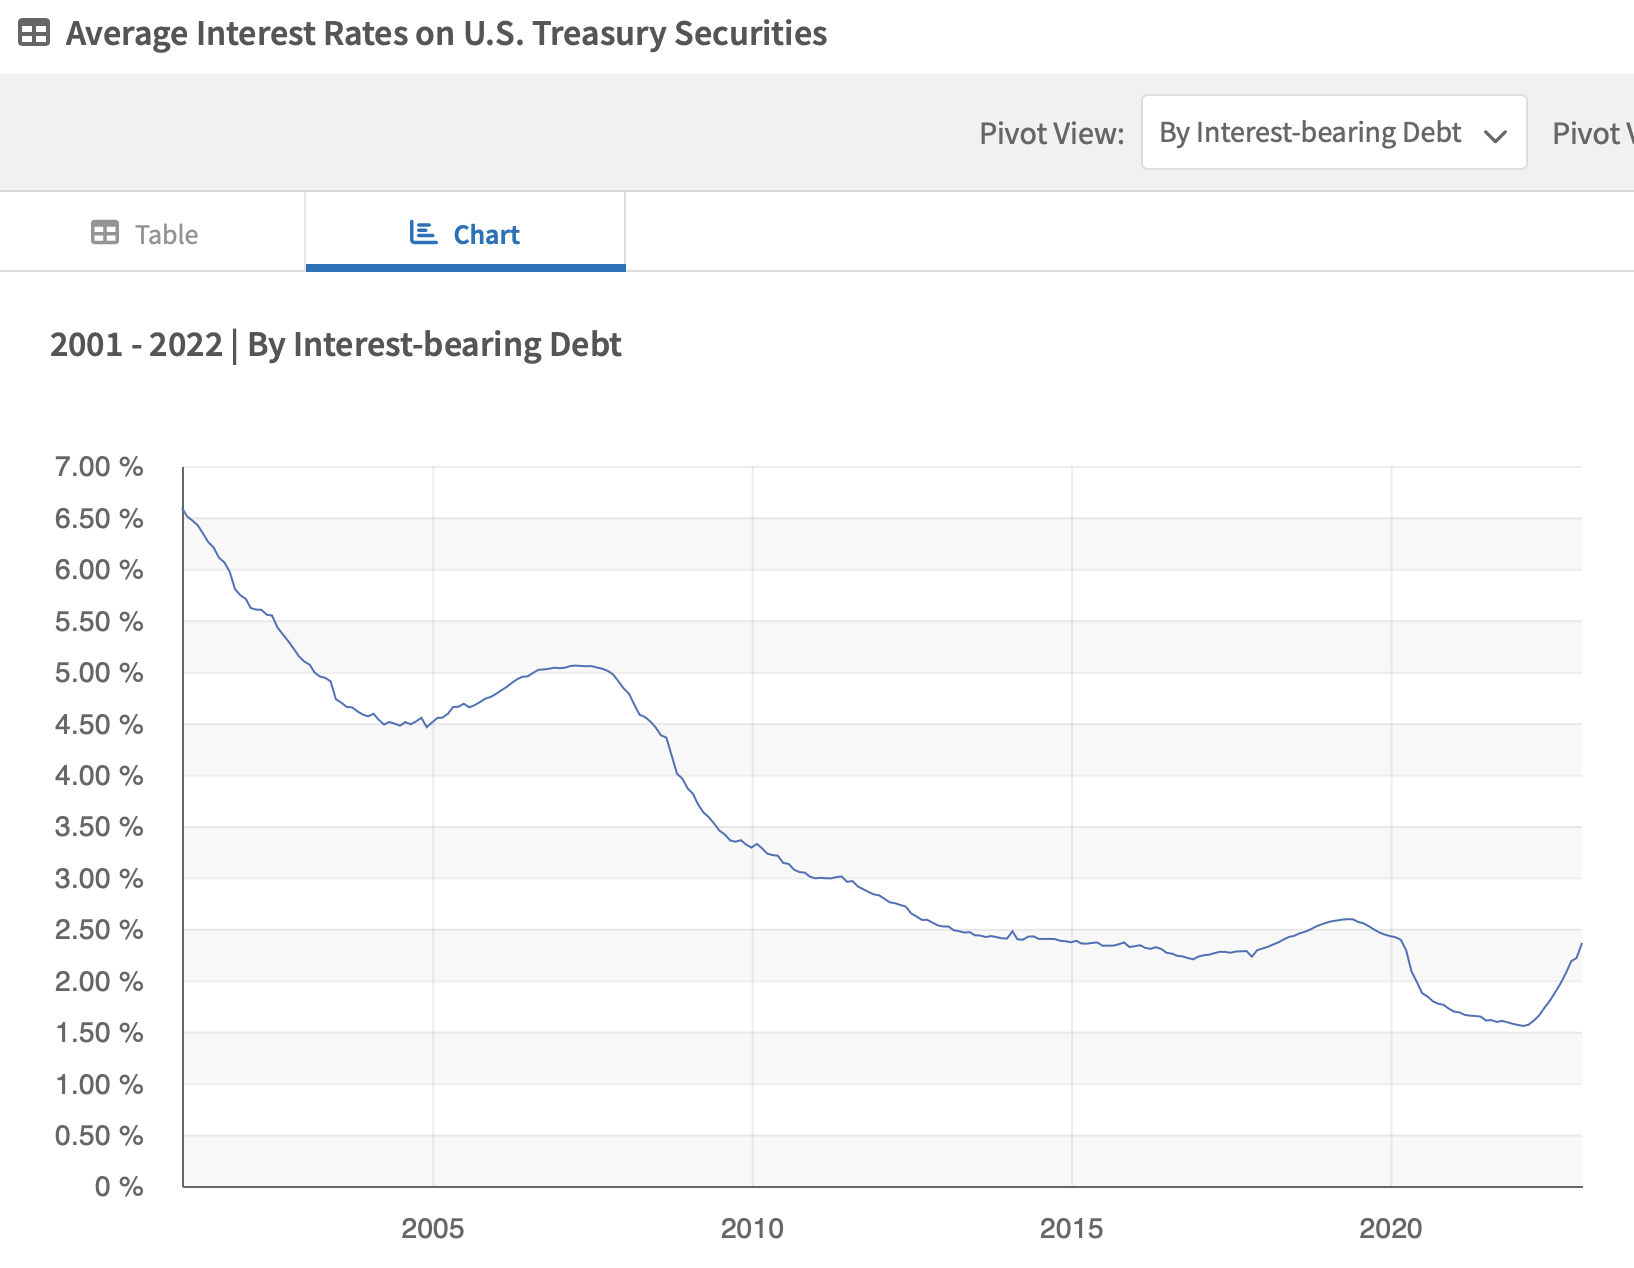
The moment this multi-decade downtrend in average interest reversed was the defining moment for gold.
The impact that rising rates will have on the amount of interest the U.S. pays on its debt is part of the central theme of the bullish thesis on the precious metal.
4) Flat To Declining Worldwide Gold Production
Since 2018, worldwide gold production has been flat to declining (the graph below shows the mined tonnes through the first three quarters of each year). The deep bear market from 2011-2015 resulted in a sharp pullback in exploration budgets, the cessation of building mega-gold projects, and a change in the “growth and any cost” plans of producers. Despite the rebound in the gold price, the mining stocks have continued to trade at incredibly low valuations compared to their historical average, and companies are still conservative with exploration and project budgets and focused on generating cash flow rather than producing more ounces. This recovery hasn’t been like previous ones where higher gold prices have typically acted as a catalyst to drive companies to spend on exploration and expand their production. The senior gold producers aren’t projecting any growth over the next decade, and unless the price of gold rises to $2,500, it’s unlikely that the industry will feel secure enough to start aggressively exploring and building mines again.
World Gold Council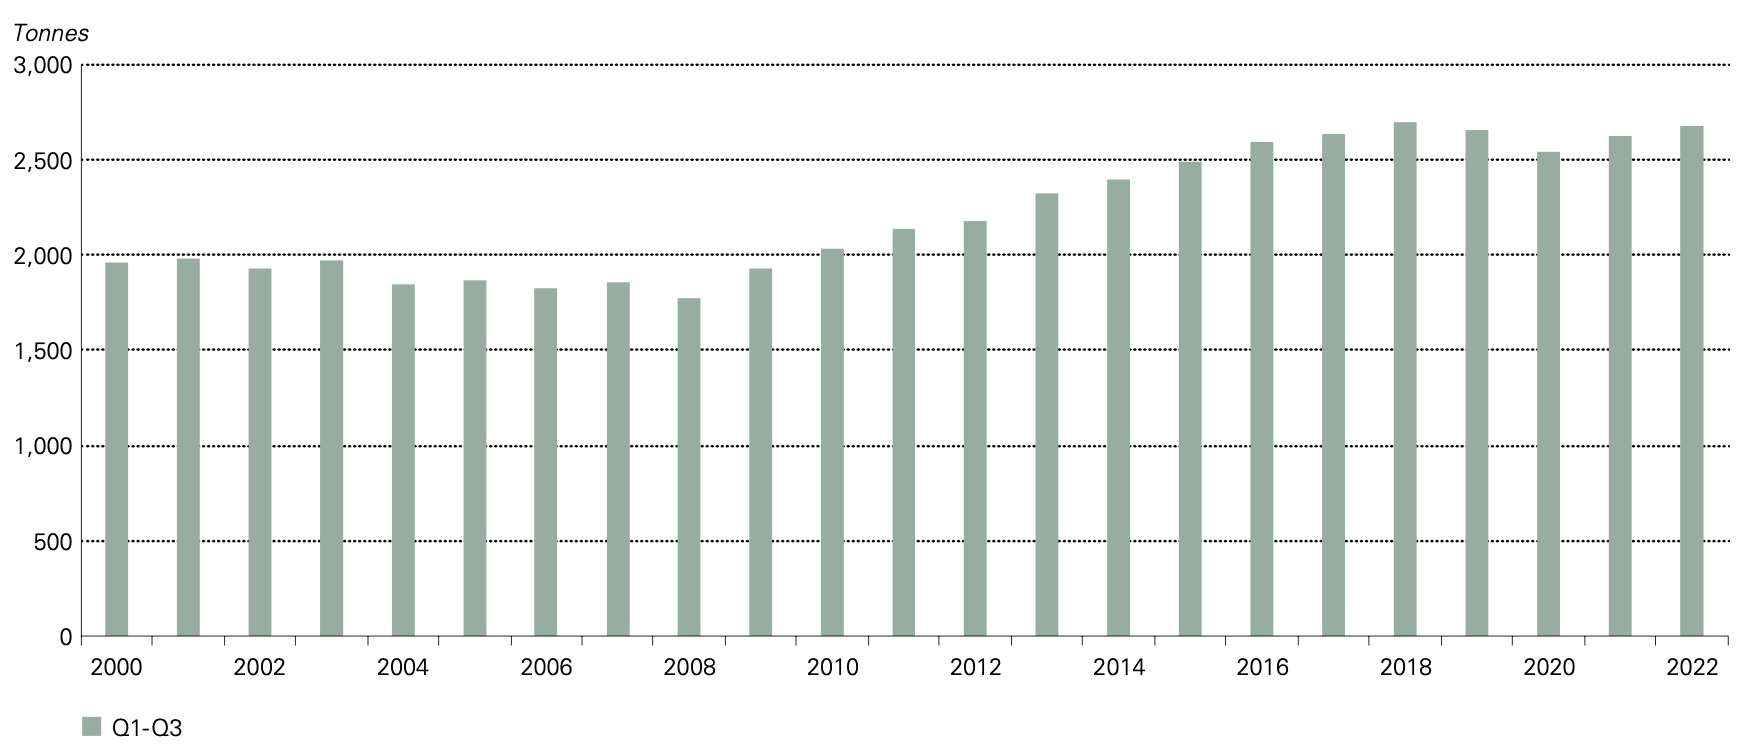
5) Rebound In Consumer Gold Demand In India And China And Surging Central Bank Demand
India and China are the largest consumer markets for gold. India has seen a rebound in gold jewelry demand, which is now back to pre-Covid levels.
World Gold Council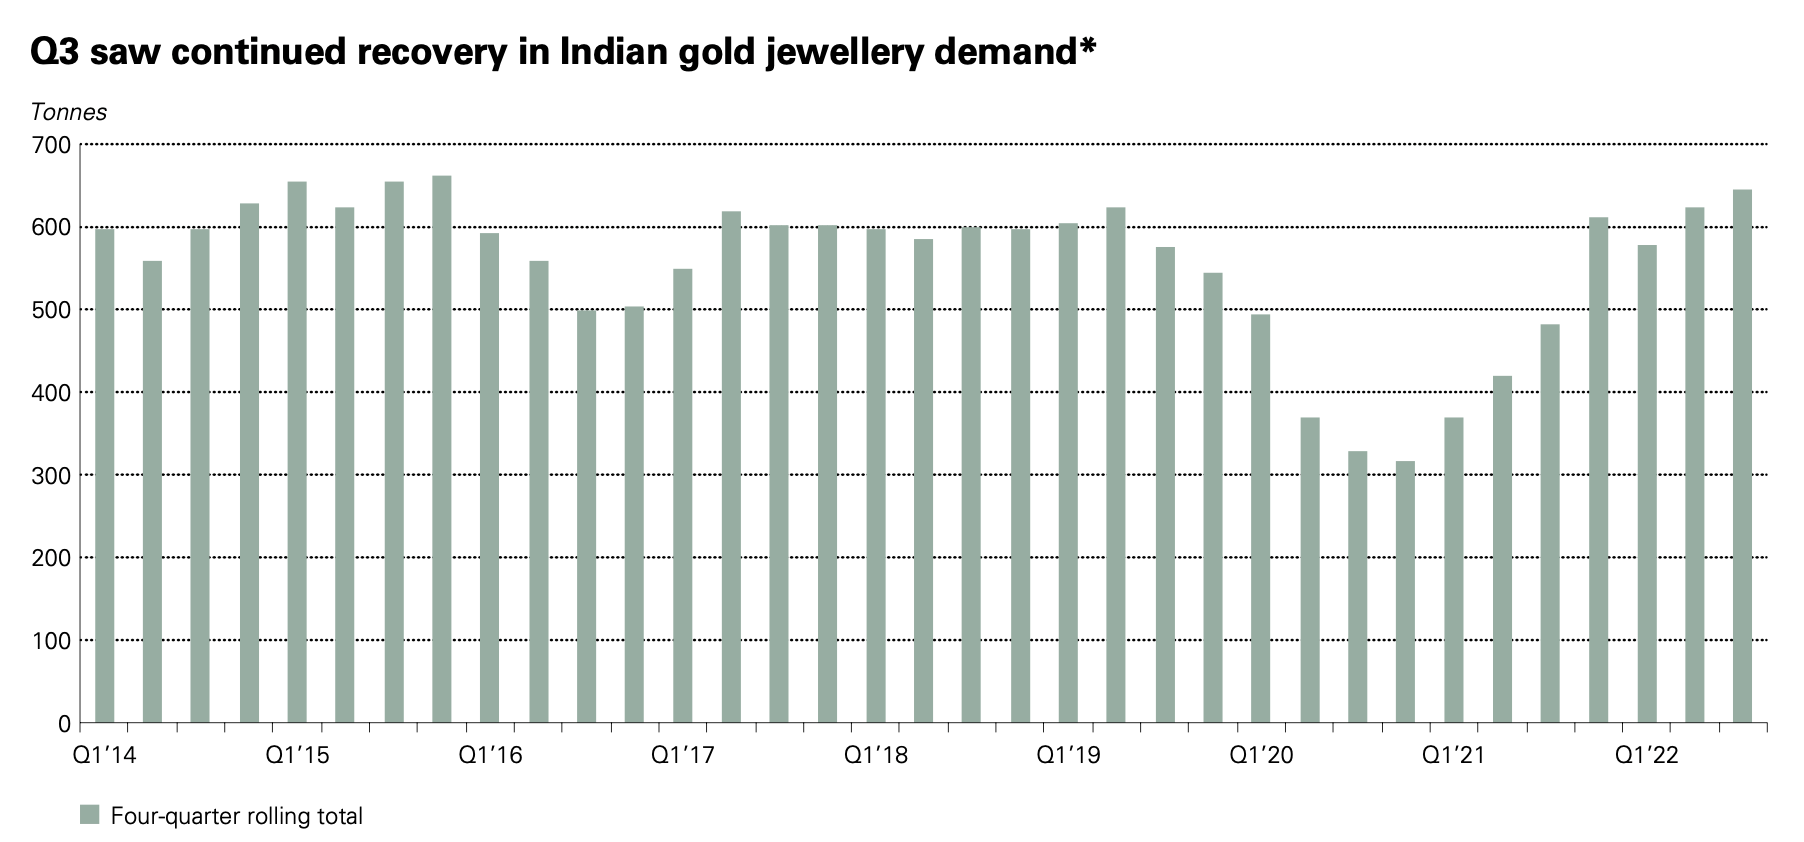
Meanwhile, gold’s popularity in China has risen dramatically compared to previous years, with demand for the precious metal for all occasions far higher than the other categories shown.
World Gold Council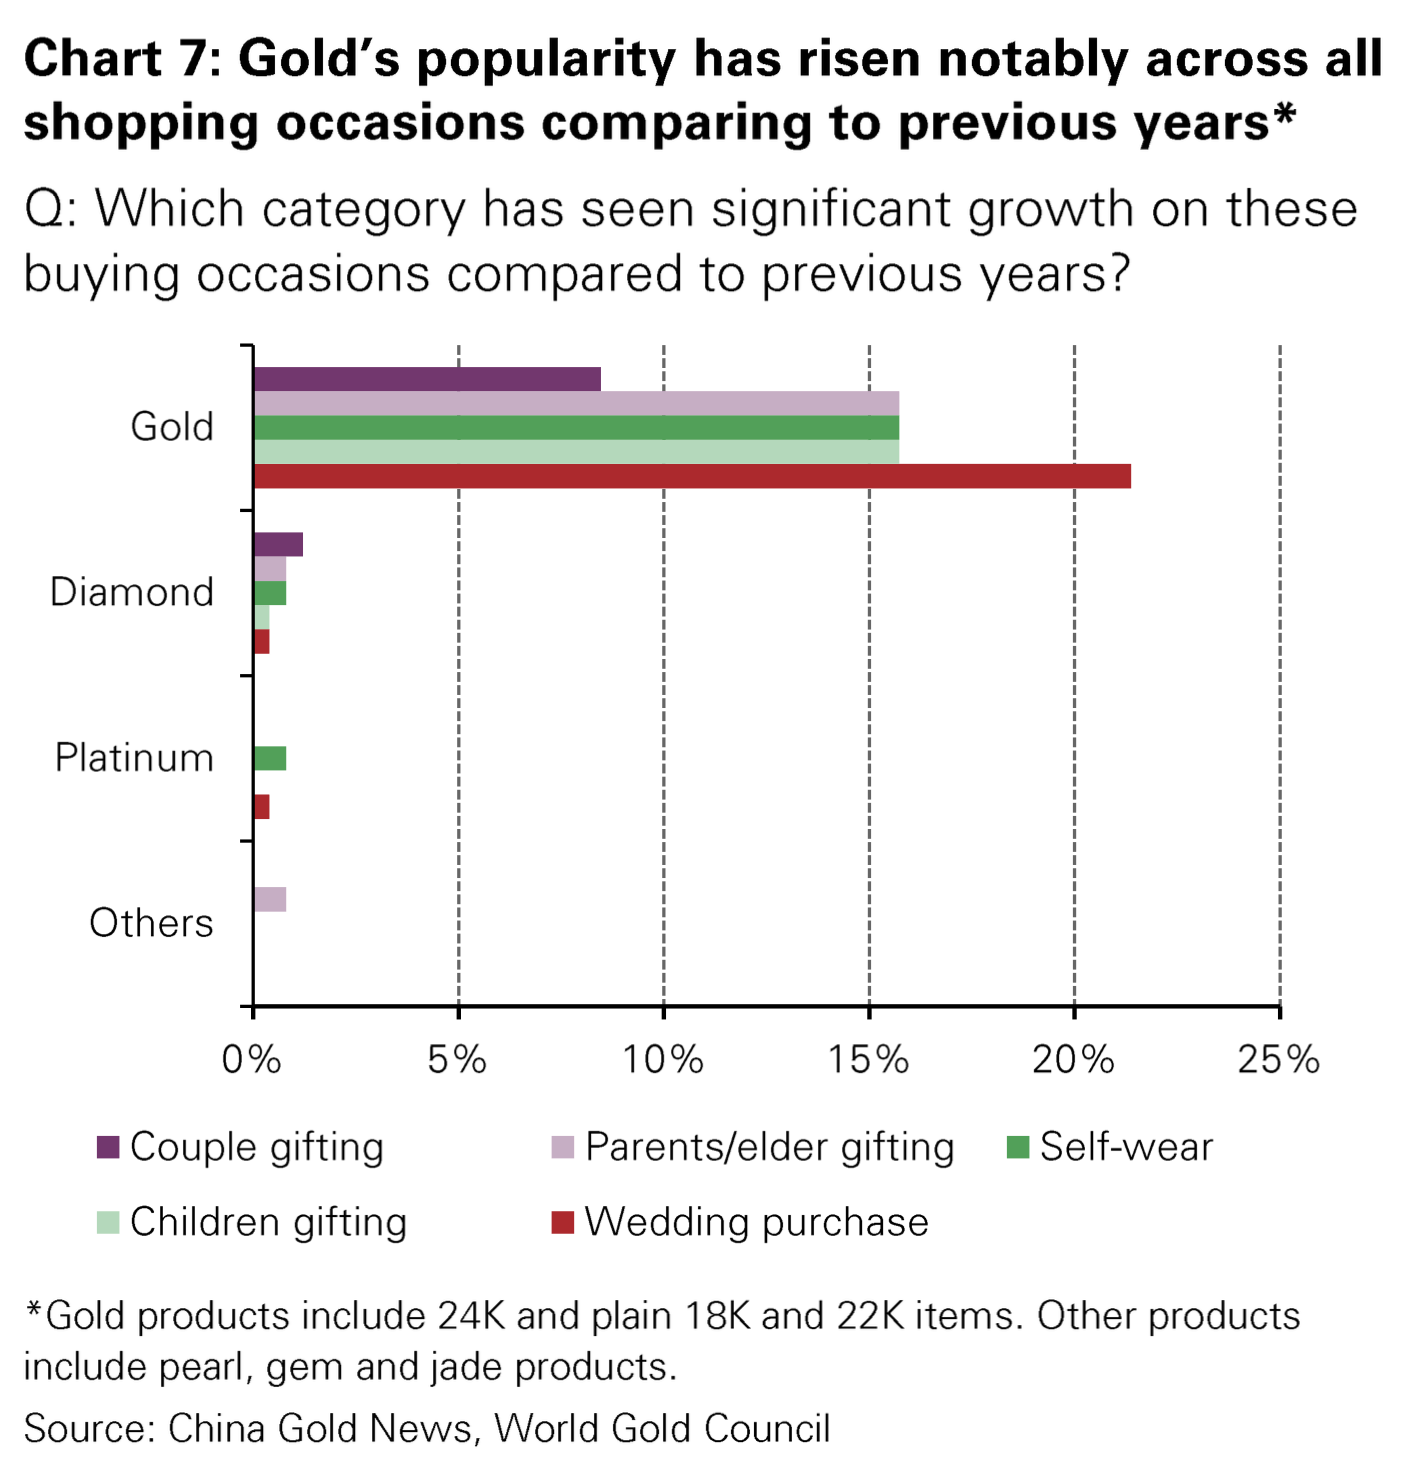
Central bank demand saw a staggering increase in Q3 2022, as almost 400t of gold was purchased during the quarter, which according to the World Gold Council, is the largest single quarter of demand from this sector in their records going back to 2000 and almost double the previous record of 241t in Q3 2018. Central banks bought more gold in the first three quarters of last year (673t) than any other full year since 1967.
World Gold Council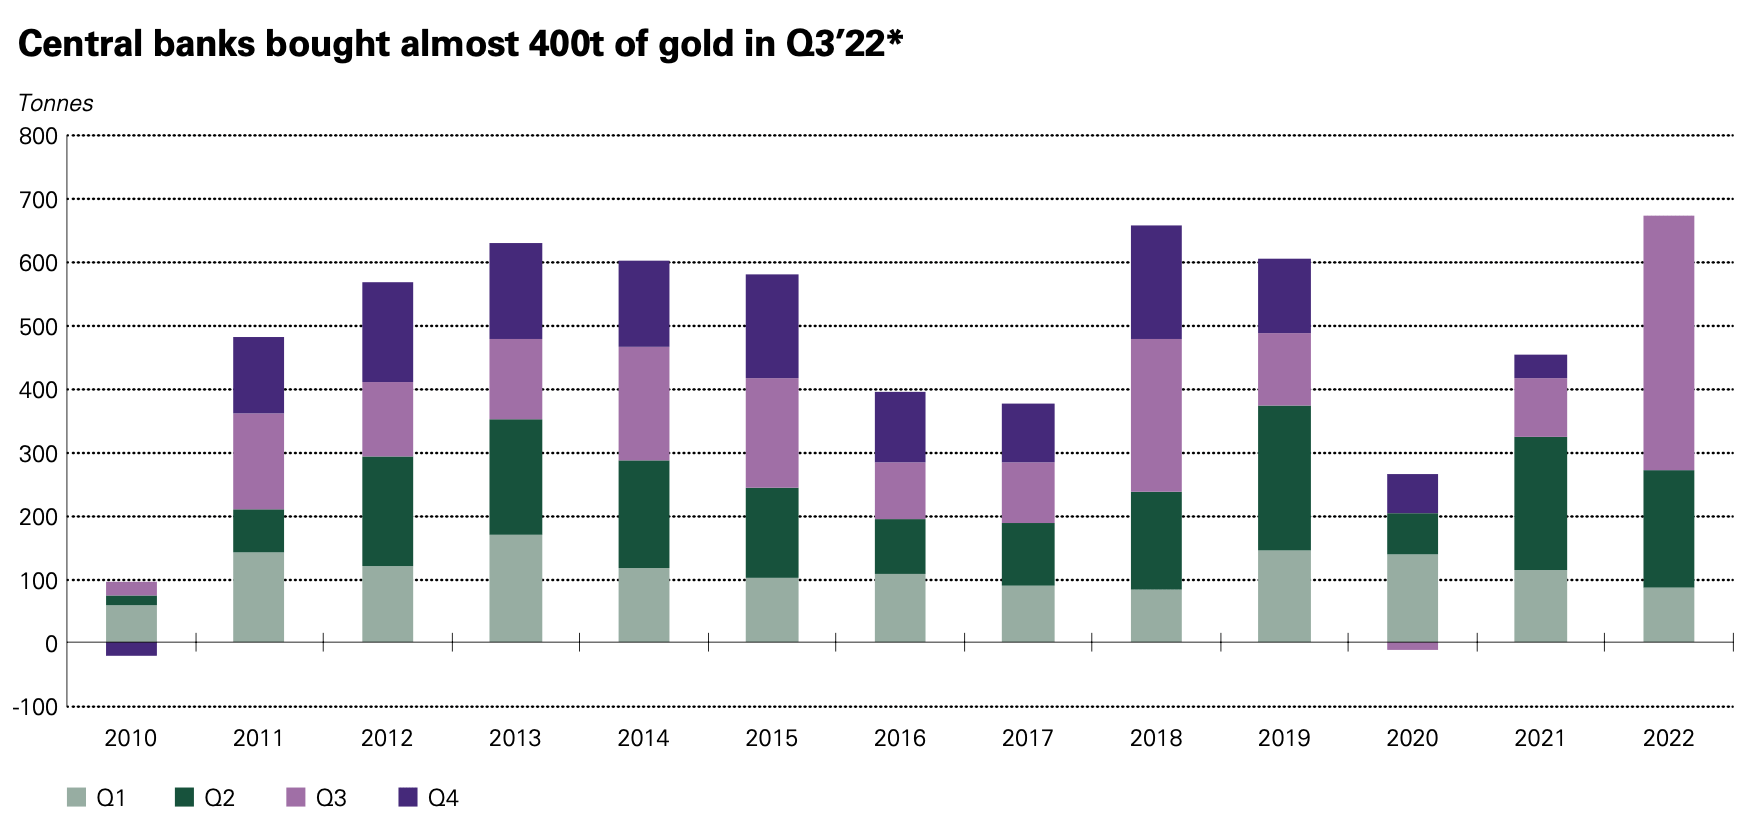
In Summary
The strength of the USD last year temporarily derailed/delayed the gold bull market, but in terms of the sector’s bullish fundamentals and gold’s bullish long-term technicals, nothing has changed.
The analogy of trying to hold a beach ball underwater seems apropos.
Gold continues to be one of the best-positioned asset classes as we are now in an environment similar to the 1970s and will have several waves of inflation over the coming years.
Editor’s Note: This article covers one or more microcap stocks. Please be aware of the risks associated with these stocks.
Be the first to comment