

Gold Price (XAU/USD), Chart, and Analysis
- Gold may struggle to hold support.
- Financial markets suggest the Fed will hike rates by a further 225bps this year.
A notable support level for gold around $1,916/oz. is being tested again today and this looks likely to break soon as US interest rate hike expectations continue to climb. The market now expects a fraction under 225 basis points of additional rate hikes over the last six FOMC meetings this year, with the real possibility that the Fed will front-load these increases. It currently looks like there will be three hikes of 50 basis points, with two of them penciled in for the May and June meetings, and three additional 25 basis point increases over the rest of the year. With interest rates on the rise, and sharply, the allure of non-interest-bearing gold will continue to fade.
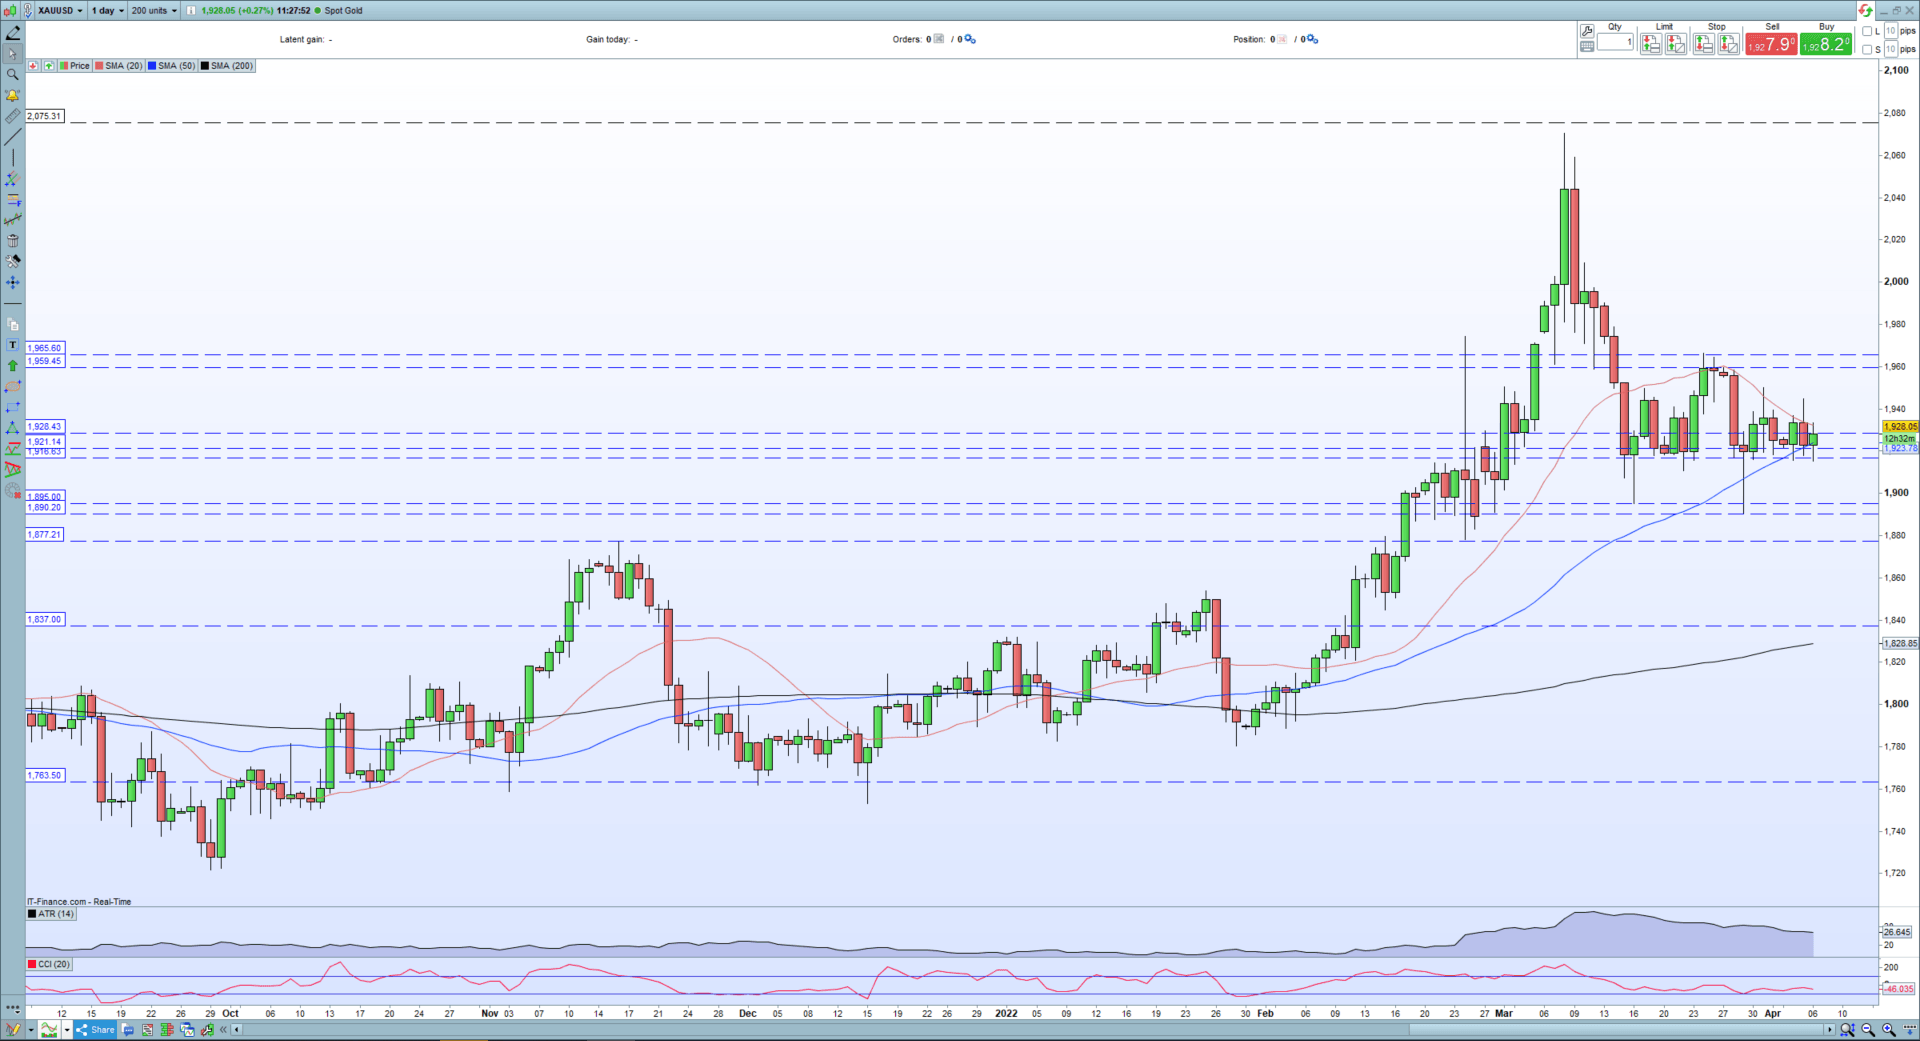
Gold is now trading around $1,929/oz. and has given back nearly all of the war bid rally that started in late February when Russia invaded Ukraine. One zone on the chart that continues to draw attention is either side of $1,916/oz. the June 1 2021 swing-high and a few dollars under the 61.8% Fibonacci retracement level of the August 2020/August 2021 sell-off that is situated at $1,921/oz. This area has been repeatedly tested over the last three weeks and while it has been broken, these breaks have been pulled back immediately. It may well be that a close and open below this level may happen soon which would expose $1,895/oz. and $1,890/oz. once again. The 20-day sma is pointing lower and looks set to trade below the 50-day sma, adding another negative signal on the daily chart.
Gold Daily Price Chart – April 6, 2022
Retail trader data show 78.06% of traders are net-long with the ratio of traders long to short at 3.56 to 1. The number of traders net-long is 3.40% higher than yesterday and 3.68% higher from last week, while the number of traders net-short is 12.27% lower than yesterday and 3.81% lower from last week.
We typically take a contrarian view to crowd sentiment, and the fact traders are net-long suggests Gold prices may continue to fall. Traders are further net-long than yesterday and last week, and the combination of current sentiment and recent changes gives us a stronger Gold-bearish contrarian trading bias.
What are your views on Gold – bullish or bearish?? You can let us know via the form at the end of this piece or you can contact the author via Twitter @nickcawley1.
Be the first to comment