

Gold Talking Points
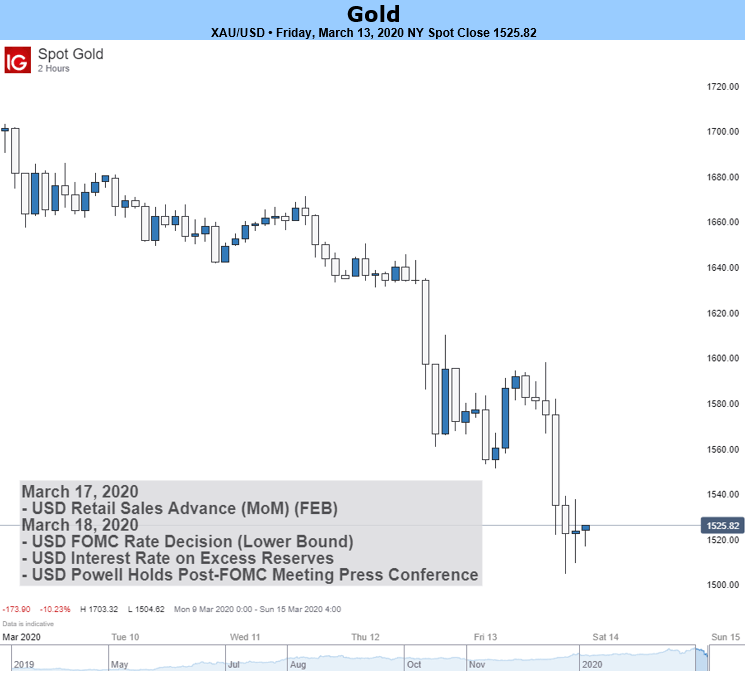
The price of gold pulls back from a fresh yearly high ($1704) as the Federal Reserve takes additional steps to combat COVID-19, but speculation for lower US interest rates may curb the recent weakness in bullion as Chairman Jerome Powell and Co. are widely expected to deliver another rate cut in March.
Fundamental Forecast for Gold: Bullish
The price of gold slipped to a fresh monthly low ($1552) as the Federal Reserve pledged to ramp up its repo operations and provide $1.5 trillion in US Dollar liquidity in order to “address highly unusual disruptions in Treasury financing markets associated with the coronavirus outbreak.”
The announcement may help to shore up investor sentiment as “the terms of operations will be adjusted as needed to foster smooth Treasury market functioning and efficient and effective policy implementation,” but the Federal Open Market Committee (FOMC) appears to be on track to deliver another rate cut on March 18 as COVID-19 continues to drag on the global supply chain and undermines the outlook for growth.

In fact, Fed Fund futures reflect 100% probability for a rate cut, with market participants pricing a greater than 80% chance for a 100bp reduction in the benchmark interest rate. It remains to be seen if the FOMC will pursue a zero-interest rate policy (ZIRP) after delivering an emergency rate cut for the first time since 2008, and the central bank may resort to unconventional tools later this year as the committee vows to “act as appropriate to support the economy.”

In turn, the update to the Summary of Economic Projections (SEP) may show a material shift in the forward guidance for monetary policy, and the price of gold may continue to benefit from the low interest environment as market participants look for an alternative to fiat-currencies.
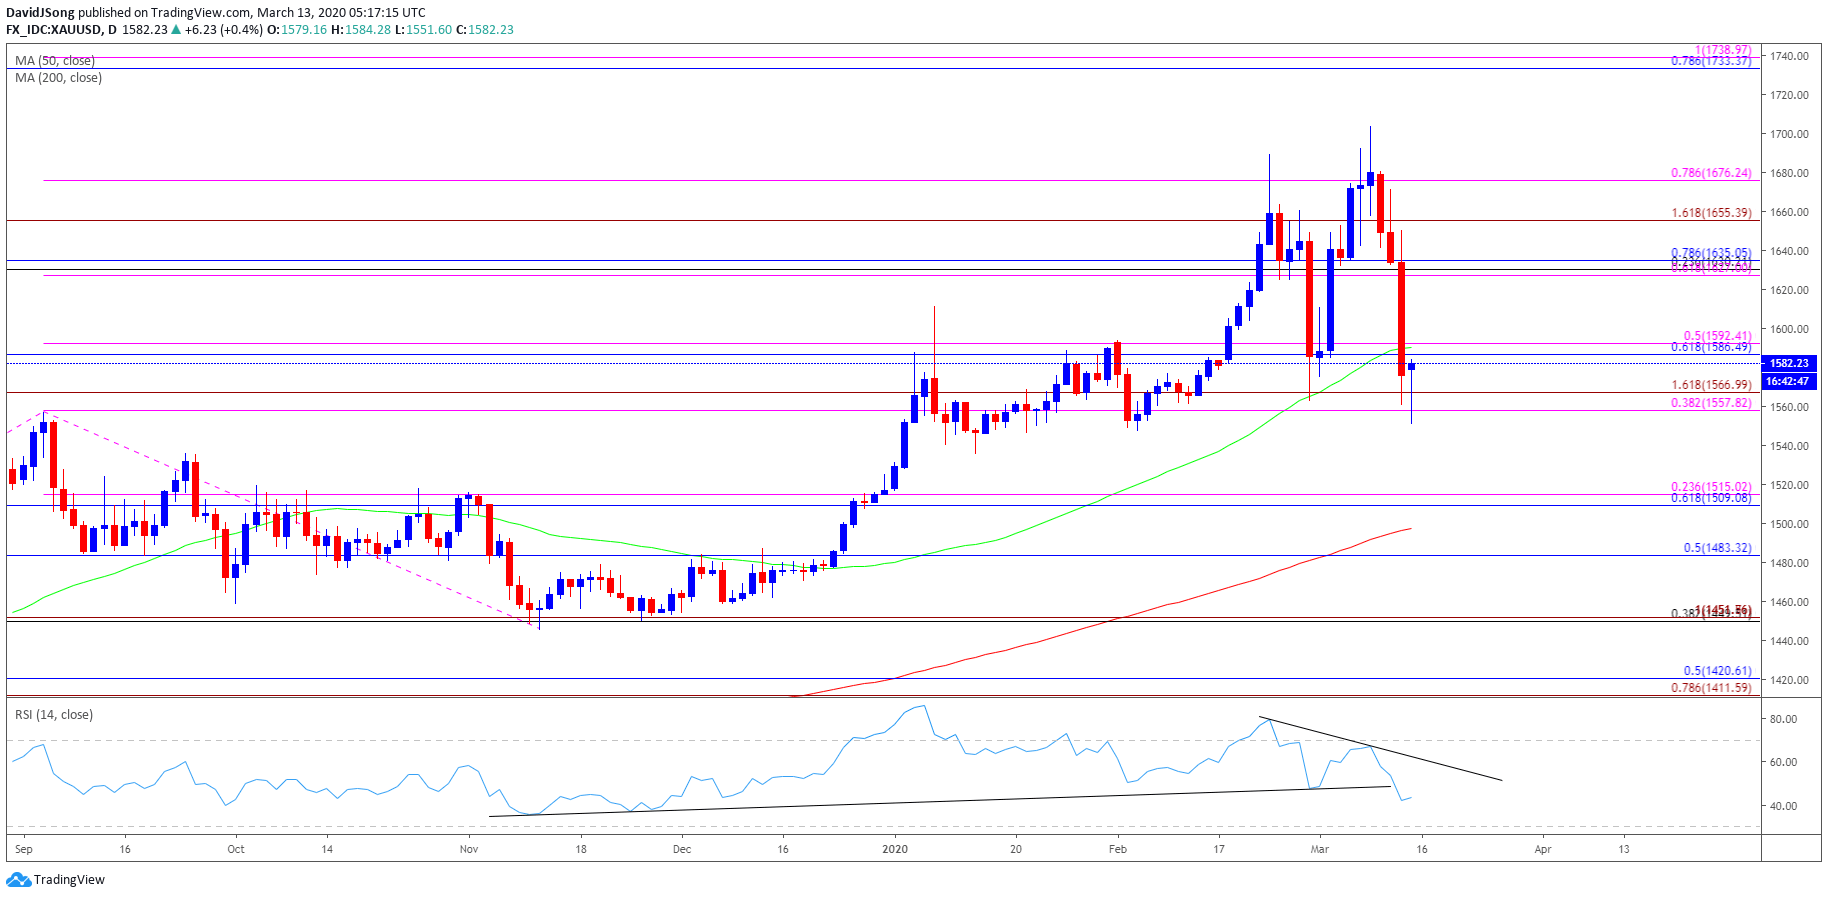
With that said, the broader outlook for bullion remains constructive as the reaction to the former-resistance zone around $1447 (38.2% expansion) to $1457 (100% expansion) helped to rule out the threat of a Head-and-Shoulders formation.
Gold Price Daily Chart
Source: Trading View
The opening range for 2020 instilled a constructive outlook for the price of gold as the precious metal cleared the 2019 high ($1557), with the Relative Strength Index (RSI) pushing into overbought territory during the same period.
A similar scenario materialized in February, with the price of gold marking the monthly low ($1548) during the first full week, while the RSI broke out of the bearish formation from earlier this year to push back into overbought territory.
However, the price of gold has failed to maintain the monthly opening range for March after trading to a fresh yearly high ($1704), with the Relative Strength Index (RSI) signaling a potential change in gold price behavior as the oscillator deviates with price and snaps the upward trend carried over from last year.
In turn, the price of gold may continue to consolidate over the coming days, but a break/close below the $1558 (38.2% expansion) to $1567 (161.8% expansion) region may open up the Fibonacci overlap around $1509 (61.8% retracement) to $1515 (23.6% expansion).
— Written by David Song, Currency Strategist
Follow me on Twitter at @DavidJSong
Be the first to comment